Abstract
The time-dependent deformation property of backfill coral sand is of great important to the long-term stability of engineer facilities bulit on reefs and reclaimed land. In order to investigate the long-term deformation behavior, one-dimensional compression creep tests under different constant stresses were carried out for coral sand taken from a reef in the South China Sea by WG type high-pressure consolidation instrument. The test results show that under the action of constant stress, coral sand has a strong deformation timeliness and shows remarkable nonlinear attenuation creep characteristics. The creep of coral sand has obvious stages and has gone through three stages of instantaneous deformation, accelerated deformation and slow deformation phase tending to stability. The relationship of strain-time can be fitted with power function in mathematic. The particle breakage state of any single particle size group of coral sand after creep can be well described by using the two-parameter Weibull distribution function, Weibull parameters a and b have a good exponential relationship with stress, and have a negative linear relation with quantitative index Br of particle breakage, and have a negatively correlated with final total strain. Under the action of low stress level, the main cause of creep deformation is the movement and recombination of particles. At low stress level, the movement and recombination of particles are the main reason of creep deformation, while at high stress level, the slippage and filling pores of broken coral sand particles are the main reason of creep deformation.
Highlights
- The one-dimensional compressive creep deformation characteristics of coral sand are studied, and a mathematical description model of strain variation with stress and time is established.
- The particle breakage state of coral sand after creep conforms to the two-parameter Weibull distribution function.
- Coral sand creep deformation occurs due to the combined effect of inter-particle movement recombination effect and particle crushing effect.
1. Introduction
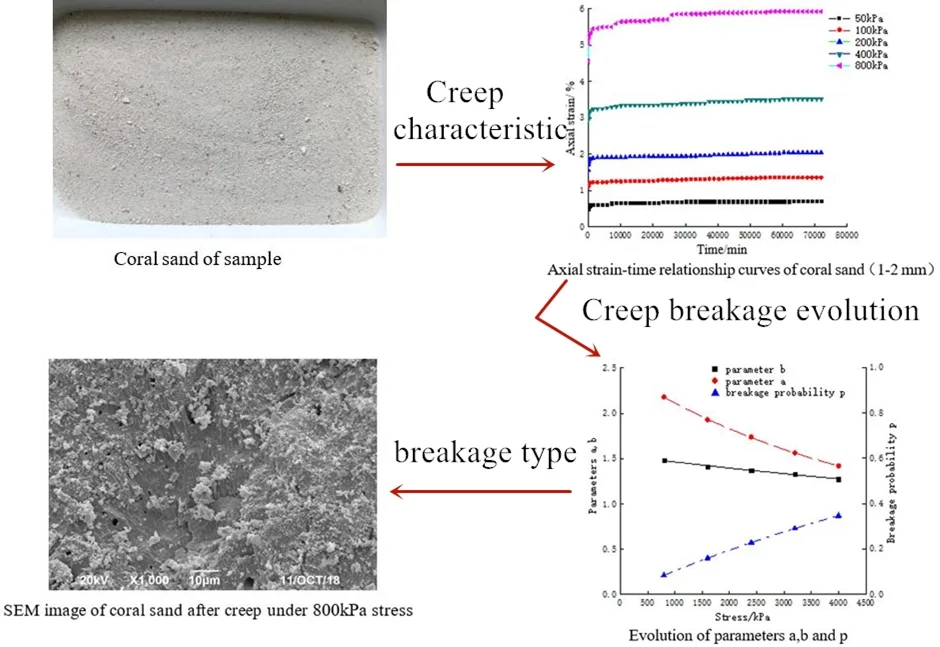
Coral sand usually refers to special geotechnical media rich in calcium carbonate or other carbonate substances caused by marine organisms, and is commonly used as natural filling materials for island reef construction and foundation of marine structures [1]. Compared with common continental and marine sediments, coral sand has high porosity, irregular shape, low particle strength, easy breakage, easy cementation between particles, and very special engineering mechanical properties [2, 3]. At present, a great deal of research work has been carried out on its macro and micro structural characteristics [4-6], static properties [7, 8], cyclic load [9, 10] and mechanical behavior under explosion impact load [11, 12], and fruitful research results have been obtained. According to the relationship between the change rule of mechanical properties of coral sand and the degree of particle breakage found in shear or compression tests of coral sand by Sun Jizhu [13], Zhang Jiaming [14], Wang Yiqun [15], He Jianqiao and others [16], it can be seen that the change of particle-size distribution (PSD) caused by particle breakage under external force is the main reason why the mechanical properties of coral sand are different from those of continental sand [17, 18]. In view of this, many scholars [19-21] have also proposed different quantitative indicators of fragmentation to explain the change law of macro-mechanical properties of sand through PSD changes before and after the test. However, the current research on the correlation between PSD state change of coral sand particles and its creep deformation rule under long-term constant load and the mechanism of creep of coral sand is relatively weak. In the existing literature, Lade et al. [22, 23] put forward the concept of stress drop-creep effect for the time effect of deformation of crushed coral sand, and showed that creep can reshape the structure, and studied the creep characteristics under different confining pressures, initial deviatoric stresses and strain rates. Lv et al. [24] pointed out that quartz sand shows dilatancy during triaxial creep while calcareous sand always shows shear shrinkage. With the increasing number and scale of reef projects, the long-term stability of reef projects has become one of the focuses of people’s attention. The settlement of coral sand foundation with time is an important aspect that affects the long-term stability of artificial reefs and their affiliated buildings [25]. In view of this, one-dimensional compressive creep test was carried out on the main particle size groups of coral sand, and the creep deformation characteristics and particle breakage evolution law after creep were analyzed. The microscopic morphology changes of particles were observed by scanning electron microscopy on the samples after creep test, revealing the creep mechanism of coral sand, which can provide reference for foundation reinforcement in the later stage of existing projects and construction of island reef projects in the future.
2. Test introduction
2.1. Test materials
The sample is taken from an island reef in the South China Sea, which is unconsolidated loose body with white color mixed with red impurities, as shown in Fig. 1. The composition of the sand sample was analyzed by using Japan-made D/MAX-2500/PC X-ray polycrystalline powder diffractometer. The results show that the mineral composition is mainly aragonite and calcite, with CaCO3 content of 90.63 % and MgCO3 content of 8.16 %. Take a proper amount of sand samples, wash them with clear water to remove salt, bake them in an oven at 105℃ for 24 hours, and then screen them with the geotechnical standard sieve. The sample particle splitting curve is shown in Fig. 2, and the basic physical parameters are shown in Table 1. From Table 1 and Fig. 2, it can be seen that the curvature coefficient of the sample satisfies 1-3, but don’t satisfy the condition of non-uniformity coefficient > 5, so it is medium sand with poor gradation.
Fig. 1Coral sand of sample
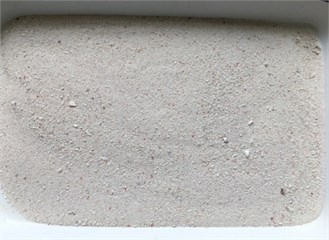
Fig. 2Particle size distribution of sample
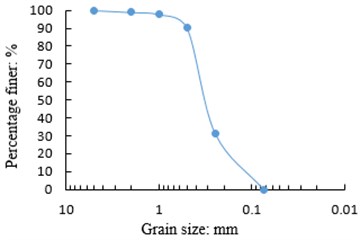
Table 1Basic physical parameters of sample
/ mm | / mm | / mm | |||||
0.78 | 1.14 | 2.77 | 0.13 | 0.32 | 0.37 | 2.85 | 1.20 |
2.2. Test materials
In this test, WG-type high-pressure consolidation apparatus produced by Nanjing Soil Instrument Factory was used, with a maximum axial pressure of 4000 kPa and weight loading. Axial deformation shall be measured by dial indicator with measuring range of 10 mm and minimum dividing value of 0.01 mm. The diameter of the sample is 61.8 mm and the height is 20 mm, all of which are sampled by the sand falling method, that is to say, the weighed sand sample is injected into the consolidation container in two times while the outer wall of the container is vibrated with a small wooden hammer, and then the sand surface is lightly pressed with a wooden handle to smooth the surface.
In order to obtain the whole creep process curve of coral sand under different stresses, four groups of coral sand with main particle size groups of 0.25-0.5 mm, 0.5-1 mm, 1-2 mm and 2-5 mm are selected, and one-dimensional creep tests lasting 50 days are respectively carried out on each particle size group under different stress levels by adopting separate loading mode [26, 27], the specific test scheme is shown in Table 2. And the microscopic morphological changes of the particles are observed by scanning electron microscopy for the samples after creep test. After stress loading, the compression deformation was recorded in sequence for 6 s, 1 min, 2 min, 4 min, 5 min, 8 min, 10 min, 15 min, 30 min, 1 h, 2 h, 4 h, 8 h, 12 h, 24 h, after 24 hours, it will be measured and recorded regularly every day. The comparison test selects ISO standard sand with particle size groups of 0.25-0.5 mm, 0.5-1 mm and 1-2 mm from Xiamen to carry out one-dimensional compression creep test under the same test conditions as coral sand. Another group of comparative test selects coral sand with the same particle size of 1-2 mm, and then standard consolidation tests are respectively carried out under 5 stress levels of 50 kPa, 100 kPa, 200 kPa, 400 kPa and 800 kPa according to (GB/T50123-1999 Standard for Geotechnical Test Methods). When the deformation within 1d is less than 0.01mm, consolidation is deemed to be completed.
Table 2Test plan for the coral sand
Particle size group / mm | Test stress level / kPa | ||||
0.25-0.5 | 50 | 100 | 200 | 400 | 800 |
0.5-1 | 50 | 100 | 200 | 400 | 800 |
1-2 | 50 | 100 | 200 | 400 | 800 |
2-5 | 800 | 1600 | 2400 | 3200 | 4000 |
3. Analysis of creep characteristics of coral sand
3.1. Comparative analysis of compression deformation laws
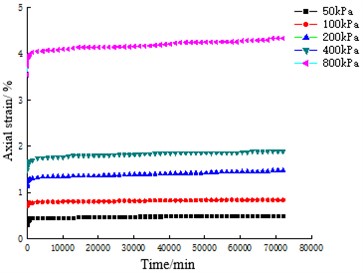
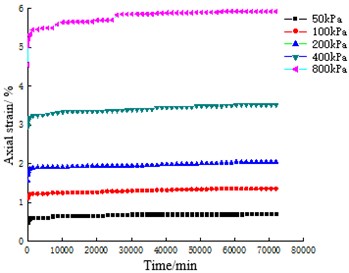
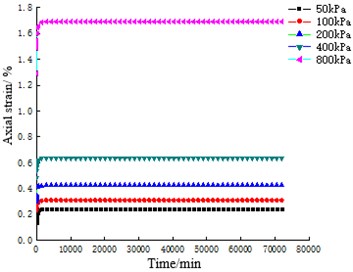
The strain-time curves of coral sand with particle sizes of 0.25-0.5 mm, 0.5-1 mm, 1-2 mm and 2-5 mm for 50 days are shown in Fig. 3. The strain-time curve of ISO standard sand for 50 days under the same particle size groups and test conditions are shown in Fig. 4.
The comparison between Fig. 3 and Fig. 4 shows that under different constant stresses, the creep curves of coral sand are similar in shape and have obvious phases, all of which have experienced instantaneous deformation, accelerated deformation and slow deformation phase tending to stability. However, ISO standard sand only undergoes instantaneous deformation and accelerated deformation in a very short period of time, and the deformation of each sample is stable within 3 days, after which the deformation no longer increases with time.
Statistical analysis is carried out on the strain of coral sand and ISO standard sand in different deformation stages under the same test conditions and the same particle size group respectively, as shown in Table 3 and Table 4. Comparing Table 3 and Table 4, it can be seen that the final strain of coral sand is about 3-6 times that of ISO standard sand, and the deformation stability time is about 14-39 times that of ISO standard sand. Compared with ISO standard sand, the deformation of coral sand is still not finished after experiencing instantaneous deformation and accelerated deformation stages, and the deformation time in this stage is positively correlated with the test load, with the shortest time being 21 days and the longest 45 days, accounting for 41.83 % and 89.98 % of the total deformation time respectively. Obviously, under the action of constant load, the creep characteristics of coral sand are obviously different from ISO standard sand. Coral sand needs a longer time to stabilize, and its deformation is more time-effective, and it presents obvious nonlinear attenuation creep characteristics.
Fig. 3Axial strain-time relationship curves of coral sand with different particle sizes
a) 0.25-0.5 mm
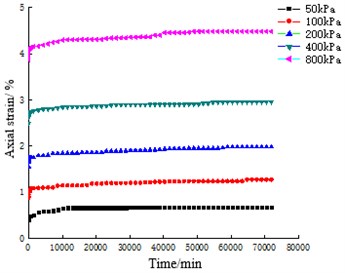
b) 0.5-1 mm
c) 1-2 mm
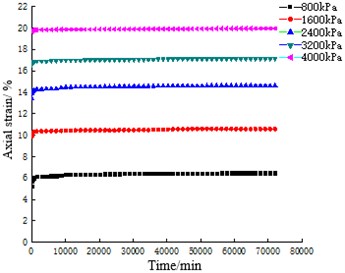
d) 2-5 mm
Fig. 4Axial strain-time relationship curves of ISO standard sand with different particle sizes
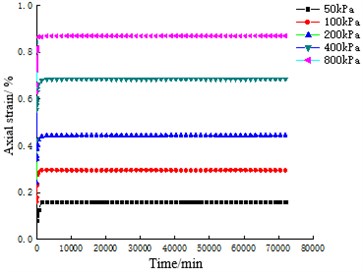
a) 0.25-0.5 mm
b) 0.5-1 mm
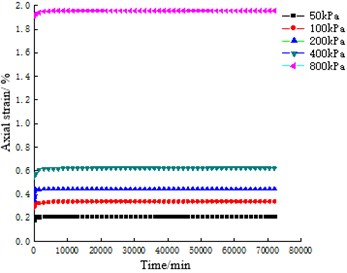
c) 1-2 mm
Table 3Deformation amount of coral sand in different deformation stages
Stress / kPa | Particle size /mm | Instantaneous strain / % | Acceleration strain / % | Creep strain / % | Total strain / % | Creep strain / total strain / % |
50 | 0.25-0.5 | 0.30 | 0.10 | 0.11 | 0.51 | 21.78 |
0.5-1.0 | 0.41 | 0.05 | 0.23 | 0.68 | 33.82 | |
1.0-2.0 | 0.49 | 0.07 | 0.15 | 0.71 | 21.28 | |
100 | 0.25-0.5 | 0.71 | 0.06 | 0.08 | 0.84 | 9.52 |
0.5-1.0 | 0.89 | 0.13 | 0.27 | 1.28 | 20.78 | |
1.0-2.0 | 1.1 | 0.05 | 0.21 | 1.36 | 15.5 | |
200 | 0.25-0.5 | 1.13 | 0.12 | 0.24 | 1.48 | 15.93 |
0.5-1.0 | 1.55 | 0.17 | 0.27 | 1.98 | 13.38 | |
1.0-2.0 | 1.56 | 0.19 | 0.3 | 2.05 | 14.67 | |
400 | 0.25-0.5 | 1.49 | 0.11 | 0.3 | 1.89 | 15.61 |
0.5-1.0 | 2.5 | 0.22 | 0.24 | 2.96 | 8.12 | |
1.0-2.0 | 2.95 | 0.16 | 0.41 | 3.52 | 11.66 | |
800 | 0.25-0.5 | 3.55 | 0.26 | 0.53 | 4.34 | 12.23 |
0.5-1.0 | 3.87 | 0.19 | 0.43 | 4.48 | 9.49 | |
1.0-2.0 | 4.55 | 0.61 | 0.77 | 5.93 | 12.91 |
Table 4Deformation amount of ISO standard sand in different deformation stages
Stress / kPa | Particle size / mm | Instantaneous strain / % | Acceleration strain / % | Total strain / % |
50 | 0.25-0.5 | 0.08 | 0.08 | 0.16 |
0.5-1.0 | 0.14 | 0.1 | 0.24 | |
1.0-2.0 | 0.19 | 0.03 | 0.22 | |
100 | 0.25-0.5 | 0.16 | 0.14 | 0.3 |
0.5-1.0 | 0.24 | 0.08 | 0.31 | |
1.0-2.0 | 0.29 | 0.05 | 0.34 | |
200 | 0.25-0.5 | 0.24 | 0.21 | 0.45 |
0.5-1.0 | 0.3 | 0.13 | 0.43 | |
1.0-2.0 | 0.35 | 0.1 | 0.45 | |
400 | 0.25-0.5 | 0.43 | 0.26 | 0.69 |
0.5-1.0 | 0.49 | 0.15 | 0.64 | |
1.0-2.0 | 0.55 | 0.07 | 0.62 | |
800 | 0.25-0.5 | 0.63 | 0.24 | 0.87 |
0.5-1.0 | 1.29 | 0.4 | 1.69 | |
1.0-2.0 | 1.91 | 0.05 | 1.96 |
3.2. Relationship between creep deformation and time of coral sand
According to the research on the creep law of indoor soil, the empirical theory is based on the deformation reaction of soil under actual stress. The general form is simple and convenient for practical application. At the same time, its results also have some enlightening effects on the study of creep mechanism and structural model, and it is one of the main approaches for indoor research [28-32]. Therefore, based on the analysis of the deformation process of the three particle size groups of 0.25-0.5 mm, 0.5-1 mm and 1-2 mm, the function formula of coral sand strain-time is constructed by using the empirical theoretical method, which can be expressed as:
where and are creep parameters and is creep time.
As shown in Table 5, the fitting correlation coefficient is between 0.9026 and 0.9826, so there is a power function relationship between them. Eq. (1) can well describe the relationship between creep deformation of coral sand and time. In addition, it can be seen from Table 5 that under the same particle size group, the creep parameter is positively correlated with the test load, and the creep parameter is negatively correlated with the test load. Regression analysis is carried out on creep parameters and and stress respectively, as shown in Fig. 5 and Table 6. As can be seen from Fig. 5(a), creep parameter is linearly related to stress. As can be seen from Fig. 5(b), creep parameter is exponentially related to stress.
Table 5Fitting parameters of creep time of coral sand with different particle sizes
Particle size / mm | Fitting equation | 50 / kPa | 100 / kPa | 200 / kPa | 400 / kPa | 800 / kPa |
1-2 | 0.0049 | 0.0107 | 0.0167 | 0.0296 | 0.0490 | |
0.0329 | 0.0196 | 0.0165 | 0.0139 | 0.0164 | ||
0.9629 | 0.9059 | 0.9348 | 0.9112 | 0.9285 | ||
0.5-1 | 0.0038 | 0.0087 | 0.0160 | 0.0259 | 0.0386 | |
0.0530 | 0.0321 | 0.0173 | 0.0107 | 0.0125 | ||
0.9518 | 0.9643 | 0.9026 | 0.9343 | 0.9114 | ||
0.25-0.5 | 0.0032 | 0.072 | 0.0111 | 0.0151 | 0.0369 | |
0.0403 | 0.0324 | 0.0229 | 0.0192 | 0.0127 | ||
0.9826 | 0.9214 | 0.9525 | 0.9634 | 0.9423 |
Fig. 5Relationship between creep parameters α, β and stress
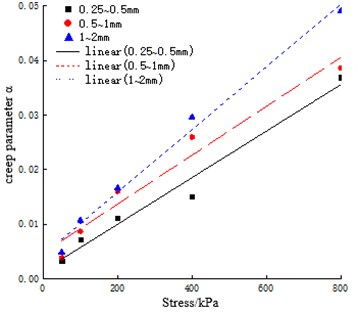
a) Creep parameter
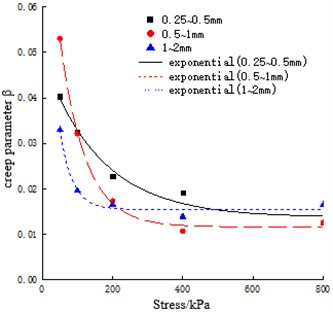
b) Creep parameter
Table 6Fitting α, β with σ for different particle sizes
Creep parameter | Particle size / mm | Fitting equation | |
0.25-0.5 | 4.26E-5+0.0015 | 0.9666 | |
0.5-2 | 4.48E-5+0.0047 | 0.9480 | |
1-2 | 5.74E-5+0.0049 | 0.9855 | |
0.25-0.5 | 0.0137+0.0354e-0.0062σ | 0.9589 | |
0.5-2 | 0.0116+0.08254e-0.0138σ | 0.9958 | |
1-2 | 0.0155+0.0722e-0.0284σ | 0.9641 |
4. Analysis on evolution law of creep crushing of coral sand
4.1. Weibull distribution model
When the stress has reached a sufficient level, coral sand particles with a single particle diameter (the actual particle diameter is -, where and are the diameters of sieve pores ) will be crushed and split into particles with smaller diameter ( 1,2, ..., ). Here only the distribution of new particles generated from breakage is considered. From the perspective of probability theory and statistics, particle breakage can be regarded as a probability event. Particle breakage probability can be defined as:
where represents the probability of a single particle breaking under a certain stress state.
If only the distribution state of other smaller particle size particles produced after particle crushing is considered. According to studies by Tong Chenxi [33], Zhang S [34], the particle size distribution of rock and soil particles after crushing generally conforms to Weibull distribution model, which can be expressed as:
where is defined as the cumulative percentage of the total crushed mass, and a is scaling parameter and b is shape parameter, and the particle size ratio is defined as /.
Eq. (3) can also be rewritten as:
Letting and , Eq. (4) can then be expressed as:
and can be calculated from the PSD data obtained by particle sieving. With known and , parameters a and b can be obtained by the linear regression analysis using Eq. (5). When and are known, the whole broken state of the broken sample can be obtained according to the sample quality.
4.2. Description of crushing state of coral sand-Weibull distribution function
The sample mass of the 2-5 mm particle size group is 85.62 g, particle screening data after creep tests under stress of 800 kPa, 1600 kPa, 2400 kPa, 3200 kPa and 4000 kPa are shown in Table 7.
Substituting the data in Table 7 into Eq. (1) to calculate particle breakage probability , substituting into Eq. (5) to perform data fitting, and the results are shown in Table 8 and Fig. 6. As can be seen from Fig. 6 and Table 8, under the condition of one-dimensional compression, the particle size distribution state of smaller particles produced by crushing coral sand with single particle size conforms to Weibull function distribution.
Fig. 7 is a fitting curve of Weibull distribution parameters a, b, breakage probability p and stress , and the fitting parameters are shown in Table 9. As can be seen from Fig. 7 and Table 9, with the continuous increase of stress, the values of parameters and gradually decrease, and the breakage probability gradually increases. All of them have a good exponential relationship with stress and tend to evolve to a fixed value.
Table 7The mass of each particle size of coral sand (2-5 mm) after the test
Stress / KPa | Quality of each particle size group after test / g | |||||
5-2 | 2-1 | 1-0.5 | 0.5-0.25 | 0.25-0.075 | < 0.075 | |
800 | 78.45 | 5.14 | 1.60 | 0.32 | 0.09 | 0.02 |
1600 | 71.89 | 9.12 | 3.47 | 0.71 | 0.29 | 0.06 |
2400 | 66.09 | 12.11 | 5.49 | 1.33 | 0.49 | 0.11 |
3200 | 60.78 | 14.42 | 7.39 | 2.01 | 0.84 | 0.18 |
4000 | 55.97 | 15.68 | 9.59 | 2.73 | 1.53 | 0.3 |
Table 8Values of Weibull distribution parameters a, b and breakage probability p under different stresses
Stress / kPa | 800 | 1600 | 2400 | 3200 | 4000 |
0.0837 | 0.1596 | 0.2281 | 0.2901 | 0.3463 | |
2.1802 | 1.9281 | 1.7370 | 1.5628 | 1.4173 | |
1.4811 | 1.4136 | 1.3702 | 1.3304 | 1.2717 | |
0.9967 | 0.9972 | 0.9957 | 0.9989 | 0.9994 |
Fig. 6Fitting relationships X and Y
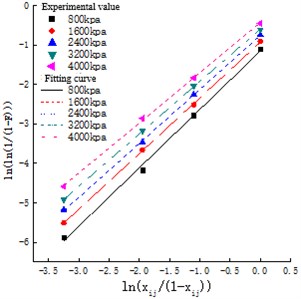
Fig. 7Evolution of parameters a, b and p
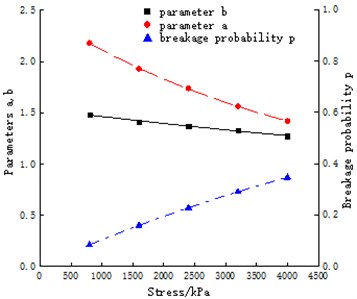
Table 9Fitting parameters of Weibull distribution parameters a, b, breakage probability p and stress σ
Parameters | Fitting equation | Correlation coefficient / |
0.9857 | ||
0.9952 | ||
0.9986 |
In addition, theoretical values of particle breakage probability p of coral sand at 50 kPa, 100 kPa, 200 kPa, 400 kPa, 800 kPa can be calculated from Table 9. Compared with the actual value of particle breakage probability p of each particle size group under the action of each stress, as shown in Table 10. It can be seen from Table 10 that the particle breakage probability p of coral sand is related to the stress level, and has nothing to do with the particle size. Therefore, for coral sand of any single particle size group, the particle breakage state conforms to the above Weibull distribution evolution rule.
Table 10Comparison of theoretical value and experimental value of p of coral sand for different particle sizes
Stress / kPa | 50 | 100 | 200 | 400 | 800 | |
0.0055 | 0.0109 | 0.0217 | 0.0429 | 0.0837 | ||
0.25-0.5 mm | 0.0054 | 0.0107 | 0.0216 | 0.0428 | 0.0836 | |
Relative error | 2.35 % | 1.42 % | 0.43 % | 0.31 % | 0.08 % | |
0.5-1 mm | 0.0057 | 0.0110 | 0.0219 | 0.0432 | 0.0839 | |
Relative error | 3.39 % | 1.30 % | 0.73 % | 0.58 % | 0.25 % | |
1-2 mm | 0.0058 | 0.0112 | 0.0218 | 0.0430 | 0.0838 | |
Relative error | 4.65 % | 2.60 % | 0.48 % | 0.31 % | 0.07 % | |
Note: | ||||||
5. Analysis of creep mechanism of coral sand
There are two main creep factors for geotechnical granular materials: one is the continuous rotation and movement of soil particles with time under the action of load, that is to say, the adjustment of particle position; the other is the time-related fatigue fracture of geotechnical particles under the continuous action of load, that is to say, particle breakage [35, 36]. For ISO standard sand, the particle breaking stress is 12.8 MPa [37]. Within the stress range of this test, the particle will not be broken, so its deformation is mainly caused by the adjustment of particle position. However, coral sand particles have low strength and are easy to be broken. In the following, taking coral sand with a particle size of 1-2 mm as an example, the creep mechanism of coral sand is discussed from the point of view of particle breakage and combination with the change of particle morphology after creep.
In order to quantify the degree of particle breakage, the relative breakage rate proposed by Hardin [19] is used as the quantitative index, which is currently the most widely used, and its calculation formula is as follows:
where is the total amount of crushing, that is to say, the area enclosed by the particle gradation curve before and after crushing and the vertical line segment with particle size of 0.074 mm; is the crushing potential, that is to say, the area enclosed by the initial grading curve and the vertical line segment with particle size of 0.074 mm.
PSD test data of each sample after creep test of coral sand with particle size group of 1-2 mm are shown in Table 11. Under the same test conditions, the consolidation test of coral sand was completed within 2 days, PSD test data of each sample after the test are shown in Table 12. The data in Table 11 and Table 12 are substituted into Eq. (6) to calculate the relative breakage rate of the samples after each test, as shown in Table 13. As can be seen from Table 13, after the consolidation of coral sand is completed, its particle breakage is not completed. With the increase of stress acting time, coral sand continues to break, indicating that particle breakage has certain timeliness. However, ISO standard sand did not break within the stress range of this test, thus making the creep deformation of coral sand have stronger deformation timeliness than ISO standard sand.
Table 11PSD after creep test of coral sand (1-2 mm)
Stress / KPa | Percentage finer / % | ||||
2 | 1 | 0.5 | 0.25 | 0.075 | |
50 | 100 | 2.00 | 0.692 | 0.615 | 0.492 |
100 | 100 | 2.169 | 0.769 | 0.662 | 0.462 |
200 | 100 | 2.338 | 0.846 | 0.815 | 0.462 |
400 | 100 | 4.289 | 1.055 | 0.769 | 0.415 |
800 | 100 | 8.370 | 2.272 | 0.862 | 0.508 |
Table 12PSD after consolidation test of coral sand (1-2 mm)
Stress / KPa | Percentage finer / % | ||||
2 | 1 | 0.5 | 0.25 | 0.075 | |
50 | 100 | 0.548 | 0.123 | 0.025 | 0.003 |
100 | 100 | 1.092 | 0.248 | 0.051 | 0.006 |
200 | 100 | 2.171 | 0.507 | 0.106 | 0.013 |
400 | 100 | 2.692 | 0.892 | 0.225 | 0.027 |
800 | 100 | 5.754 | 1.492 | 0.507 | 0.065 |
Table 13Relative breakage rate of coral sand (1-2 mm) after each test
Type of test | of coral sand under different stresses | ||||
50 KPa | 100 KPa | 200 KPa | 400 KPa | 800 KPa | |
Consolidation test | 0.0032 | 0.0065 | 0.0109 | 0.0179 | 0.0458 |
Creep test | 0.0136 | 0.0147 | 0.0160 | 0.0257 | 0.0508 |
Relative error | 76.07 % | 55.93 % | 31.85 % | 30.35 % | 9.84 % |
Note: relative error = ( under creep test – under consolidation test) / under creep test | |||||
Fig. 8SEM image of coral sand after creep test under different Stresses
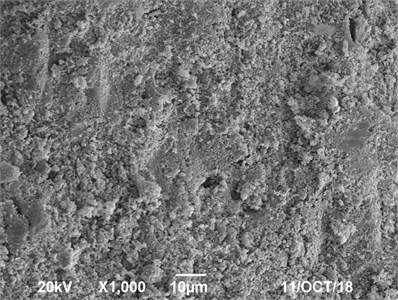
a) 50 kPa stress
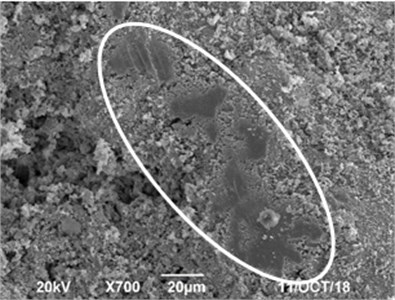
b) 200 kPa stress
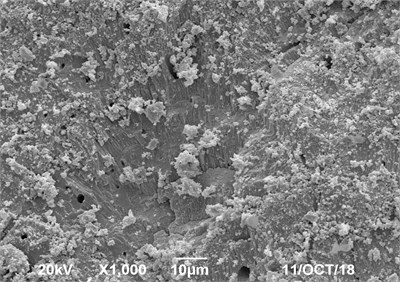
c) 800 kPa stress-fracture
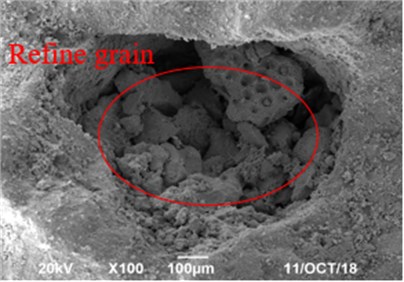
d) 800 kPa stress-filling
The microstructure of coral sand after creep under different stresses is shown in Fig. 8. As can be seen from Fig. 8(a), under the stress of 50 kPa, there are many scratches on the surface of particle due to the relative movement of the particles, and the particle breakage performance is extremely insignificant under this stress level, so the adjustment and rearrangement of the positions between the particles are the main reason of creep deformation of coral sand. As can be seen from Fig. 8(b), under the stress of 200 kPa, during the process of particle movement and recombination, the rough particle surface is worn and broken due to friction, resulting in the increase of fine particles. When the stress increases to 800 kPa, it can be seen from Fig. 8(c) and Fig. 8(d) that the particles are cracked and the internal pores are clearly visible, the crushed and refined fine particles slip to fill the pores of the particles themselves in the process of moving and recombining. Compared with 50 kPa stress, the particle breakage is more severe and the overall breakage degree of the sample increases, and the relative breakage rate Br under the stress is 3.74 times that under 50 kPa, and the resulting final strain is 8.41 times that under 50 kPa. Obviously, under the higher stress conditions, the main reason of creep deformation is filling pores with crushed and refined coral sand particles.
In addition, Weibull distribution parameters a and b after creep crushing of coral sand under this stress range are calculated from Table 9, as shown in Table 14. According to the analysis of Fig. 8, Table 11 and Table 14, the smaller the parameter a, the more severe the particle breakage, the more fine particles produced, and the smaller the parameter , the more uniform the particle composition distribution of the crushed sample. Further regression analysis is carried out on parameters a and b, the final total strain and the relative breakage rate respectively, as shown in Fig. 9 and Fig. 10. As can be seen from Fig. 9, Weibull distribution parameters a and b have negative linear correlation with the relative breakage rate . As can be seen from Fig. 10, the final total strain has a positive correlation with the relative breakage rate , and has a good logarithmic relationship. Obviously, Weibull distribution parameters a and b describe the overall broken degree of the sample after creep. The smaller the parameters a and b, the greater the overall broken degree of the sample, and the greater the creep deformation, which has a negative correlation with the final deformation amount.
Fig. 9Relationship between a, b and Br
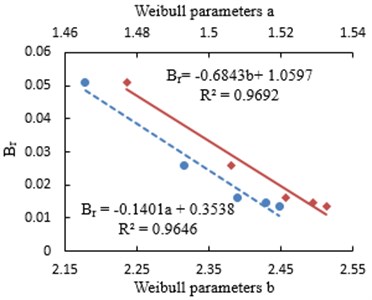
Fig. 10Relationship between Br and total strain
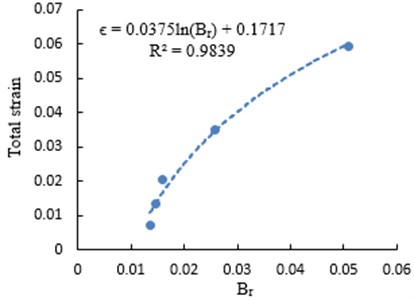
Table 14Weibull distribution parameters a, b after creep test of coral sand (1-2 mm)
Stress / kPa | 50 | 100 | 200 | 400 | 800 |
2.4479 | 2.4284 | 2.3902 | 2.3163 | 2.1778 | |
1.5326 | 1.5288 | 1.5212 | 1.5063 | 1.4772 |
6. Conclusions
In this paper, taking coral sand from an island reef in the South China Sea as a sample, one-dimensional compressive creep tests are carried out on its main particle size groups, which are compared with ISO standard sand. Through analysis of test data, the following conclusions are obtained:
1) Coral sand has stronger deformation timeliness than ISO standard sand, showing significant nonlinear attenuation creep characteristics. The creep of coral sand has obvious stages, which has experienced instantaneous deformation, accelerated deformation and slow deformation phase tending to stability. The strain-time relationship can be well described mathematically by power function. The creep parameter α has a linear relationship with stress, and the creep parameter has a exponential function relationship with stress.
2) The two-parameter Weibull distribution function can well describe the particle crushing state of any single particle size group of coral sand after creep. Weibull distribution parameters a and b have good exponential relationship with the stress, and have a negative linear correlation with particle breakage quantitative index Br, and have a negative correlation with the final creep deformation.
3) Under the action of constant stress, coral sand particle breakage has a certain timeliness, and creep occurs under the combined action of particle movement recombination effect and particle breakage effect. Under the low stress condition, the amount of particle breakage is not obvious, and creep deformation is mainly caused by movement recombination and arrangement optimization among coral sand particles. Under the higher stress conditions, in the process of relative sliding of particles, the surface of rough particles is worn and broken, and some particles are broken, the main reason of creep deformation is that crushed and refined coral sand particles fill the pores.
References
-
Hassanlourad M., Salehzadeh H., Shahnazari H. Dilation and particle breakage effects on the shear strength of calcareous sands based on energy aspects. International Journal of Civil Engineering, Vol. 6, Issue 8, 2008, p. 108-119.
-
Yu H. B., Sun Z. X., Tang C. Physical and mechanical properties of coral sand in the Nansha Islands. Marine Science Bulletin, Vol. 2, 2006, p. 31-39.
-
Jin Z. C., Chen W. J., Wang X. Z. Study on engineering application of natural repose angle of calcareous sand. Rock and Soil Mechanics, Vol. 39, Issue 7, 2018, p. 2583-2590.
-
Zhu C. Q., Zhou B., Liu H. F. Study on strength and microstructure of naturally cemented calcareous soil. Rock and Soil Mechanics, Vol. 6, Issue 35, 2014, p. 1655-1663.
-
Zhu C. Q., Chen H. Y., Meng Q. S. Microscopic characterization of intra-pore structures of calcareous sands. Rock and Soil Mechanics, Vol. 7, Issue 35, 2014, p. 1831-1836.
-
Jang M. J., Wu D., Cao P. Connected inner pore analysis of calcareous sands using SEM. Chinese Journal of Geotechnical Engineering, Vol. 39, 2017, p. 1-5.
-
Wang X. Z., Wang R., Meng Q. S. Study of plate load test of calcareous sand. Rock and Soil Mechanics, Vol. 30, Issue 1, 2009, p. 147-151.
-
Zhang J. M., Jang G. S., Wang R. Research on influences of particle breakage and dilatancy on shear strength of calcareous sands. Rock and Soil Mechanics, Vol. 30, Issue 7, 2009, p. 2043-2048.
-
Kaggwaw S., Booker J. R., Carter J. P. Residual strains in calcareous sand due to irregular cyclic loading. Journal of Geotechnical Engineering, Vol. 117, Issue 2, 1991, p. 201-218.
-
Yu H. Z., Wang R., Zhao W. G. Experimental research on development pattern of pore water pressure of carbonate sand under wave loads. Journal of Wuhan University of Technology, Vol. 28, Issue 11, 2006, p. 86-89.
-
Zhao Y. L., Zhang L. Y., Wang W. J., Tang J. Z., Lin H., Wan W. Transient pulse test and morphological analysis of single rock fractures. International Journal of Rock Mechanics and Mining Sciences, Vol. 91, 2017, p. 139-154.
-
Xu X. Y., Wang R., Hu M. J. Experimental study of dynamic characteristics of saturated calcareous soil explosion compaction. Rock and Soil Mechanics, Vol. 33, Issue 2, 2012, p. 402-406.
-
Sun J. Z., Wang R. Influence of confining pressure on particle breakage and shear expansion of calcareous sand. Chinese Journal of Rock Mechanics and Engineering, Vol. 23, Issue 4, 2004, p. 641-644.
-
Zhang J. M., Wang R., Shi X. F. Compression and crushing behavior of calcareous sand under confined compression. Chinese Journal of Rock Mechanics and Engineering, Vol. 24, Issue 18, 2005, p. 3327-3331.
-
Wang Y. H., Hong Y., Guo Z. Micro-and macro-mechanical behavior of crushable calcareous sand in South China Sea. Rock and Soil Mechanics, Vol. 39, Issue 1, 2018, p. 199-206+215.
-
He J. Q., Wei H. Z., Meng Q. S. Evolution of particle breakage of calcareous sand under large displacement shearing. Rock and Soil Mechanics, Vol. 39, Issue 1, 2018, p. 165-172.
-
Wu J. P., Chu Y., Lou Z. G. Influence of particle breakage on deformation and strength properties of calcareous sands. Chinese Journal of Geotechnical Engineering, Vol. 19, Issue 5, 1997, p. 51-57.
-
Zhang J. M., Zhang L., Liu H. Experimental research on shear behavior of calcareous sand. Chinese Journal of Rock Mechanics and Engineering, Vol. 27, 2008, p. 3010-3015.
-
Hardin B. O. Crushing of soil particles. Journal of Geotechnical Engineering, Vol. 111, Issue 10, 1985, p. 1177-1192.
-
Marsal R. J. Large scale testing of rockfill materials. Journal of the Soil Mechanics and Foundations Division, Vol. 93, Issue 2, 1967, p. 27-44.
-
Einavi Breakage mechanics – Part I: theory. Journal of the Mechanics and Physics of Solids, Vol. 6, Issue 55, 2007, p. 1274-1297.
-
Lade P. V., Ligio J. R. C. D., Nam J. Strain Rate, creep, and stress drop-creep experiments on crushed coral sand. Journal of Geotechnical and Geoenvironmental Engineering, Vol. 135, Issue 7, 2009, p. 941-953.
-
Lade P. V., Nam J., Ligio J. R. C. D. Effects of particle crushing in stress drop-relaxation experiments on crushed coral sand. Journal of Geotechnical and Geoenvironmental Engineering, Vol. 136, Issue 3, 2010, p. 500-509.
-
Lv Y. R., Li F., Liu Y. W. Comparative study of coral sand and silica sand in creep under general stress states. Canadian Geotechnical Journal, Vol. 54, Issue 11, 2017, p. 1601-1611.
-
Fan P. X., Wang J. B., Wang D. R. The medium and long term settlement of reclamation airports. Proceedings of 6th National Conference on Engineering Safety and Protection, Xiangtan, 2018, p. 393-401.
-
Zhao Y. L., Zhang L. Y., Wang W. J. Creep behavior of intact and cracked limestone under multi-level loading and unloading cycles. Rock and Soil Mechanics, Vol. 6, Issue 50, 2017, p. 1409-1424.
-
Zhao Y. L., Wang Y. X., Wang W. J. Modeling of non-linear rheological behavior of hard rock using triaxial rheological experiment. International Journal of Rock Mechanics and Mining Sciences, Vol. 93, 2017, p. 66-75.
-
Zhao Y. L., Zhang L. Y., Wang W. J. Separation of elastoviscoplastic strains of rock and a nonlinear creep model. International Journal of Geomechanics, Vol. 18, Issue 1, 2018, p. 1943-5622.
-
Zhang Y., Xue Y. Q., Shi X. Q. Study on nonlinear creep model for saturated sand. Rock and Soil Mechanics, Vol. 12, Issue 37, 2005, p. 1869-1873.
-
Zhao Y., Wang Y., Wang W., Tang L., Liu Q., Cheng G. Modeling of rheological fracture behavior of rock cracks subjected to hydraulic pressure and far field stresses. Theoretical and Applied Fracture Mechanics, Vol. 101, 2019, p. 59-66.
-
Zhao Y. L., Luo S. L., Wang Y. X., Wang W. Y., Zhang L. Y., Wan W. Numerical analysis of karst water inrush and a criterion for establishing the width of water-resistant rock pillars. Mine Water and the Environment, Vol. 36, 2017, p. 508-519.
-
Zhao Y. L., Zhang L. Y., Wang W. J., Pu C. Z., Wan W., Tang J. Z. Cracking and stress-strain behavior of rock-like material containing two flaws under uniaxial compression. Rock Mechanics and Rock Engineering, Vol. 49, 2016, p. 2665-2687.
-
Tong C. X., Zhang L., Li X. Evolution of geotechnical materials based on Markov chain considering particle crushing. Chinese Journal of Geotechnical Engineering, Vol. 5, Issue 37, 2015, p. 870-877.
-
Zhang S., Chen X. T., Li X. A new method for studying the evolution of particle breakage. Géotechnique, Vol. 11, Issue 65, 2015, p. 911-922.
-
Auustesen A., Liingaard M., Lade P. V. Evaluation of time-dependent behavior of soils. International Journal of Geomechanics, Vol. 3, Issue 4, 2004, p. 137-156.
-
Karimpour H., Lade P. V. Creep behavior in Virginia beach sand. Canadian Geotechnical Journal, Vol. 11, Issue 50, 2013, p. 1159-1178.
-
Huang Particle W. J. crushing mechanism of natural quartz sand under high stress conditions. China Water Transport, Vol. 5, Issue 7, 2007, p. 28-29.
About this article

National Natural Science Foundation of China (51308485).
