Abstract
The membrane air spring possesses the advantage of variable vertical stiffness. However, under limited vertical installation space, further investigation is required to analyze how variations in the rubber airbag cord parameters influence the vertical stiffness of membrane air springs. A finite element model of a specific membrane air spring was developed. Under a compression displacement of 40 mm, the effects of parameters such as the number of rubber airbag cord layers, cord spacing, cord angle, and cord cross-sectional area on vertical stiffness were examined. The results indicate that vertical stiffness decreases with an increase in cord spacing or cord angle, but increases with greater cord cross-sectional area or number of cord layers. Subsequently, the orthogonal experimental method was applied to construct an L9 (34) orthogonal table, and the influence of the four cord parameters on the vertical stiffness of the membrane air spring under 40 mm compression displacement was analyzed. The findings revealed that vertical stiffness is least affected by cord angle and most affected by the number of cord layers. The variation trend of vertical stiffness was determined by fitting the optimal parameter combination. Finally, the combination of four cord parameters yielding the maximum vertical stiffness was evaluated when the compression displacement increased to 50 mm, providing a reference for air spring configuration design in confined spaces.
Highlights
- When three parameters remained constant and only one was varied, the vertical stiffness of the membrane air spring decreased with increasing cord spacing and cord angle, while it increased with larger cord cross-sectional area and greater number of cord layers.
- The number of cord layers exhibited the most significant effect on vertical stiffness, with an increase in layer count producing a pronounced enhancement in stiffness. The effects of cord spacing and cord cross-sectional area were moderate in compar.
- When the compression displacement was set to 50 mm, the maximum vertical stiffness was obtained when the number of cord layers was 6, the cord spacing was 3 mm, the cord angle was 15°, and the cord cross-sectional area was 0.283 mm2.
1. Introduction
Air springs are widely employed as crucial vibration-damping components in vehicle suspension systems and air-floating vibration isolation platforms due to their advantages, including adjustable vertical stiffness, low natural frequency, and nonlinear damping characteristics [1]. In large-load vibration isolation platforms used in high-end equipment such as carrier rockets, the installation space is often restricted. Under such limitations, the vertical stiffness of conventional air springs often fails to meet the performance requirements of large-load vibration isolation systems. Therefore, it is of practical significance to study the structural characteristics and parameter variations of rubber airbags in air springs to improve their vertical stiffness in confined spaces.
In recent years, researchers have conducted numerous studies on the vertical stiffness of air springs from the perspectives of cord parameters and other structural factors. Regarding the effect of cord parameters on vertical stiffness, Zhou, et al. [2] established a finite element model of a membrane air spring based on its nonlinear material properties, geometric configuration, and contact behavior. The results indicated that, within a certain range, cord parameters are key factors influencing the vertical stiffness characteristics of membrane air springs. Lee and Kim [3] developed a relationship between the laying angle of the cord layer and its radial position by analyzing deformation patterns under different load conditions, including vertical, lateral, and torsional loads. By comparing different layup angles, they examined how these variations affect the vertical, lateral, and torsional stiffness of the air spring. Zhang, et al. [4] discussed the nonlinear behavior of air springs from the perspectives of capsule material properties and the geometric configuration of rubber airbags. A sensitivity analysis of bladder-type air springs revealed that the number of cord layers exerts the most significant influence on vertical stiffness. To further investigate the aging mechanism of air springs, Lu, et al. [5] analyzed the effects of aging time on the vertical static stiffness of air springs. The study demonstrated that the vertical static stiffness increases with aging time, and that the aging of both the air spring cord material and rubber material contributes to this increase.
In addition, several researchers have examined the vertical stiffness of air springs from the perspective of innovative structural designs. Yin, et al. [6] proposed an air spring-based dynamic vibration absorber and investigated its damping and vibration reduction performance. The results showed that, by properly adjusting the air pressure and the throttle opening, the air spring vibration absorber could achieve a suitable vibration absorption frequency and damping ratio, thereby obtaining a broad vibration reduction effect. Oman and Nagode [7] analyzed two types of piston structures and compared their load–deformation characteristics and fatigue life. Their findings showed that the simulated and experimental vertical dynamic stiffness results were consistent with theoretical predictions. Marini, et al. [8] studied an air spring system consisting of a primary pneumatic chamber and multiple auxiliary air storage tanks, where airflow between the chambers was controlled by an adjustable valve. This configuration allowed for regulation of the equivalent spring stiffness by altering the airflow distribution.
The studies conducted by these researchers can generally be divided into two categories of air spring types: bladder air springs and membrane air springs. Between these, membrane air springs exhibit smaller variations in vertical stiffness and smoother elastic characteristic curves, which make them more suitable for applications requiring stable stiffness performance.
To further analyze the influence of rubber airbag cord parameters on the vertical stiffness of membrane air springs within restricted installation spaces, parameters such as cord spacing, cord angle, cord cross-sectional area, and the number of cord layers were selected for investigation. The orthogonal experimental method was adopted to analyze the variation patterns of vertical stiffness under two different compression displacements, thereby revealing the influence laws of these four cord parameters on the vertical stiffness behavior of membrane air springs.
2. Membrane air spring structure and vertical stiffness
A specific type of membrane air spring was selected as the research object. The outer contour height of the membrane air spring is 347 mm, the radius around the rotation axis is 144 mm, and its mass is 13.214 kg. The distance between two adjacent installation holes is 158.8 mm, the maximum working pressure is 5.0 bar, and the stroke is 431.0 mm.
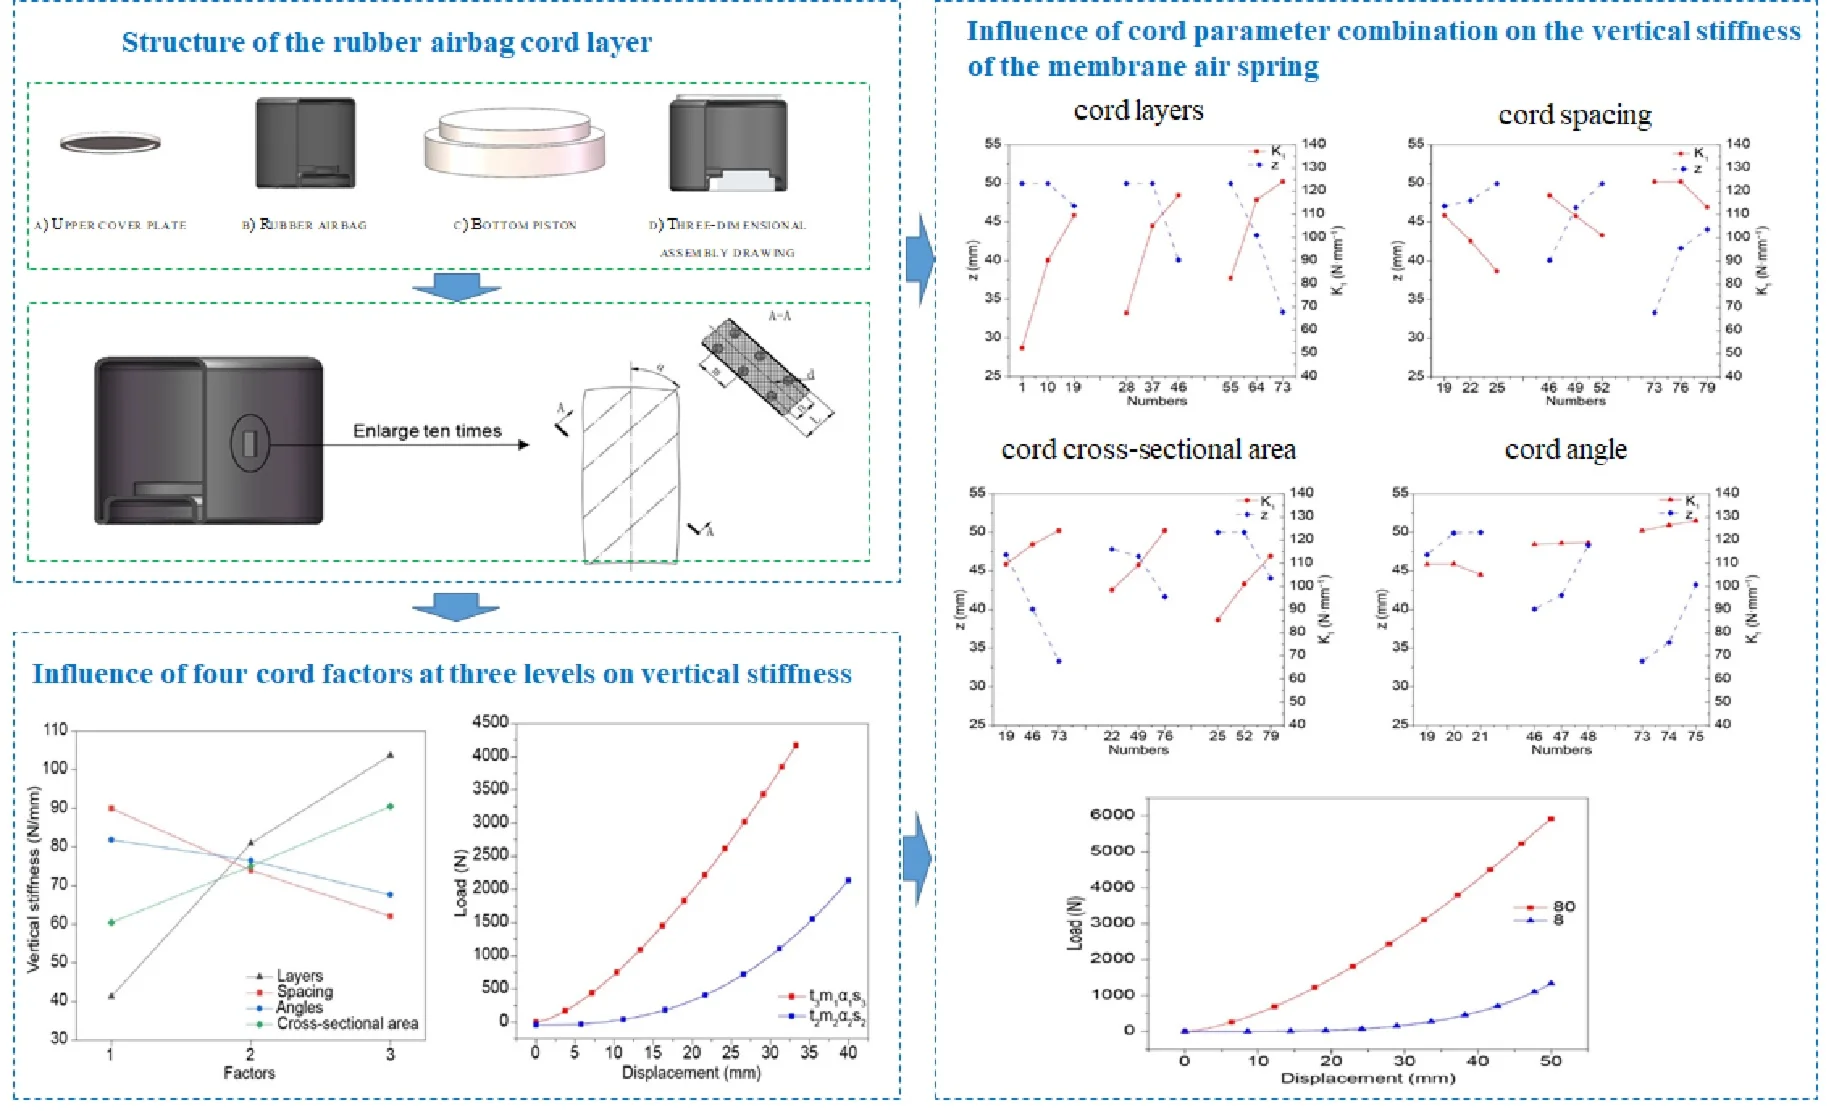
The membrane air spring was modeled using SolidWorks software. The upper cover plate, rubber airbag, and bottom piston were respectively modeled as shown in Figs. 1(a), (b), and (c). Fig. 1(d) presents the three-dimensional assembly drawing.
Fig. 1Composition and overall structure of the membrane air spring
a) Upper cover plate

b) Rubber airbag
c) Bottom piston
d) Three-dimensional assembly drawing
The nonlinearity of the vertical stiffness of the membrane air spring mainly arises from the deformation stiffness of the rubber airbag, as shown in Fig. 1(b) [9]. During compression, the stiffness is influenced by changes in the effective area of the compressed air column and the deformation characteristics of the rubber airbag itself. The total stiffness can be expressed by Eq. (1):
where Eq. (1), represents the total vertical stiffness of the membrane air spring, denotes the vertical stiffness of the compressed air, and is the deformation stiffness of the rubber airbag.
The variation of , representing the vertical stiffness of the compressed air, can be divided into two stages: a linear stage and a nonlinear stage. In the linear stage, assumes that the gas inside the rubber airbag behaves as an ideal gas. When the compression displacement of the membrane air spring is small, the change in gas state within the rubber airbag is linear and can be regarded as an isothermal process. Therefore, the pressure () and volume () of the gas satisfy Boyle’s Law [10]:
where Eq. (2), is the load-bearing capacity of the membrane air spring, is the internal pressure of the rubber airbag under compression, and is the effective internal area of the rubber airbag. In Eq. (3), denotes the gas pressure of the rubber airbag in its initial state, is the initial volume of the rubber airbag, represents the compressed volume of the rubber airbag, and is a constant. In Eq. (4), is the vertical displacement of the membrane air spring.
Based on Eqs. (2-4), the load-bearing capacity of the membrane air spring can be expressed as Eq. (5):
By differentiating with respect to according to Eq. (5), the vertical stiffness of the compressed air can be expressed as Eq. (6):
As the compression displacement increases further, the state of the gas within the rubber airbag gradually deviates from the linear relationship. During this nonlinear stage, the gas behavior follows a more general variable process equation [11], expressed as Eq. (7):
where Eq. (7), represents the gas process coefficient.
It follows from Eq. (7) that the vertical stiffness of the membrane air spring is related to the initial gas pressure of the rubber airbag, its initial volume , the effective area inside the airbag, and the vertical displacement of the membrane air spring.
The deformation stiffness of the rubber airbag is composed of the stiffness generated by the cord component and the stiffness generated by the pure rubber component, as expressed by Eq. (8). Due to the complexity of the structure and the absence of a unified theoretical expression, it is necessary to analyze four key cord parameters-number of cord layers (), cord spacing (), cord angle (), and cross-sectional area of the cord () – for the specific design:
Since the effect of the pure rubber material on is minimal and can be neglected, this study focuses on investigating the effects of the number of cord layers, cord spacing, cord angle, and cord cross-sectional area on .
3. Finite element simulation of membrane air spring
3.1. Rubber material model
The rubber airbag of the membrane air spring is primarily composed of rubber material. During operation, the rubber is subjected to varying internal pressures, resulting in large elastic deformations. Therefore, the Mooney-Rivlin model was selected to simulate the nonlinear elastic behavior of the rubber. The functional expression of the Mooney-Rivlin model is given in Eq. (10):
where, represents the strain potential energy of the rubber material; and are the first and second strain invariants, respectively; , , and are material constants characterizing the hyperelastic behavior of rubber. Their numerical values depend on the compound formulation, operating temperature, and volumetric strain state. In practice, these constants are typically identified through nonlinear regression of uniaxial, biaxial, or inflation test data.
3.2. Structure of the rubber airbag cord layer
The cord layer plays a decisive role in determining the vertical stiffness and durability of membrane air springs [12]. To accurately describe the structural configuration and parameters of the rubber airbag cord layer, the local capsule skin shown in Fig. 1(b) was sectioned, as illustrated in Fig. 2. The local capsule skin was magnified tenfold, and the cross-section A-A perpendicular to the cord direction was selected to construct the sectional view of the cut capsule skin. Fig. 2 presents the schematic cross-sectional view for a curtain layer comprising two layers.
Fig. 2Schematic diagram of the cord layer structure of the rubber airbag
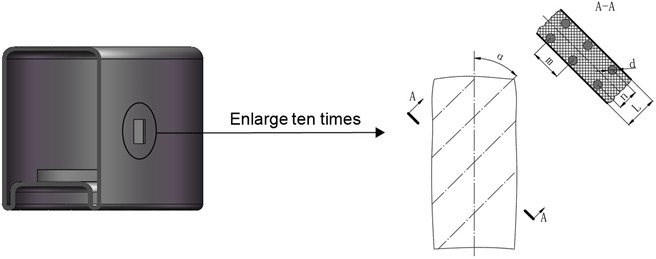
In Fig. 2, denotes the cord angle, which is the angle between the projection of a single cord’s direction and the rotation center axis. represents the diameter of a single cord’s cross-section, while is the cross-sectional area of the cord, defined as . denotes the cord spacing, referring to the distance between the central axes of two adjacent cords. represents the spacing between the axes of two adjacent cord layers, and indicates the thickness of the rubber airbag wall of the membrane air spring.
3.3. Definition of the fluid cavity
To simulate and analyze the gas flow behavior within the rubber airbag during operation, it was necessary to define the reference point coordinates of the fluid elements and the fluid cavity. The membrane air spring model created in SolidWorks was imported into ABAQUS software, where the F3D4 fluid element was selected for the internal air cavity. The F3D4 element is a five-node pyramid element, with its apex node serving as the reference point of the fluid cavity and the four base nodes corresponding to nodes on the inner surface of the cavity. A Cartesian coordinate system was established, with the origin O (0, 0, 0) positioned at the top of the central axis of the upper cover plate. The reference point O′ of the rubber airbag’s fluid cavity was defined at (, , ) = (0, −10, 0), as shown in Fig. 3.
Fig. 3Reference point of the fluid cavity
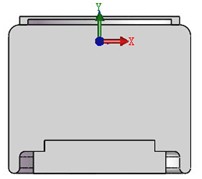
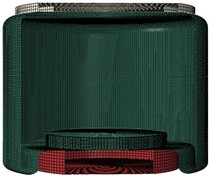
Fig. 4Mesh model of the membrane air spring
3.4. Finite element model of the membrane air spring
In ABAQUS, the rubber airbag was meshed using tetrahedral four-node shell element S4R, while the upper cover plate and bottom piston were meshed using hexahedral eight-node R3D3 and R3D4, respectively. The average side length of the mesh elements was 3.35 mm, resulting in a total of 77,818 elements and 77,238 nodes. The generated mesh model is illustrated in Fig. 4.
Boundary conditions were then applied. Since the rubber airbag is composed mainly of rubber material, contact interactions were defined in the Interaction Module using the Constraint Manager Toolbox. Contact between the rubber airbag and the upper cover plate, as well as between the rubber airbag and the bottom piston, was set as a TIE constraint [13]. Two simulation steps were defined: inflation and loading. When the membrane air spring was at its initial height, the Predefined Field Manager Toolbox in the Load Module was used to define the internal fluid cavity pressure as 0.3 MPa. The compression direction of the base was set as the positive direction of the -axis in the Boundary Condition Manager Toolbox, with a specified compression displacement of 40 mm.
4. Analysis of the influence of cord layer parameters on the vertical stiffness of membrane air spring
4.1. Determination of cord layer parameters
The Section Manager Toolbox in the Property Module was used to select the cross-section of the rubber airbag. The Rebar Layers were defined according to the required cord layer parameters, and values for cord spacing (), cord angle (), cord cross-sectional area (), and number of cord layers () were entered. Thus, the rubber airbag cord layer model was constructed. The selected cord parameter values are listed in Table 1.
Based on the cord parameters in Table 1, various combinations were established. The load and compression displacements were computed using the direct method and the Newton-Raphson method, respectively, to obtain the corresponding vertical stiffness values. The influence of each parameter combination on vertical stiffness was subsequently analyzed.
Table 1Geometric parameter values of cord
Geometric characteristics | Simulation parameters |
(mm) | 3, 5, 7 |
(°) | 5, 10, 15 |
(mm2) | 0.100, 0.166, 0.283 |
(layers) | 2, 4, 6 |
4.2. Influence of cord layer parameters on the vertical stiffness of the membrane air spring
First, the variations in the vertical stiffness of the air spring are analyzed with respect to changes in each of the four cord parameters. Subsequently, the cord layer spacing, cord angles, and cord cross-sectional area are individually varied according to the values specified in Table 1, while all of the other parameters are held constant. The corresponding calculated results for vertical stiffness are presented in Table 2.
Table 2Calculated results for vertical stiffness
--- | (N∙mm−1) | |
Cord layer spacing | 2-3-15-0.283 | 51.413 |
2-5-15-0.283 | 42.235 | |
2-7-15-0.283 | 35.525 | |
4-3-15-0.283 | 103.748 | |
4-5-15-0.283 | 88.791 | |
4-7-15-0.283 | 78.652 | |
6-3-15-0.283 | 124.443 | |
6-5-15-0.283 | 110.875 | |
6-7-15-0.283 | 101.487 | |
Cord angles | 2-3-5-0.100 | 47.575 |
2-3-10-0.100 | 40.875 | |
2-3-15-0.100 | 31.532 | |
4-3-5-0.100 | 84.811 | |
4-3-10-0.100 | 80.625 | |
4-3-15-0.100 | 72.775 | |
6-3-5-0.100 | 105.375 | |
6-3-10-0.100 | 102.915 | |
6-3-15-0.100 | 95.975 | |
Cord cross-sectional area | 2-3-15-0.100 | 31.476 |
2-3-15-0.166 | 41.775 | |
2-3-15-0.283 | 51.393 | |
4-3-15-0.100 | 72.775 | |
4-3-15-0.166 | 88.148 | |
4-3-15-0.283 | 103.751 | |
6-3-15-0.100 | 95.975 | |
6-3-15-0.166 | 110.275 | |
6-3-15-0.283 | 124.443 |
Thereafter, using the aforementioned three cord parameters as horizontal axes and vertical stiffness as the vertical axis, graphical representations were generated for air springs with 2, 4, and 6 cord layers, as illustrated in Fig. 5.
According to Table 2 and Fig. 5(a), when the number of cord layers remained constant, the vertical stiffness of the membrane air spring decreased with increasing cord spacing, indicating a negative correlation. For cord layers of 2, 4, and 6, the vertical stiffness decreased by 15.888 N/mm, 25.096 N/mm, and 22.956 N/mm, respectively, as the cord spacing increased from 3 to 7 mm. The corresponding reduction ratios were 30.9 %, 24.2 %, and 18.4 %, respectively. These results indicate that as the number of cord layers increased, the effect of larger cord spacing on reducing vertical stiffness became progressively weaker.
Fig. 5Vertical stiffness characteristics of membrane air springs with different cord layer parameters
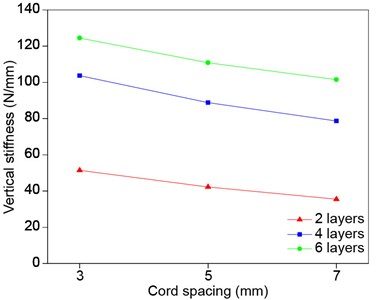
a) 3 Cord spacings
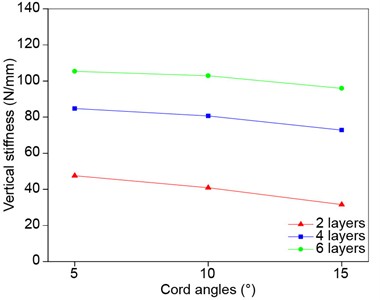
b) 3 Cord angles
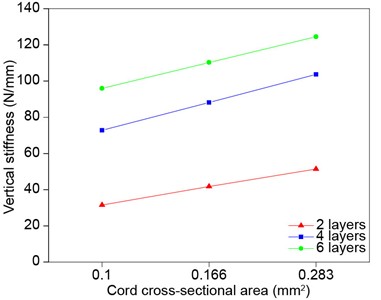
c) 3 Cord cross-sectional areas
When the cord spacing remained constant, vertical stiffness increased with the number of cord layers. For cord spacings of 3, 5, and 7 mm, the increase in vertical stiffness as the number of cord layers rose from 2 to 6 was 73.030 N/mm, 68.640 N/mm, and 65.962 N/mm, respectively. The corresponding increase ratios were 142.0 %, 162.5 %, and 185.7 %, respectively. When the cord spacing was small, the number of cord layers exerted a pronounced effect on the value of vertical stiffness, but a comparatively weaker effect on its rate of change. Conversely, as cord spacing increased, the number of cord layers had a smaller effect on the stiffness value but a greater influence on its rate of change. The minimum vertical stiffness of 35.525 N/mm occurred with 2 cord layers and a spacing of 7 mm, while the maximum vertical stiffness of 124.443 N/mm was obtained with 6 cord layers and a spacing of 3 mm.
According to Table 2 and Fig. 5(b), when the number of cord layers was constant, the vertical stiffness of the membrane air spring decreased with increasing cord angle, demonstrating a negative correlation. For 2, 4, and 6 cord layers, the reductions in vertical stiffness as the cord angle increased from 5° to 15° were 16.043 N/mm, 12.036 N/mm, and 9.400 N/mm, respectively, corresponding to decrease ratios of 33.7 %, 14.2 %, and 8.9 %. These results indicate that as the number of cord layers increases, the influence of a larger cord angle on reducing vertical stiffness weakens progressively.
When the cord angle remained constant, the vertical stiffness increased with the number of cord layers. For cord angles of 5°, 10°, and 15°, as the number of cord layers increased from 2 to 6, the vertical stiffness increased by 57.800 N/mm, 62.040 N/mm, and 64.443 N/mm, respectively, corresponding to increase ratios of 121.5 %, 151.8 %, and 204.4 %. This indicates that as the number of cord layers increased, the impact of the cord angle on the enhancement of vertical stiffness became more pronounced. The minimum vertical stiffness of 31.532 N/mm occurred when the number of cord layers was 2 and the cord angle was 15°, while the maximum vertical stiffness of 105.375 N/mm occurred when the number of cord layers was 6 and the cord angle was 5°.
According to Table 2 and Fig. 5(c), when the number of cord layers was constant, the vertical stiffness of the membrane air spring increased with the enlargement of the cord cross-sectional area, exhibiting a positive correlation. When the number of cord layers was 2, 4, and 6, the increases in vertical stiffness as the cord cross-sectional area rose from 0.100 to 0.283 mm2 were 19.917 N/mm, 30.976 N/mm, and 28.468 N/mm, corresponding to growth ratios of 63.3 %, 42.6 %, and 29.7 %, respectively. These results indicate that as the number of cord layers increased, the influence of enlarging the cord cross-sectional area on the growth ratio of vertical stiffness weakened gradually.
When the cord cross-sectional area was constant, vertical stiffness increased with the number of cord layers. For cross-sectional areas of 0.100, 0.166, and 0.283 mm2, as the number of cord layers increased from 2 to 6, the vertical stiffness increased by 64.499 N/mm, 68.500 N/mm, and 73.050 N/mm, corresponding to increase ratios of 204.9 %, 164.0 %, and 142.1 %, respectively. This indicates that, as the number of cord layers increased from 2 to 6, a larger cord cross-sectional area enhanced the overall vertical stiffness but gradually reduced its effect on the growth rate of stiffness. The minimum vertical stiffness of 31.476 N/mm occurred when the number of cord layers was 2 and the cord cross-sectional area was 0.100 mm2, while the maximum vertical stiffness of 124.443 N/mm occurred when the number of cord layers was 6 and the cross-sectional area was 0.283 mm2.
5. Influence of cord parameter combination on the vertical stiffness of the membrane air spring
5.1. Determination of the orthogonal experimental table
To investigate the combined effects of four factors – cord spacing, cord angle, cord cross-sectional area, and the number of cord layers – on the vertical stiffness of membrane air springs, the orthogonal experimental method was adopted [14]. The four influencing factors were the number of cord layers (), the cord spacing (), the cord angle (), and the cord cross-sectional area (). Each factor was assigned at three different levels, and the specific factors and levels are shown in Table 3.
Table 34 factor 3 level numerical table
Factor level | (layer) | (mm) | (°) | (mm2) |
1 | 2 | 3 | 5 | 0.100 |
2 | 4 | 5 | 10 | 0.166 |
3 | 6 | 7 | 15 | 0.283 |
Based on Table 3, an orthogonal table L9 (34) was established and nine experiments were combined. The vertical stiffness of each configuration was calculated using the same method described in Section 4. The orthogonal experimental results are summarized in Table 4.
5.2. Orthogonal experimental range analysis
Range analysis, commonly represented by , is a statistical method used to evaluate the relative influence of different factors. A larger value indicates a greater impact of the factor on the output variable. The average values of the nine experimental groups for each factor and level are denoted as , where represents the level ( 1, 2, 3) and represents the factor (, , , ). The range is calculated as the difference between the maximum and minimum values of for each factor, as shown in Eq. (11):
Using the vertical stiffness values from Table 4 and Eq. (11), the range analysis results were obtained and are presented in Table 5. Based on the calculated values, the influence trends of the four cord parameters at three levels were plotted, as shown in Fig. 6.
Table 4Calculation results of 4 factors 3 levels orthogonal experiments
Group number | (layer) | (mm) | (°) | (mm2) | (N∙mm−1) |
1 | 1 | 1 | 1 | 1 | 47.575 |
2 | 1 | 2 | 2 | 2 | 40.751 |
3 | 1 | 3 | 3 | 3 | 35.525 |
4 | 2 | 1 | 2 | 3 | 111.925 |
5 | 2 | 2 | 3 | 1 | 56.953 |
6 | 2 | 3 | 1 | 2 | 73.925 |
7 | 3 | 1 | 3 | 2 | 110.275 |
8 | 3 | 2 | 1 | 3 | 124.072 |
9 | 3 | 3 | 2 | 1 | 76.725 |
Table 5Range analysis table
Index | (layer) | (mm) | (°) | (mm2) |
41.283 | 89.925 | 81.857 | 60.418 | |
80.934 | 73.925 | 76.467 | 74.983 | |
103.691 | 62.058 | 67.584 | 90.507 | |
R | 62.408 | 27.867 | 14.273 | 30.089 |
Fig. 6Influence of four cord factors at three levels on vertical stiffness
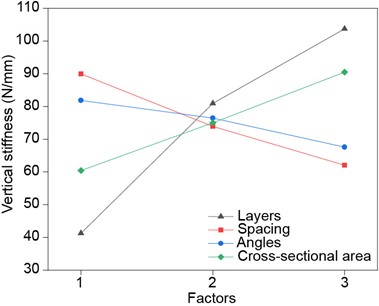
As illustrated in Fig. 6, vertical stiffness increased significantly with the number of cord layers, indicating a strong positive correlation. As the cord cross-sectional area increased, vertical stiffness also increased, showing a relatively strong influence. Conversely, as cord spacing increased, vertical stiffness decreased, demonstrating a moderate negative effect. The influence of cord angle on vertical stiffness was the weakest, with only a minor decreasing trend observed.
According to Table 5 and Fig. 6, the order of factor influence based on the range was: . Using maximum vertical stiffness as the evaluation criterion, the maximum value in each factor was selected to combine the optimal level group .
5.3. Comparative analysis of the optimal level combination
After reviewing relevant literature, the intermediate level combination was selected as a reference for comparison with the optimal level combination , as shown in Table 3. The load-displacement curves of both configurations were obtained, as illustrated in Fig. 7.
Fig. 7Load-displacement curves of t3m1α1s3 and t2m2α2s2
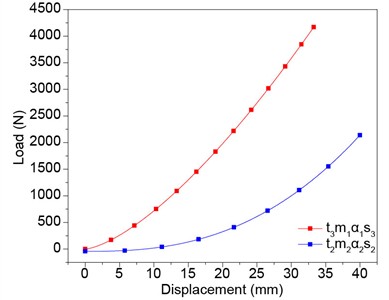
As shown in Fig. 7, the overall load of both and combinations increased nonlinearly with displacement and the growth rate became progressively larger. At the same displacement, the load corresponding to was consistently higher than that of . Furthermore, the difference in load between the two groups widened as the displacement increased. The maximum compression displacement for was 33.275 mm, with a corresponding load of 4169.438 N. A quartic polynomial fitting was applied to the optimal level group to obtain the functional relationship describing the variation law of vertical stiffness, as expressed in Eq. (12):
6. Influence of membrane air spring cord parameters on 50 mm compression displacement
To further examine the variation characteristics of vertical stiffness under a finite and larger compression displacement, the compression displacement was increased to 50 mm. Based on the four cord parameters in Table 1 – namely, the number of cord layers, cord spacing, cord angle, and cord cross-sectional area – each parameter was divided into three groups, resulting in 81 experimental combinations. The corresponding vertical stiffness values were calculated for all groups, and the results are summarized in Table 6.
In Table 6, among the groups numbered 5, 6, and 9, the results of the four parameter combinations failed to converge. In these cases, the compression displacement z and the vertical stiffness are represented by . There were 18 groups (numbers 19, 20, 22, 46, 47, 48, 49, 50, 64, 65, 66, 73, 74, 75, 76, 77, 78, and 79) that did not reach the full compression displacement of 50 mm.
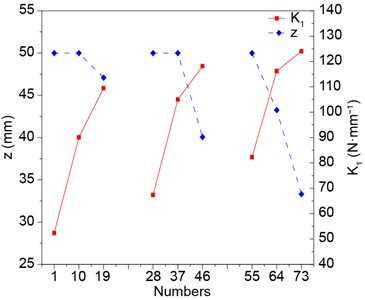
From Table 6, when the number of cord layers was 2, 4, and 6, and the cord spacing and angle were 3 mm and 5°, respectively, with a cord cross-sectional area s of 0.100 mm2, the corresponding test groups were 1, 10, and 19. When s was 0.166 mm2, groups 28, 37, and 46 were selected. When was 0.283 mm2, groups 55, 64, and 73 were selected. The compression displacement and vertical stiffness for these nine groups were compared, as illustrated in Fig. 8.
As shown in Fig. 8, the horizontal axis represents the experimental group numbers, while the vertical axis corresponds to compression displacement and vertical stiffness . When the cord spacing and angle were constant and the cord cross-sectional area values were 0.100, 0.166, and 0.283 mm2, an increase in the number of cord layers led to a rise in vertical stiffness , reaching its maximum at six layers. However, as the number of cord layers increased, the allowable compression displacement of the membrane air spring gradually decreased, indicating a trade-off between stiffness and deformability.
Table 6The vertical stiffness values of 81 experimental groups
Sequence number | --- | (mm) | (N·mm−1) |
1 | 2-3-5-0.100 | 50.000 | 52.339 |
2 | 2-3-10-0.100 | 50.000 | 45.186 |
3 | 2-3-15-0.100 | 50.000 | 36.072 |
4 | 2-5-5-0.100 | 50.000 | 36.386 |
5 | 2-5-10-0.100 | X | X |
6 | 2-5-15-0.100 | X | X |
7 | 2-7-5-0.100 | 50.000 | 25.738 |
8 | 2-7-10-0.100 | 50.000 | 22.299 |
9 | 2-7-15-0.100 | X | X |
10 | 4-3-5-0.100 | 50.000 | 90.112 |
11 | 4-3-10-0.100 | 50.000 | 86.929 |
12 | 4-3-15-0.100 | 50.000 | 80.858 |
13 | 4-5-5-0.100 | 50.000 | 74.186 |
14 | 4-5-10-0.100 | 50.000 | 70.788 |
15 | 4-5-15-0.100 | 50.000 | 65.000 |
16 | 4-7-5-0.100 | 50.000 | 63.344 |
17 | 4-7-10-0.100 | 50.000 | 60.053 |
18 | 4-7-15-0.100 | 50.000 | 54.643 |
19 | 6-3-5-0.100 | 47.095 | 109.490 |
20 | 6-3-10-0.100 | 49.887 | 109.593 |
21 | 6-3-15-0.100 | 50.000 | 105.053 |
22 | 6-5-5-0.100 | 47.823 | 98.482 |
23 | 6-5-10-0.100 | 50.000 | 93.913 |
24 | 6-5-15-0.100 | 50.000 | 89.055 |
25 | 6-7-5-0.100 | 50.000 | 85.567 |
26 | 6-7-10-0.100 | 50.000 | 83.176 |
27 | 6-7-15-0.100 | 50.000 | 78.304 |
28 | 2-3-5-0.166 | 50.000 | 67.310 |
29 | 2-3-10-0.166 | 50.000 | 57.758 |
30 | 2-3-15-0.166 | 50.000 | 45.719 |
31 | 2-5-5-0.166 | 50.000 | 52.198 |
32 | 2-5-10-0.166 | 50.000 | 45.067 |
33 | 2-5-15-0.166 | 50.000 | 35.979 |
34 | 2-7-5-0.166 | 50.000 | 41.761 |
35 | 2-7-10-0.166 | 50.000 | 36.159 |
36 | 2-7-15-0.166 | 50.000 | 28.960 |
37 | 4-3-5-0.166 | 50.000 | 105.015 |
38 | 4-3-10-0.166 | 50.000 | 101.738 |
39 | 4-3-15-0.166 | 50.000 | 96.672 |
40 | 4-5-5-0.166 | 50.000 | 89.972 |
41 | 4-5-10-0.166 | 50.000 | 86.784 |
42 | 4-5-15-0.166 | 50.000 | 80.714 |
43 | 4-7-5-0.166 | 50.000 | 79.553 |
44 | 4-7-10-0.166 | 50.000 | 76.169 |
45 | 4-7-15-0.166 | 50.000 | 70.248 |
46 | 6-3-5-0.166 | 40.058 | 118.181 |
47 | 6-3-10-0.166 | 41.846 | 118.659 |
48 | 6-3-15-0.166 | 48.329 | 118.834 |
49 | 6-5-5-0.166 | 46.877 | 109.268 |
50 | 6-5-10-0.166 | 47.469 | 108.169 |
51 | 6-5-15-0.166 | 50.000 | 104.913 |
52 | 6-7-5-0.166 | 50.000 | 100.935 |
53 | 6-7-10-0.166 | 50.000 | 99.231 |
54 | 6-7-15-0.166 | 50.000 | 94.428 |
55 | 2-3-5-0.283 | 50.000 | 82.250 |
56 | 2-3-10-0.283 | 50.000 | 69.867 |
57 | 2-3-15-0.283 | 50.000 | 54.682 |
58 | 2-5-5-0.283 | 50.000 | 67.947 |
59 | 2-5-10-0.283 | 50.000 | 58.285 |
60 | 2-5-15-0.283 | 50.000 | 46.116 |
61 | 2-7-5-0.283 | 50.000 | 58.116 |
62 | 2-7-10-0.283 | 50.000 | 50.077 |
63 | 2-7-15-0.283 | 50.000 | 39.861 |
64 | 4-3-5-0.283 | 43.248 | 116.212 |
65 | 4-3-10-0.283 | 43.417 | 114.649 |
66 | 4-3-15-0.283 | 49.258 | 107.954 |
67 | 4-5-5-0.283 | 50.000 | 105.570 |
68 | 4-5-10-0.283 | 50.000 | 103.314 |
69 | 4-5-15-0.283 | 50.000 | 97.362 |
70 | 4-7-5-0.283 | 50.000 | 95.886 |
71 | 4-7-10-0.283 | 50.000 | 92.942 |
72 | 4-7-15-0.283 | 50.000 | 86.858 |
73 | 6-3-5-0.283 | 33.300 | 124.062 |
74 | 6-3-10-0.283 | 35.692 | 126.471 |
75 | 6-3-15-0.283 | 43.183 | 128.421 |
76 | 6-5-5-0.283 | 41.634 | 124.072 |
77 | 6-5-10-0.283 | 43.183 | 120.357 |
78 | 6-5-15-0.283 | 46.972 | 118.314 |
79 | 6-7-5-0.283 | 44.068 | 113.057 |
80 | 6-7-10-0.283 | 50.000 | 115.241 |
81 | 6-7-15-0.283 | 50.000 | 110.893 |
Fig. 8Influence of the number of cord layers on compression displacement z and vertical stiffness K1 of the membrane air spring
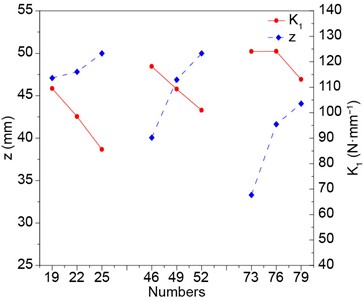
According to Table 6, when the cord spacing () was 3, 5, and 7 mm, and the number of cord layers and angle were fixed at six layers and 5°, respectively, while the cord cross-sectional area was 0.100 mm2, the selected groups were 19, 22, and 25. When was 0.166 mm2, groups 46, 49, and 52 were selected, and when was 0.283 mm2, groups 73, 76, and 79 were selected. The compression displacement and vertical stiffness for these nine groups were compared, as shown in Fig. 9.
As is illustrated in Fig. 9, the horizontal axis represents the group numbers, and the vertical axis indicates the compression displacement and vertical stiffness , respectively. When the number of cord layers and the cord angle were constant, and the cord cross-sectional areas were 0.100, 0.166, and 0.283 mm2, and the compression displacement that the membrane air spring could withstand decreased progressively with increasing cord spacing. Meanwhile, vertical stiffness also decreased as cord spacing increased, exhibiting a clear negative correlation between cord spacing and vertical stiffness.
Fig. 9Influence of cord spacing on compression displacement z and vertical stiffness K1 of the membrane air spring
According to Table 6, when the cord cross-sectional areas () were 0.100, 0.166, and 0.283 mm2, and the number of cord layers () and the cord angle () were fixed at six layers and 5°, respectively, with cord spacing () set to 3 mm, groups 19, 46, and 73 were selected. When was 5 mm, groups 22, 49, and 76 were used; when was 7 mm, groups 25, 52, and 79 were selected. The compression displacement and vertical stiffness for these nine groups were compared, as illustrated in Fig. 10.
Fig. 10Influence of the cord cross-sectional area on compression displacement and vertical stiffness of the membrane air spring
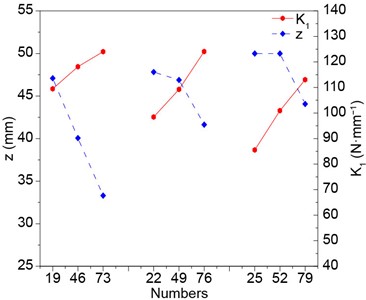
As shown in Fig. 10, the horizontal axis represents the experimental group number, while the vertical axis denotes the compression displacement and vertical stiffness . When the number of cord layers and cord angle were constant, and the cord spacing values were 3, 5, and 7 mm, the compression displacement that the membrane air spring could withstand gradually decreased with an increase in the cord cross-sectional area. Meanwhile, vertical stiffness increased progressively with increasing cross-sectional area, demonstrating a positive correlation between the two.
According to Table 6, when the cord angle () was 5°, 10°, and 15°, and the number of cord layers () and cord spacing () were fixed at six layers and 3 mm, respectively, with the cord cross-sectional area () set to 0.100 mm2, groups 19, 20, and 21 were selected. When was 0.166 mm2, groups 46, 47, and 48 were used, and when s was 0.283 mm2, groups 73, 74, and 75 were taken. The compression displacement and vertical stiffness of these nine groups were compared, as shown in Fig. 11.
Fig. 11Influence of cord angle on compression displacement and vertical stiffness of the membrane air spring
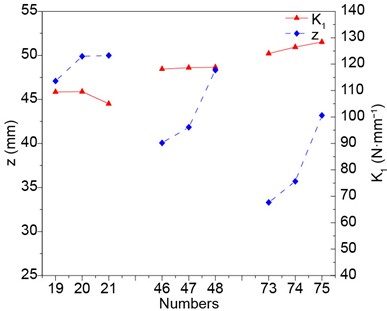
As illustrated in Fig. 11, the horizontal axis represents the experimental group numbers, and the vertical axis represents compression displacement and vertical stiffness . When the number of cord layers and cord spacing remained unchanged, and the cord cross-sectional areas were 0.100, 0.166, and 0.283 mm2, the compression displacement that the membrane air spring could withstand increased gradually with the increase in cord angle. For groups 19, 20, and 21, vertical stiffness showed a decreasing trend with increasing cord angle, while for groups 46, 47, 48 and groups 73, 74, 75, vertical stiffness exhibited an increasing trend. These results indicate that the effect of cord angle on vertical stiffness is non-monotonic and may depend on the combination of other cord parameters.
Fig. 12Load-displacement curves of Group 8 and Group 80
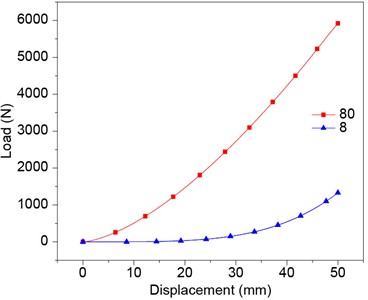
Based on the data in Table 6, among all experimental groups that achieved a compression displacement of 50 mm, the combination of four cord parameters resulting in the smallest vertical stiffness corresponded to group 8, while the combination producing the largest vertical stiffness corresponded to group 80. The load-displacement curves for groups 8 and 80 were plotted and are presented in Fig. 12.
As shown in Fig. 12, the loads sustained by both groups increased with increasing displacement. Under the same compression displacement, the six-layer cord configuration withstood a higher load than the two-layer cord configuration. Furthermore, at each displacement level, the load value of group 80 was greater than that of group 8, and the difference in load between the two groups widened progressively as displacement increased.
7. Conclusions
To investigate the vertical stiffness characteristics of membrane air springs within a confined installation space, the influence of rubber airbag cord parameters on vertical stiffness was analyzed. A three-dimensional model of the membrane air spring was developed using SolidWorks, and its vertical stiffness behavior was simulated through ABAQUS. The effects of four key cord parameters – number of cord layers, cord spacing, cord angle, and cord cross-sectional area – on the vertical stiffness were systematically examined. The main conclusions are summarized as follows:
1) The influence characteristics of the four cord parameters on the vertical stiffness of membrane air springs were analyzed individually. When three parameters remained constant and only one was varied, the vertical stiffness of the membrane air spring decreased with increasing cord spacing and cord angle, while it increased with larger cord cross-sectional area and greater number of cord layers.
2) Based on the orthogonal experimental design method, the relative importance of the four cord parameters influencing vertical stiffness was determined. The number of cord layers exhibited the most significant effect on vertical stiffness, with an increase in layer count producing a pronounced enhancement in stiffness. The effects of cord spacing and cord cross-sectional area were moderate in comparison, while the cord angle had the least influence.
3) When the compression displacement was set to 50 mm, the combined influence of the four cord parameters on vertical stiffness was analyzed, and the parameter combinations yielding the minimum and maximum stiffness values were identified. The minimum vertical stiffness occurred when the number of cord layers was 2, the cord spacing was 7 mm, the cord angle was 10°, and the cord cross-sectional area was 0.100 mm2. The maximum vertical stiffness was obtained when the number of cord layers was 6, the cord spacing was 3 mm, the cord angle was 15°, and the cord cross-sectional area was 0.283 mm2.
The above research findings offer theoretical support for subsequent bench testing. Moving forward, bench tests targeting the membrane air spring will be carried out systematically. Drawing on the ensuing test data and analytical, it will provide references for the structural optimization and performance enhancement of membrane air spring.
References
-
C. Yuan, K. Zhou, G. Wang, D. An, and L. Wu, “Simulation and experimental investigation of mechanical property of air spring for vehicles,” (in Chinese), Transactions of the Chinese Society of Agricultural Engineering, Vol. 24, No. 3, pp. 38–42, Jan. 2008, https://doi.org/10.3321/j.issn:1002-6819.2008.03.008
-
W. Zhou, C. Zhang, Y. Zhang, and Q. Li, “Simulation analysis on vertical stiffness characteristics of air spring for a tractor,” (in Chinese), Machinery Design and Manufacture, No. 8, pp. 170–173, Jan. 2018, https://doi.org/10.3969/j.issn.1001-3997.2018.08.049
-
H. Lee and C.-S. Kim, “Prediction of ply angles of air springs according to airbag positions and their effects on lateral and torsional stiffness,” Applied Sciences, Vol. 12, No. 22, p. 11815, Nov. 2022, https://doi.org/10.3390/app122211815
-
D. Zhang, Q. Liu, J. Xie, H. Zuo, and Q. Wang, “Effect of cord parameters on vertical stiffness of rubber air spring,” (in Chinese), Journal of Machine Design, Vol. 40, No. 11, pp. 62–68, Nov. 2023.
-
Z. Lu, P. Si, H. Xiao, and J. Liu, “Influence of aging time on vertical static stiffness of air spring,” Applied Sciences, Vol. 12, No. 9, p. 4219, Apr. 2022, https://doi.org/10.3390/app12094219
-
L. Yin, W. Xu, Z. Hu, M. He, and C. Li, “Research on damping and vibration absorption performance of air spring dynamic vibration absorber,” Journal of Vibration Engineering and Technologies, Vol. 12, No. 3, pp. 3771–3782, Jul. 2023, https://doi.org/10.1007/s42417-023-01083-4
-
S. Oman and M. Nagode, “The influence of piston shape on air‐spring fatigue life,” Fatigue and Fracture of Engineering Materials and Structures, Vol. 41, No. 5, pp. 1019–1031, Nov. 2017, https://doi.org/10.1111/ffe.12748
-
G. Marini et al., “On optimal control of a multichamber air spring and experimental validation over speed bumps,” IFAC-PapersOnLine, Vol. 56, No. 2, pp. 1989–1994, Jan. 2023, https://doi.org/10.1016/j.ifacol.2023.10.1093
-
Y. Hu, J. Zhang, and J. Long, “Influence of rubber’s viscoelasticity and damping on vertical dynamic stiffness of air spring,” Scientific Reports, Vol. 13, No. 1, p. 9886, Jun. 2023, https://doi.org/10.1038/s41598-023-36904-9
-
K. Arai, H. Akimichi, and M. Hirata, “Precise measurements of the volume change in a bellows by Boyle’s law,” in SICE Annual Conference 2005, Okayama, Japan, pp. 119–122, 2005.
-
M. Zhu, Engineering thermodynamics. Beijing: Tsinghua University Press, 1995.
-
M. Wu et al., “A theoretical model of amplitude-dependent dynamical stiffness for cord-rubber air springs,” Proceedings of the Institution of Mechanical Engineers, Part L: Journal of Materials: Design and Applications, Vol. 237, No. 2, pp. 425–436, Aug. 2022, https://doi.org/10.1177/14644207221117270
-
K. Chunyan, X. Jie, Y. Mingkun, L. Yang, and L. Yi, “Analysis of static and dynamic characteristics of membrane air springs for small passenger cars,” Journal of the Brazilian Society of Mechanical Sciences and Engineering, Vol. 46, No. 12, p. 682, Nov. 2024, https://doi.org/10.1007/s40430-024-05244-8
-
J. Seberry, Orthogonal Designs: Hadamard Matrices, Quadratic Forms and Algebras. Cham, Switzerland: Springer, 2017.
About this article

This work was supported by Research Foundation of Shaanxi University of Technology under Grant SLGRCQD2321 and Shaanxi Province Key Research and Development Foundation under Grant 2025CY-JJQ-20.
The datasets generated during and/or analyzed during the current study are available from the corresponding author on reasonable request.
Xufei Wang: funding acquisition, methodology, review and editing, original draft preparation. Zhiqiang Xie: conceptualization, data curation, original draft preparation, visualization. Ningchao Zhang: software, data validation. Jinde Song: funding acquisition, resources.
The authors declare that they have no conflict of interest.
