Abstract
In this paper an issue of local damage detection in a rolling element bearing is discussed. The bearing operates in a hummer crusher, thus the vibration signal acquired on the housing contains a lot of impacts that originate in various sources. In the case of local damage detection it is crucial to find a set of cyclic impulses in the signal. These impulses are informative, in spite of impulses related to the crushing process, which are non-informative. In order to find the damage signature we provide feasibility study on a tool based on cyclostationary approach, namely cyclic spectral coherence. This comprehensive analysis includes study on four different signals from bearings in various condition and operating with or without load applied. This analysis is preceded by motivating preliminary analysis where we examine a few widely-used methods for local damage detection.
1. Introduction
In the literature related to machine diagnostics a problem of rolling element bearing diagnostics is widely investigated. Classical methods based on analysis of a vibration signal include time domain detectors (kurtosis, crest factor, peak-to-peak, RMS, non-Gaussianity detectors, etc. [1-6]) or envelope analysis (in both time and frequency domain [7, 8]). More advanced analysis are of the utmost importance when, for instance, the machine is complex [9], the damage is on early stage of development [10, 11], or there are other sources of the signal that contaminate the damage signature (including another damage) [12, 13]. In such cases one can benefit from signal decomposition (time-frequency analysis, e.g. spectrogram, Wigner-Ville, ARgram, etc. [14-17]), modeling (ARMA, TARMA, ARMAX, etc. [18-21]), filtering (including adaptive filters [1, 3, 22-24]) or other processing (e.g. EMD [25, 26]). In this paper we investigate the problem of local damage detection in rolling element bearings that operate in a hummer crusher. The most critical issue associated with this problem is presence of non-informative, impulsive noise in the vibration signal. The crusher is a machine operating in a mineral processing plant and it crumbles material into smaller pieces. When the load is applied, material stream is processed by the crusher and a lot of impacts not related to damage occur. Therefore, diagnosis of this machine is difficult due to additional, wideband source of vibrations. On the other hand, diagnosis of the machine in the idle mode might be not accurate due to the fact that resonance frequencies are not excited there. The problem of impulsive noise is relevant when industrial data is processed, e.g. in jet engines, gas compressors or in belt conveyor pulleys and other mining machines [6, 13, 27]. In the crusher, impacts occur very frequently and are randomly spaced in time. For specific granulation of material stream, temporary amplitude of the signal measured on the bearing housing might be even several times larger than usually. Thus, it is crucial to distinguish between informative (related to damage) and non-informative (related to crushing process) impulses. In this paper we comprehensively analyze benefits from cyclo-stationary approach. This approach seems to be very promising from theoretical point of view, because cyclic or non-cyclic occurrence certainly is a feature that distinguishes two kinds of impacts present in a vibration signal from the crusher [28]. A feasibility study on application of cyclic spectral coherence map is the key point of this paper. The analysis includes also preliminary investigation on application of time-domain indicators and time-invariant filtering.
The paper is organized as follows: Section 2 contains description of the experiment performed on a hummer crusher and a general information about this machine. Preliminary analysis of vibration signals from the crusher are presented in Section 3. Section 4 contains analysis using a cyclostationary tool, namely cyclic spectral coherence. The last section contains conclusion.
2. Description of the experiment
Vibration signals analyzed is this paper are acquired during an experiment on hummer crushers that operate in a mineral processing plant (Fig. 1). During the experiment 33 signals have been acquired. Duration of the signals varies from 50 to 190 s. Such long measurements are motivated by the fact that crushers operate under different load conditions, thus a long measurement might cover different load conditions, including idle state. Amplitudes of the vibration signals from different crushers are different. Probable reason of that is different lifetime and ordinary degradation processes (wear). It has been noticed that during single measurement, amplitude of vibration varies (with respect to load), thus, larger amplitudes might not indicate a damage. The crusher is a machine designed to crumble material into small pieces using hummers mounted on a shaft. As the hummers are in contact with the material stream, a lot of impulses occur. The impulses are transmitted through the shaft to the bearing and the accelerometer located on the bearing’s housing. Some impulses also appear when the material stream enters the crusher. Thus, the vibration signal acquired on the bearing housing is consisted not only of the signal related to rotation of the rolling element bearing (with shaft harmonics), but it contains also impulses related to the specific operation of the machine (crushing), and, possibly, impulses related to local damage. The latter impulses are cyclic, due to approximately constant rotational speed during the measurement.
Fig. 1A crusher – general view. Note bearings with yellow housing and location of the sensor (yellow rectangle with red dot in the center)
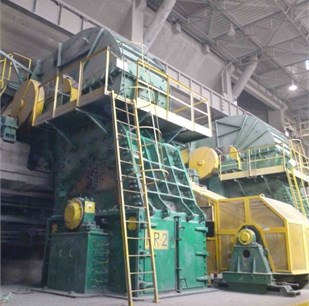
Vibration signals have been acquired in horizontal and vertical directions using Endevco accelerometers, shaft speed were measured using BruelKjaer Laser probe, a data acquisition system was established on NI DAQ card and Labview Signal Express. Sampling frequency of vibrations signals is 25 kHz. The analyzed vibration signals are 10 s parts of the whole measurements. Rotational speed during these parts of the signals might be assumed as approximately constant. Characteristic frequencies of the bearing are presented in Table 1. In the vibration signal one can see high-energy components from rotating shaft and from other sources (machines located nearby). Torque of the engine is being passed through belt transmission to the crusher. The considered bearings are 23264 SKF. Due to the analysis presented in Section 4 the inner race of one bearing reveals a local damage. As a reference, we also analyze signals from healthy machines and present results obtained for both healthy and damaged bearings.
Table 1Bearing frequencies: 23264 CCK/W33
No | Description | Value / unit |
1 | Rotational speed of the inner ring | 180 r/min |
2 | Rotational speed of the outer ring | 0 r/min |
3 | Rotational frequency of the inner ring | 3 Hz |
4 | Rotational frequency of the outer ring | 0 Hz |
5 | Rotational freq. of the rolling element and cage assembly | 1.3 Hz |
6 | Rotational freq. of a rolling element about its own axis | 10.6 Hz |
7 | Over-rolling frequency of one point on the inner ring | 30.7 Hz |
8 | Over-rolling frequency of one point on the outer ring | 23.3 Hz |
9 | Over-rolling frequency of one point on a rolling element | 21.1 Hz |
3. Motivation
Due to different load conditions, amplitudes of the vibration signal might vary in time. This phenomenon is presented in Fig. 2. Low amplitudes (here: lower than 0.5 m/s2) are related to operation under no load. Larger amplitudes (here: approx. 2 m/s2) are related to operation under load. For certain types of granulation the amplitudes might reach level over 5 m/s2 (Fig. 2(c)). When the crushing process is finished, the amplitudes suddenly drop (Fig. 2(a), 65 s).
Fig. 2Exemplary raw vibration signals acquired during operation of the crusher. Note time-varying amplitudes that depend on volume of load and granulation
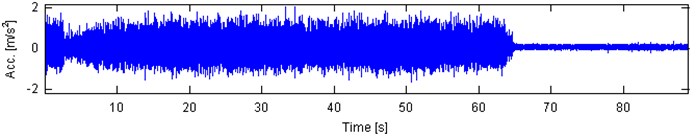
a)
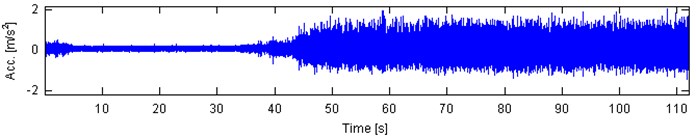
b)
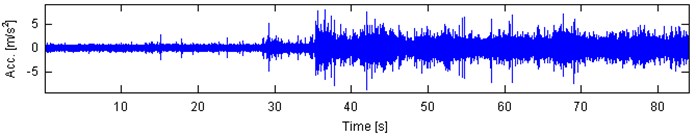
c)
Fig. 3 presents signals analyzed in the paper. They are 10 s parts of the whole measurements. Such length of the signal is sufficient for damage detection in a bearing with characteristic frequencies given in Table 1. In order to provide comprehensive analysis we investigate 4 signals: 2 from locally damaged bearing (idle and load condition – Fig. 3(a), (c)) and 2 from healthy bearings (idle and load – Fig. 3(b), (d)). As it was mentioned, amplitudes of signals from machines depend on their condition as well as load applied to the machine, thus, amplitudes of raw signals cannot be considered as a diagnostic symptom. One can see that both signals from machines that operate under load are spiky (kurtosis 5.6126 and 4.1875 for damaged and healthy bearing, respectively). Signals that have been acquired during idle state do not indicate presence of spikes (kurtosis 3.1602 and 3.0378 for damaged and healthy bearing, respectively). Signals presented in Fig. 3(a), (c) have been acquired during one long measurement, thus it can be noticed that amplitudes raise several times when load is applied.
Fig. 3Time series 10 s parts of vibration signals acquired during operation under load (a), b)) and under no load (c), d)). Panels a) and c) represents machine with locally damaged bearing. Panels b) and d) represent the healthy machine
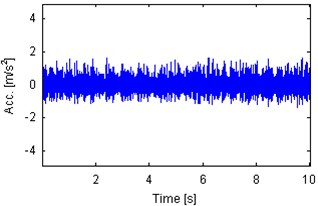
a) Kurtosis 5.6126
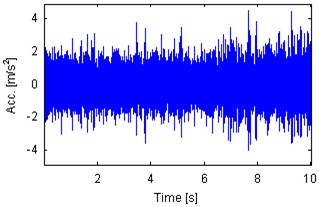
b) Kurtosis 4.1875
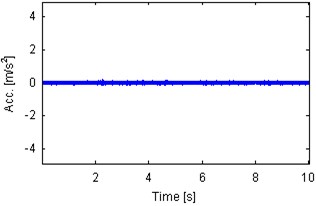
c) Kurtosis 3.1602
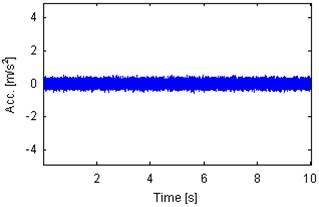
d) Kurtosis 3.0378
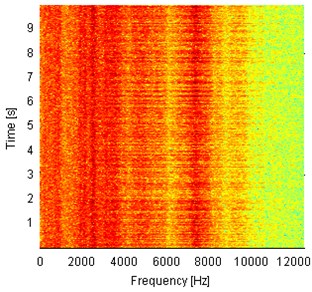
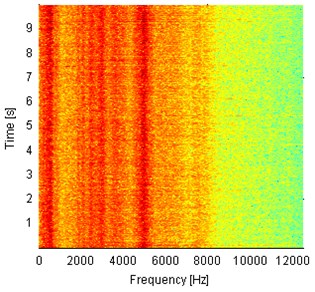
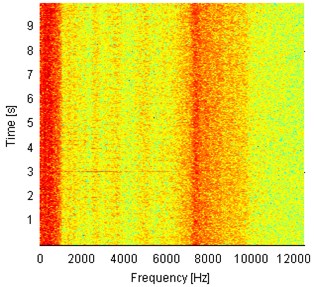
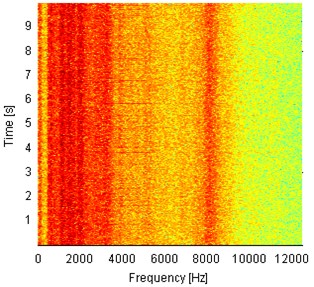
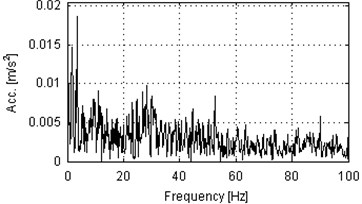
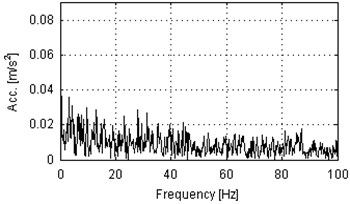
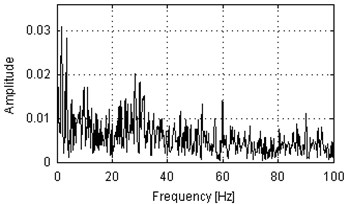
Spectrograms of the analyzed signals are presented in Fig. 4. One can notice different frequency content for every of four signals. The signal from the bearing with inner race damage operating under load (Fig. 4(a)) contains a lot of impulses that are indicated as wideband excitations of the frequency range. One can see also that the most of energy is contained in frequency band up to 10 kHz and the resonance frequency is slightly below 8 kHz. The signal from the same machine, but acquired under no load has different frequency content. Large energy is indicated only in the lowest frequency bands (up to 1 kHz) and close to 8 kHz. Spectrogram from the signal acquired on the machine in healthy condition and operating under load (Fig. 4(b)) contains wideband excitations, as in Fig. 4(a), but most of the energy is contained in the lowest frequency bins (below 1 kHz) and close to 5 kHz. Above 9 kHz the level of energy is very low. Fig. 4(d) presents time-frequency representation of the signal from a healthy machine that operates in the idle state. Highest amplitudes are observed up to 4 kHz and close to 8 kHz. In conclusion, analysis of time time-frequency domain signals provided above cannot be a base for damage detection. Larger amplitudes might be related to longer total operating time of machines and impulsiveness might be a result of specific way of operation of hummer crushers when the material stream is being processed. Thus, we check envelope spectra of the raw signals from Fig. 3 for presence of harmonics related to the local damage. The envelopes are obtained using the Hilbert transform and their spectra are depicted in Fig. 5. Set of harmonics related to the fault frequency of 30 Hz is not indicated in any of the envelope spectra. One 30 Hz harmonic is presented in Fig. 5(c) (damaged, idle state), but its amplitude is comparable to the level of noise. Thus, damage detection cannot be performed even upon envelope spectrum of the raw vibration signal.
Fig. 4Spectrograms of 10 s parts of vibration signals acquired during operation under load (a), b)) and under no load (c), d)). Panels a) and c) represent machine with locally damaged bearing. Panels b) and d) represent a healthy machine
a)
b)
c)
d)
Fig. 5Envelope spectra of 10 s parts of vibration signals acquired during operation under load (a), b)) and under no load (c), d)). Panels a) and c) represent machine with locally damaged bearing. Panels b) and d) represent a healthy machine
a)
b)
c)
d)
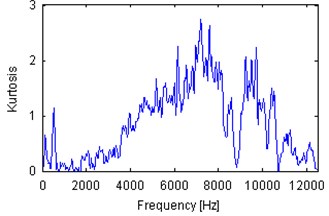
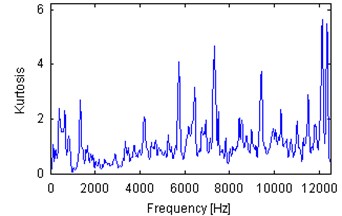
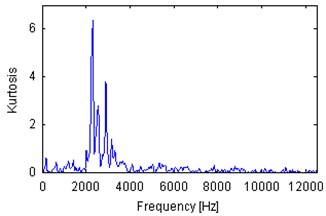
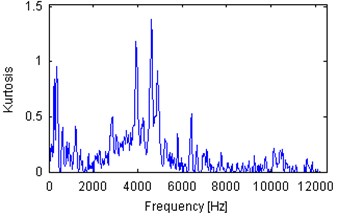
Fig. 6Spectral kurtosis of 10 s parts of vibration signals acquired during operation under load (a), b)) and under no load (c), d)). Panels a) and c) represent machine with locally damaged bearing. Panels b) and d) represent a healthy machine
a)
b)
c)
d)
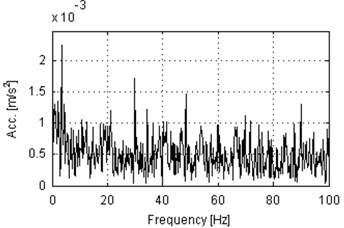
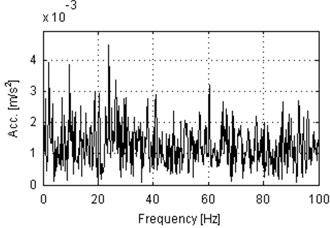
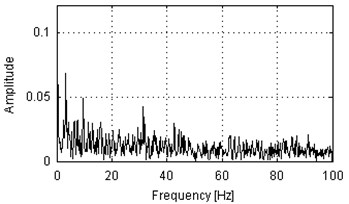
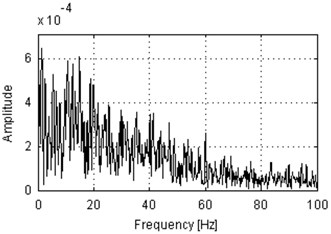
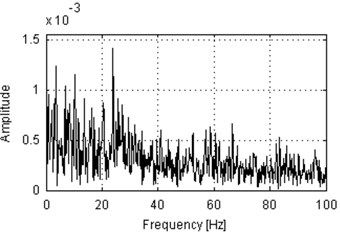
Fig. 7Envelope spectra of SK-filtered of 10 s parts of vibration signals acquired during operation under load (a), b)) and under no load (c), d)). Panels a) and c) represent machine with locally damaged bearing. Panels b) and d) represent a healthy machine
a)
b)
c)
d)
One of the most widely-used local damage detection is spectral kurtosis [1-3, 24]. It is based on the fact that in the case of local damage a set of spikes is present in a vibration signal. This set of spikes might be located in a certain frequency band (called informative frequency band, IFB) and other frequency band might contain non-informative, high-energy components. Thus it is worth to analyze each frequency bin from the spectrogram in order to evaluate its impulsiveness. One of such indicators is kurtosis, but in the literature one can find other, based on various statistical features [6, 29]. Plots of spectral kurtosis (excess of kurtosis over 2) of signals from Fig. 3 are presented in Fig. 6. Each plot indicated different frequency band as informative. It is worth to notice that the spectral kurtosis corresponding to machines operating under load is, in general, larger than SK for machines in idle mode. There is one exception from that rule – SK for the signal from damaged machine (Fig. 6(c)) in idle state is large (above 6) in frequency band between 2 and 3 kHz. Outside this band SK is lower than 0.5 and comparable to SK corresponding to the healthy machine in idle mode (Fig. 6(d)). SK for signals from machines operating under load is significantly larger than 1 and at certain frequency bins is larger than 2. Such values of SK are surely significant, thus it is worth to analyze signals filtered by using frequency characteristics given by SK.
Envelope spectra of signals filtered using SK are presented in Fig. 7. Similar to Fig. 5, set of 30 Hz harmonics cannot be noticed in any of these plots. This yields to the conclusion that all of the informative frequency band indicated by SK in Fig. 6 are not related to any set of cyclic impulses. Thus, we propose to investigate the signals not using envelope spectrum nor spectral kurtosis, but an approach based on cyclostationarity.
4. Analysis of cyclostationarity in presence of impulsive noise
The signal from a faulty bearing is an amplitude modulated signal with an impulsive and cyclic function as the modulation function. Such signals are called second-order cyclostationary (also periodically correlated, PC). Cyclostationary processes have found their application in many fields, including meteorology [30], hydrology [31], economics [32] and, finally, diagnostics of machines [33]. A signal is called cyclostationary with period if its mean and auto-correlation functions satisfy the following properties:
for , and is the smallest constant satisfying these equations [34]. This yields that both mean and the autocorrelation function of a cyclostationary process are periodic with the period equal to . In the case of second-order cyclostationarity, only the instantaneous auto-correlation function is restricted to be periodic with respect to the first argument, i.e.:
Fourier expansion of the auto-correlation function of a PC process is:
and the Fourier coefficients are called cyclic auto-correlation functions or cyclo-correlation functions of signal . Fourier transform of the cyclic auto-correlation function for a cyclic frequency is known as the cyclic power spectrum (cyclo-spectrum) [35]:
where FT denotes the Fourier transform.
A set of cyclic power spectra for all of the cyclic frequencies is called spectral correlation and is defined as [36]:
Normalized counterpart of the spectral correlation is called cyclic spectral coherence (CSC) and it is defined as follows [36]:
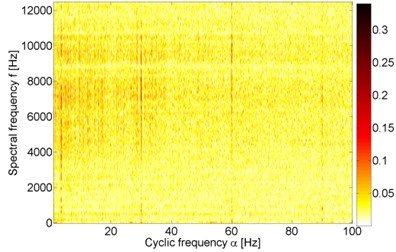
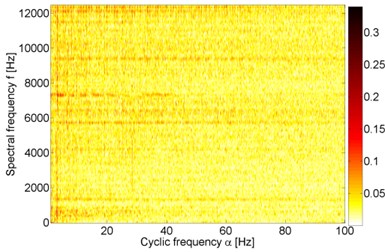
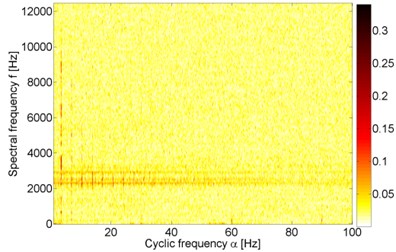
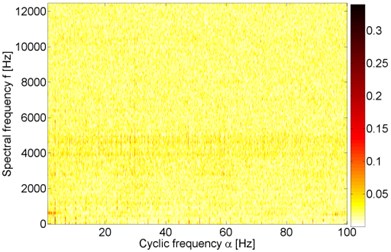
Fig. 8Cyclic spectral coherence of 10 s parts of vibration signals acquired during operation under load (a), b)) and under no load (c), d)). Panels a) and c) represent machine with locally damaged bearing. Panels b) and d) represent a healthy machine
a)
b)
c)
d)
Fig. 8 illustrates application of CSC to all of the previously analyzed 10 s parts of measurements that represent vibrations of healthy and faulty bearing, with and without load applied. All of the maps contain a certain level of correlation at cyclic frequency 3.4 Hz. Since presence of this modulation frequency does not depend on condition of the bearing or load of the machine, it cannot be considered as an informative feature. Moreover, such modulation frequency is not present in Table 1. From the diagnostic point of view the most interesting feature of bi-frequency planes in Fig. 8 is presence of 30 Hz harmonics. These harmonics are present only in the CSC related to the signal from faulty bearing that operates under load (Fig. 8(a)). One can easily see 3 multiplies of 30 Hz, i.e. 30, 60 and 90 Hz. This indicates presence of impulsive amplitude modulation in the vibration signal. Spectral frequencies corresponding to these harmonics are mainly between 4 and 11 kHz. CSC in Fig. 8(c) indicates similar spectral frequency as SK, i.e. 2-3 kHz (Fig. 6(c)), but not a single harmonic nor a set of harmonics’ multiples are indicated (except 3.4 Hz harmonics discussed above). In Fig. 8(b) one can see similar phenomenon as in Fig. 8(c), i.e. several spectral frequencies are indicated, but not at single cyclic frequencies – these spectral frequencies have large values at almost every cyclic frequency. Similarly, larger values of CSC in Fig. 8(d) are revealed only at spectral frequencies slightly lower than 4 kHz, close to 4.5 kHz and at the lowest frequencies, namely below 500 Hz. Such relation between SK and cyclostationarity is consistent with the cutting-edge result presented in [36].
5. Conclusions
In the paper a comprehensive analysis of cyclic spectral coherence (CSC) in order to find damage signature in bearing operating in a hummer crusher is presented. The main problem addressed in the analysis is to detect an inner ring local damage in presence of high impulsive noise. Such contamination is related to specific operation of the hummer crusher – when the load is applied and material stream enters the crusher a lot of impacts appear. Such contamination influence widely-used damage detection methods, like envelope analysis or spectral kurtosis. Harmonics of the fault frequency are not present even in the envelope spectrum of the signal filtered using SK. A solution to this problem is based on the fact that, among two impulsive sources of the signal, one is cyclic (local damage) and the second one is non-cyclic (material stream). Thus, a cyclostationary tool, namely cyclic spectral coherence, distinguish between two different kinds of impulsive noise and clearly indicates a set of fault frequency harmonics. Such damage signature is present only in the part of the measurement that represents vibrations of a faulty machine with load applied. Another part of the same measurement, but related to the idle state, does not contain fault frequency harmonics, even in the cyclic spectral coherence. Signals from healthy bearings does not contain any amplitude modulation related to one of the characteristic frequencies. Although, CSC indicates the impulsive non-cyclic noise for all of the signals. Such feature is demonstrated by relatively large values of CSC at specific spectral frequency and at almost every cyclic frequency.
References
-
Randall R. B., Antoni J. Rolling element bearing diagnostics-A tutorial. Mechanical Systems and Signal Processing, Vol. 25, Issue 2, 2011, p. 485-520.
-
Antoni J. Fast computation of the kurtogram for the detection of transient faults. Mechanical Systems and Signal Processing, Vol. 21, 2007, p. 108-124.
-
Antoni J., Randall R. The spectral kurtosis: application to the vibratory surveillance and diagnostics of rotating machines. Mechanical Systems and Signal Processing, Vol. 20, Issue 2, 2006, p. 308-331.
-
Tandon N. A comparison of some vibration parameters for the condition monitoring of rolling element bearings. Measurement, Vol. 12, Issue 3, 1994, p. 285-289.
-
Obuchowski J., Wylomanska A., Zimroz R. Stochastic modeling of time series with application to local damage detection in rotating machinery. Key Engineering Materials, Vols. 569-570, 2013, p. 441-448.
-
Obuchowski J., Wyłomańska A., Zimroz R. Selection of informative frequency band in local damage detection in rotating machinery. Mechanical Systems and Signal Processing, Vol. 48, Issues 1-2, 2014, p. 138-152.
-
Feldman M. Hilbert transform in vibration analysis. Mechanical Systems and Signal Processing, Vol. 25, Issue 3, 2011, p. 735-802.
-
Randall R. B., Antoni J., Chobsaard S. Comparison of cyclostationary and envelope analysis in the diagnostics of rolling element bearings. IEEE International Conference on Acoustics, Speech and Signal Processing – Proceedings, Vol. 6, 2000, p. 3882-3885.
-
Zimroz R., Bartelmus W. Application of adaptive filtering for weak impulsive signal recovery for bearings local damage detection in complex mining mechanical systems working under condition of varying load. Solid State Phenomena, Vol. 180, 2012, p. 250-257.
-
Al-Ghamd A. M., Mba D. A comparative experimental study on the use of acoustic emission and vibration analysis for bearing defect identification and estimation of defect size. Mechanical Systems and Signal Processing, Vol. 20, Issue 7, 2006, p. 1537-1571.
-
Burdzik R., Konieczny L., Folęga P. Structural health monitoring of rotating machines in manufacturing processes by vibration methods. Advanced Materials Research, Vol. 1036, 2014, p. 642-647.
-
Obuchowski J., Wylomanska A., Zimroz R. Two-stage data driven filtering for local damage detection in presence of time varying signal to noise ratio. Vibration Engineering and Technology of Machinery Mechanisms and Machine Science, Vol. 23, 2015, p. 401-410.
-
Barszcz T., Zimroz R., Urbanek J., Jabłoński A., Bartelmus W. Bearings fault detection in gas compressor in presence of high level of non-Gaussian impulsive noise. Key Engineering Materials, Vols. 569-570, 2013, p. 473-480.
-
Feng Z., Liang M., Chu F. Recent advances in time-frequency analysis methods for machinery fault diagnosis: a review with application examples. Mechanical Systems and Signal Processing, Vol. 38, Issue 1, 2013, p. 165-205.
-
Martin N. AR spectral analysis of non-stationary signals. Signal Processing, Vol. 10, Issue 1, 1986, p. 61-74.
-
Obuchowski J., Wyłomańska A., Zimroz R. The local maxima method for enhancement of time-frequency map and its application to local damage detection in rotating machines. Mechanical Systems and Signal Processing, Vol. 46, Issue 2, 2014, p. 389-405.
-
Lazarz B., Wojnar G., Czech P. Early fault detection of toothed gear in exploitation conditions. Eksploatacja i Niezawodnosc – Maintenance and Reliability, Vol. 49, Issue 1, 2011, p. 68-77.
-
Wang W., Wong A. K. Autoregressive model-based gear fault diagnosis. Journal of Vibration and Acoustics, Transactions of the ASME, Vol. 124, Issue 2, 2002, p. 172-179.
-
Spiridonakos M. D., Fassois S. D. FS-TARMA models for non-stationary vibration analysis: an overview and comparison. IFAC Proceedings Volumes (IFAC-PapersOnline), Vol. 15, 2009, p. 1241-1246.
-
Fassois S. D. MIMO LMS-ARMAX identification of vibrating structures – Part I: The method. Mechanical Systems and Signal Processing, Vol. 15, Issue 4, 2001, p. 723-735.
-
Ben Mrad R., Fassois S. D., Levitt J. A. A polynomial-algebraic method for non-stationary TARMA signal analysis – Part I: The method. Signal Processing, Vol. 65, Issue 1, 1998, p. 1-19.
-
Makowski R. A., Zimroz R. Adaptive Bearings Vibration Modelling for Diagnosis. Lecture Notes in Computer Science (Including subseries Lecture Notes in Artificial Intelligence and Lecture Notes in Bioinformatics), 6943 LNAI, 2011, p. 248-259.
-
Makowski R., Zimroz R. A procedure for weighted summation of the derivatives of reflection coefficients in adaptive Schur filter with application to fault detection in rolling element bearings. Mechanical Systems and Signal Processing, Vol. 38, Issue 1, 2013, p. 65-77.
-
Combet F., Gelman L. Optimal filtering of gear signals for early damage detection based on the spectral kurtosis. Mechanical Systems and Signal Processing, Vol. 23, Issue 3, 2009, p. 652-668.
-
Dybała J., Zimroz R. Rolling bearing diagnosing method based on empirical mode decomposition of machine vibration signal. Applied Acoustics, Vol. 77, 2014, p. 195-203.
-
Gao Q., Duan C., Fan H., Meng Q. Rotating machine fault diagnosis using empirical mode decomposition. Mechanical Systems and Signal Processing, Vol. 22, Issue 5, 2008, p. 1072-1081.
-
Barszcz T., Jabłoński A. Analysis of fast kurtogram performance in case of high level non-Gaussian noise. 16th International Congress on Sound and Vibration, Vol. 4, 2009, p. 2554-2561.
-
Zimroz R., Obuchowski J., Wyłomańska A. Bearings damage detection in presence of heavy non-Gaussian noise via cyclo-stationary analysis. Vibroengineering Procedia, Vol. 3, 2014, p. 88-92.
-
Barszcz T., Jabłoński A. A novel method for the optimal band selection for vibration signal demodulation and comparison with the Kurtogram. Mechanical Systems and Signal Processing, Vol. 25, Issue 1, 2011, p. 431-451.
-
Bloomfield P., Hurd H. L., Lund R. B. Periodic correlation in stratospheric ozone data. Journal of Time Series Analysis, Vol. 12, 1994, p. 127-150.
-
Vecchia A. V. Periodic autoregressive-moving average (PARMA) modeling with applications to water resources. Water Resources Bulletin, Vol. 21, 1965, p. 21-730.
-
Broszkiewicz-Suwaj E., Makagon A., Weron R., Wylomanska A. On detecting and modeling periodic correlation in financial data. Physica A, Vol. 336, 2004, p. 196-205.
-
Wyłomańska A., Obuchowski J., Zimroz R., Hurd H. Periodic autoregressive modeling of vibration time series from planetary gearbox used in bucket wheel excavator, in cyclostationarity. Theory and Methods Lecture Notes in Mechanical Engineering, 2014, p. 171-186.
-
Gladyshev E. G. Periodically Correlated Random Sequences. Soviet Math 2, 1961, p. 385-388.
-
Antoni J. Cyclic spectral analysis in practice. Mechanical Systems and Signal Processing, Vol. 21, Issue 2, 2007, p. 597-630.
-
Borghesani P., Pennacchi P., Chatterton S. The relationship between kurtosis- and envelope-based indexes for the diagnostic of rolling element bearings. Mechanical Systems and Signal Processing, Vol. 43, Issues 1-2, 2014, p. 25-43.
About this article

This work is partially supported by the Statutory Grant No. S40128 (J. Obuchowski).
