Abstract
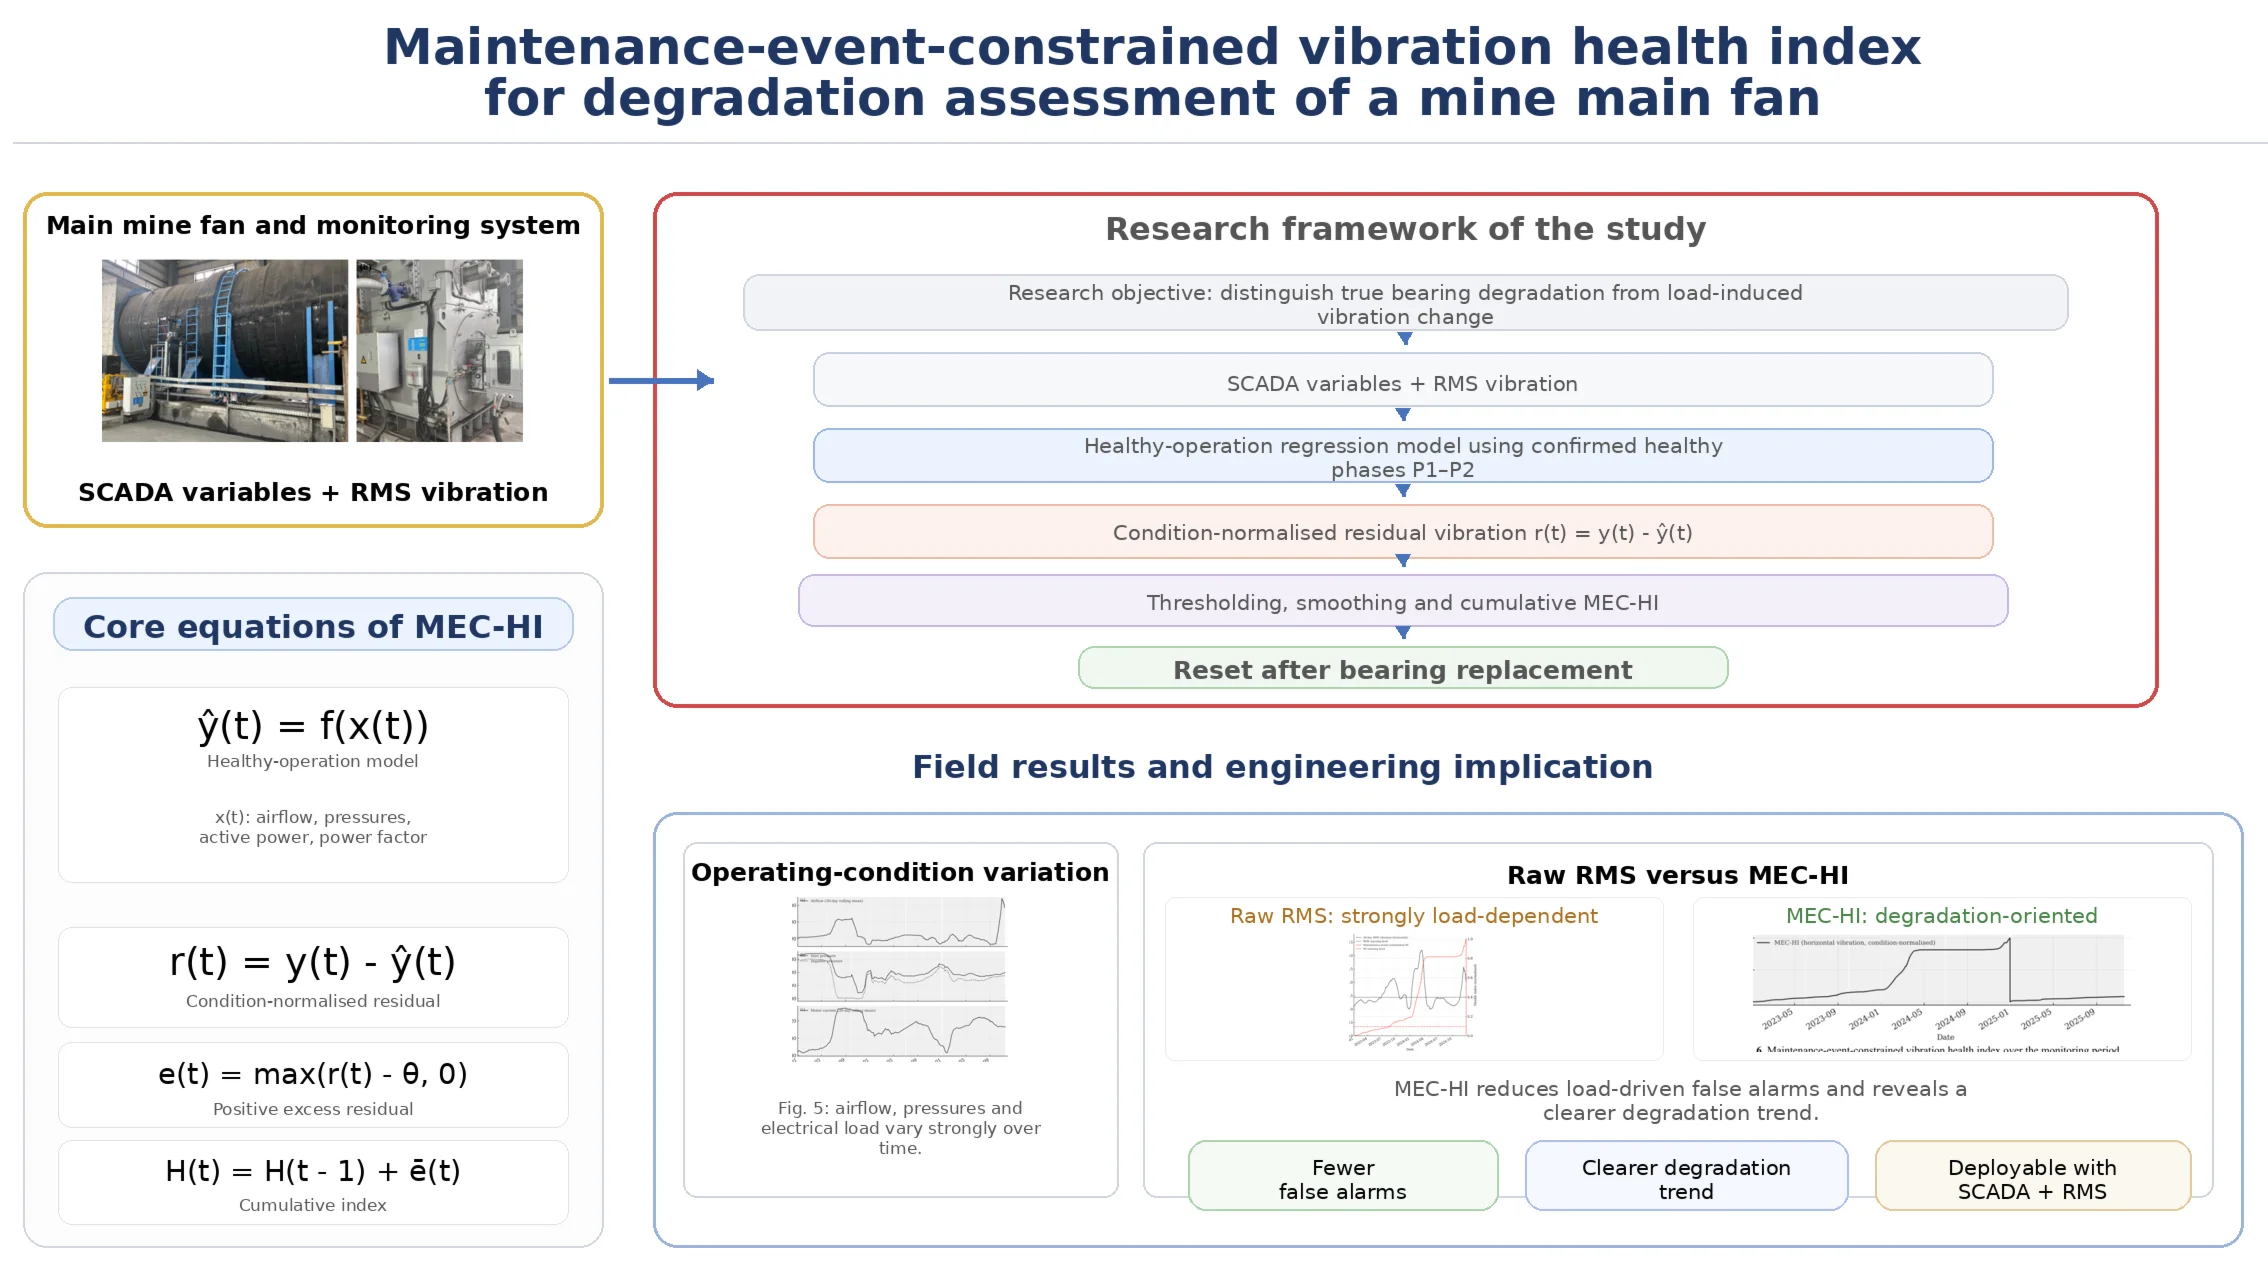
Reliable operation of main mine ventilation fans is essential for mine safety and production continuity. In many mines, fan condition is still judged against fixed vibration limits that do not account for changes in airflow and pressure, which can lead to frequent false alarms and ambiguous interpretation of mechanical degradation. This paper proposes a maintenance-event-constrained vibration health index (MEC-HI) that combines operating-condition modelling with long-term residual vibration analysis using SCADA-level measurements. A linear regression model is first fitted to relate bearing RMS vibration velocity to airflow, differential pressure and motor electrical quantities during confirmed healthy operating phases. The model is then used to estimate the expected vibration level and to compute condition-normalised residual vibration. Positive residuals exceeding a statistically derived tolerance are smoothed and accumulated over time within segments separated by major maintenance events, and the cumulative index is reset after bearing replacement. Unlike many health-indicator studies that rely on high-frequency waveforms or fault-specific feature engineering, the proposed framework targets practical deployment when only routine RMS and operating tags are archived. The approach is demonstrated using a three-year dataset (24,672 operating hours) from an axial-flow main fan in a large underground copper mine. The case study shows that MEC-HI captures the onset and progression of bearing degradation more clearly than raw RMS trends and suppresses load-driven false alarms, while remaining implementable with routinely available SCADA measurements. The framework can be extended to other ventilation fans and rotating machinery operating under strongly varying loads.
Highlights
- A maintenance-event-constrained vibration health index (MEC-HI) was developed for degradation assessment of a mine main fan under strongly varying operating conditions.
- Expected RMS vibration was modelled using SCADA variables, allowing condition-normalised residual vibration to separate mechanical degradation from load-related fluctuation.
- Positive residuals beyond a statistically defined healthy range were smoothed and accumulated within maintenance segments, with index reset after bearing replacement.
1. Introduction
Underground mines increasingly operate at large scale and high intensity, placing stringent demands on the reliability of ventilation systems. The main mine ventilation fan is the critical asset that delivers fresh air to underground workings, dilutes toxic and explosive gases, and controls dust concentrations in return airways [1]. If the main fan is forced to shut down or suffers severe performance loss, production must be reduced or halted and personnel evacuated, leading to substantial economic loss and elevated safety risk [2]. Ensuring long-term safe and reliable fan operation is therefore a prerequisite for modern mining [3, 4].
In many mines, main-fan condition is still assessed through periodic manual inspection and time-based maintenance, sometimes supplemented by simple online vibration monitoring [5]. Overall vibration measures such as root-mean-square (RMS) velocity, peak value, and band-limited energy are compared with fixed alarm thresholds, and operators interpret fan condition from their trends [6]. These approaches are straightforward and can reveal severe faults, such as rotor imbalance, misalignment, or structural looseness, when operating conditions are relatively stable. However, because a main fan serves the entire mine, airflow, fan pressure, and motor load can change markedly with production schedules, new development headings, and seasonal ventilation adjustments. Under such variability, conventional vibration indicators are strongly load dependent: higher airflow or pressure naturally increases vibration even when the mechanical state does not degrade. This makes it difficult to separate true degradation from normal fluctuations, which can both mask incipient bearing faults and trigger frequent false alarms that undermine operator confidence [7, 8].
In practice, broadband vibration-velocity RMS measured on bearing housings remains the dominant severity metric in standards and maintenance workflows, including the ISO 20816 series, because it is robust, easy to trend, and closely related to overall vibration energy [9]. For large mine fans, vibration monitoring is often implemented via SCADA historians that archive low-rate summary values rather than high-frequency waveforms, owing to bandwidth, storage, and operational constraints [10, 11]. Although RMS is not intended for fault-type classification, it is widely used to quantify severity and to support condition-based decisions. This motivates extracting more diagnostic value from RMS by compensating for operating-condition effects and by incorporating maintenance information [12].
There is extensive research on vibration-based condition monitoring, health indicators (HIs), and data-driven degradation models for rotating machinery, including bearings, gearboxes, and industrial fans [13, 14]. Reported methods include constructing HIs from time-frequency features using principal component analysis [15, 16], modelling degradation in probabilistic state-space frameworks [17], and learning latent health variables with autoencoders or deep neural networks [18-20]. These indicators are designed to reflect underlying damage and often exhibit approximately monotonic evolution over a life cycle, which supports degradation assessment and remaining useful life prediction [21]. However, many studies rely on laboratory rigs or short-term field datasets with relatively stable operating conditions and focus primarily on vibration signals [22]. Only a limited number explicitly incorporate operating variables from supervisory control and data acquisition (SCADA) systems, such as airflow rate, fan pressure, motor current, and active power, into HI construction. Maintenance information, including lubrication overhaul, abnormal operating episodes, and bearing replacement, is more often discussed qualitatively than used as a quantitative constraint on indicator evolution [23]. For main mine ventilation fans in particular, long-term degradation assessment that jointly considers vibration, SCADA data, and maintenance events has received limited attention [24].
Research on industrial fans has expanded in recent years. Laboratory and field studies on mine ventilation fans and tunnel ventilation equipment have investigated fault diagnosis using vibration, pressure, and electrical measurements, often combining time-frequency decomposition with feature fusion and classification models [25-27]. Industrial deployments have also been reported for tunnel ventilation systems and wireless vibration monitoring of industrial fans, reflecting the growing feasibility of online measurements in harsh environments [28-30]. Yet for main mine ventilation fans, practice still shows persistent gaps: many methods prioritise fault classification using high-frequency signals, while long-term degradation assessment is frequently reduced to simple RMS thresholding. In addition, maintenance records, such as bearing replacement, are seldom used as explicit constraints that would encourage an interpretable, monotonic health index that can be implemented directly as SCADA tags and alarms. Recent reviews of SCADA-based condition monitoring similarly emphasise the need for robust normal-behaviour models, careful data cleaning, and explainability to achieve reliable adoption under variable operating conditions [31, 32].
This paper addresses these issues by developing a maintenance-event-constrained vibration health index for degradation assessment of a main mine ventilation fan, using nearly three years of field data from an underground copper mine. The key idea is to combine a SCADA-based normal-behaviour model, which explains expected RMS vibration under varying airflow and pressure, with maintenance-event segmentation that resets accumulated degradation after major overhaul. The resulting index is simple, interpretable, and designed for online deployment. Specifically, we compile and analyse a long-term multi-source dataset for a Howden AMN4240/2000B main fan, comprising 24,672 hourly samples of horizontal and vertical vibration-velocity RMS, airflow, fan pressures, motor voltage and current, active and reactive power, and recorded maintenance events. We then propose a condition-normalised health index in which an operating-condition model estimates expected vibration as a function of airflow, pressure, and electrical variables, and positive residual vibration beyond this model is smoothed and accumulated over time. Finally, a detailed case study compares the proposed index with conventional RMS monitoring across multiple operating phases, showing clearer separation between benign high-load operation and true degradation and providing more reliable long-term information to support condition-based bearing replacement.
2. Monitoring system and data description
2.1. Main mine ventilation fan and operating conditions
The case study is conducted on the main ventilation system of an underground copper mine operated by Serbia Zijin Mining. The mine adopts a central exhaust ventilation scheme, in which a single surface main fan provides the driving force for air exchange between underground workings and the atmosphere. The fan is installed in a reinforced concrete fan house at the exhaust shaft collar and is connected to the shaft through a steel duct and transition section. It operates almost continuously throughout the year, and any forced shutdown requires reduction or suspension of production and evacuation of underground personnel.
The main fan is a Howden AMN4240/2000B axial-flow unit driven by an induction motor through a direct-coupled shaft. The rotor is equipped with adjustable blades, and the blade pitch angle can be modified during planned stoppages to adapt to long-term changes in ventilation demand. Under normal conditions the fan maintains a prescribed negative pressure at the shaft and delivers sufficient airflow to active production levels, development headings and return airways. The operating point is influenced by mine layout, production intensity and seasonal variations in air density, which lead to noticeable changes in required airflow and pressure over different periods of the year.
In daily operation, the fan is supervised and controlled through the mine SCADA system. Ventilation engineers adjust the underground network by opening or closing regulators and by turning auxiliary fans on and off, which changes the total system resistance seen by the main fan. As a result, the fan experiences substantial variations in airflow, inlet and impeller pressures and motor load between low-demand periods, such as night shifts with reduced production, and high-demand periods when multiple stopes and development headings are operating simultaneously. Occasional abnormal episodes, including partial blockage of airways or abrupt ventilation network adjustments, can induce short-term overloads and transient increases in vibration. These strongly time-varying operating conditions form an important background for interpreting the long-term vibration response and for constructing a health index that is robust to normal load changes.
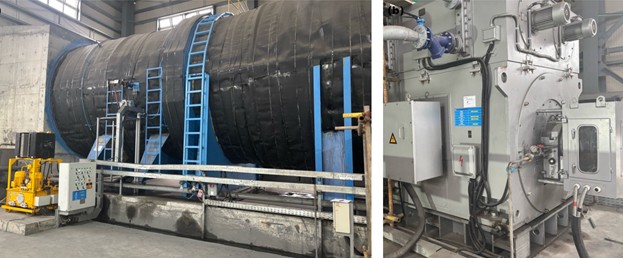
The main fan, exhaust shaft connection and sensor locations are illustrated in Fig. 1.
Fig. 1Main mine ventilation fan and monitoring arrangement. Photo by the authors at Serbia Zijin Mining, 2025
2.2. Vibration and SCADA measurements
The main fan is equipped with an online monitoring system that records both vibration and operating variables and stores them in the mine SCADA historian. Vibration velocity is measured on the bearing housing of the fan rotor by two permanently mounted velocity sensors arranged in the horizontal and vertical directions. The monitoring system calculates the overall root-mean-square (RMS) vibration velocity in millimeters per second for each direction and transmits these values to the SCADA system. In this study, the hourly RMS vibration velocities in horizontal and vertical directions are used as the primary condition indicators of the fan, because they are directly related to the vibration limits defined in industrial standards and are routinely inspected by site engineers.
In addition to vibration, several operating variables that describe the loading of the fan and the ventilation system are continuously measured and stored. These include the airflow rate at the exhaust shaft, the inlet pressure at the fan intake and the static pressure near the impeller, together with motor electrical quantities such as line voltage, stator current, active power, reactive power and power factor. The blade angle setting of the axial fan is also recorded after adjustments during planned stoppages. The vibration and SCADA variables used in this paper, together with their units and brief descriptions, are summarised in Table 1.
Table 1List of monitored vibration and SCADA variables used in this study
Variable | Unit | Description |
Time stamp | – | Date and time of each record (hourly sampling from 1 Dec 2022 to 17 Nov 2025) |
Blade angle setting | % | Relative pitch angle setting of axial-fan blades, updated after planned adjustments |
Mechanical angle | deg | Mechanical angle of the blade adjustment mechanism, proportional to blade pitch |
Inlet pressure | Pa | Static pressure measured at the fan inlet (negative relative to atmosphere) |
Impeller pressure | Pa | Static pressure measured near the fan impeller outlet. |
Airflow rate | m³/min | Total airflow through the exhaust shaft derived from calibrated ventilation measurements |
Horizontal RMS vibration | mm/s | Overall RMS vibration velocity measured on the fan bearing housing in the horizontal direction |
Vertical RMS vibration | mm/s | Overall RMS vibration velocity measured on the fan bearing housing in the vertical direction |
Line voltage | kV | Three-phase line voltage at the motor terminals |
Stator current | A | Three-phase stator current of the drive motor |
Active power | kW | Active power drawn by the motor, proportional to mechanical output and load |
Reactive power | kVAr | Reactive power associated with magnetising current |
Power factor | – | Ratio of active power to apparent power, indicating motor loading and efficiency |
All vibration and SCADA variables are synchronised and archived as time-stamped records at one-hour intervals from 1 December 2022 to 17 November 2025, forming a nearly three-year multivariate time series. Short gaps are present in the data due to planned shutdowns, major maintenance activities and occasional communication interruptions. These periods are identified from the operating logs and SCADA tags and are excluded or treated separately in the subsequent data processing. The combination of vibration and operating measurements provides the basis for modelling the dependence of vibration on operating conditions and for constructing a health index that reflects the underlying mechanical degradation rather than normal variations in airflow, pressure and motor load.
2.3. Operating phases and maintenance events
From December 2022 to November 2025, the main fan experienced multiple operating phases rather than a single steady condition. Based on operating logs, maintenance records, and inspection reports, the key phases and major maintenance events were identified and are summarised in Table 2 for the subsequent analysis of vibration and health index evolution.
Table 2Main operating phases and maintenance events of the main mine ventilation fan during the monitoring period
Phase / event | Approximate period | Operating condition | Main maintenance / remarks |
P1 Baseline operation | Dec 2022 – May 2023 | Normal loading; moderate airflow demand and relatively stable vibration levels | Routine inspections only; no major maintenance recorded |
P2 High-load operation | Jun 2023 – Aug 2023 | Prolonged high-load period with increased airflow and fan pressure; motor current and active power clearly higher than in P1 | Re-lubrication of bearings and cleaning of fan blades to cope with higher loading |
P3 Ventilation system adjustment | Sep 2023 – Dec 2023 | Large-scale adjustment of the mine ventilation network; closing of regulators and airways, changes in auxiliary fans; operating point of the main fan fluctuates over a wide range | Several short abnormal episodes associated with network changes; local cleaning of deposits in airways |
P4 Early degradation stage | Jan 2024 – Jun 2024 | Under comparable operating conditions the RMS vibration levels gradually increase and abnormal noise is occasionally reported near the drive-end bearing | Minor maintenance actions such as blade angle adjustment and removal of accumulated mud; bearing replacement is considered but not yet executed |
P5 Severe degradation stage | Jul 2024 – 28 Dec 2024 | Bearing degradation becomes dominant; vibration levels are markedly higher and abnormal observations are more frequent, indicating increased failure risk | Repeated inspections and clearance adjustments are carried out while keeping the fan in service until a planned shutdown window is available |
M1 Major maintenance event | 29–31 Dec 2024 | Planned shutdown of the main fan for overhaul | Complete replacement of the main bearing and related components; re-commissioning of the fan after maintenance |
P6 Post maintenance healthy operation | Mar 2025 – Sep 2025 | Post-maintenance operation with clearly reduced vibration levels under similar or higher airflow and pressure compared with P2–P5 | No further major faults recorded; only routine inspections and minor adjustments |
In the initial baseline phase P1 (from 1 December 2022 to 31 May 2023), the mine operated at moderate production levels and the ventilation network was relatively stable. The main fan supplied the required airflow with no major changes in regulator settings or network configuration, and routine inspections did not report abnormal noise or overheating. The RMS vibration remained at a low and stable level under comparable operating conditions, and this phase is therefore regarded as representative of healthy bearing operation.
In the high-load phase P2 (from 1 June to 31 August 2023), several new stopes and development headings were opened, and the ventilation demand increased noticeably. The main fan operated at higher airflow and pressure, and the motor load was significantly above the baseline level. The RMS vibration also increased during this period, but inspections did not reveal clear signs of mechanical damage. P2 is therefore interpreted as a period of prolonged high-load operation without confirmed bearing degradation.
In the ventilation adjustment phase P3 (from 1 September to 31 December 2023), the mine ventilation system underwent a large-scale reconfiguration. Ventilation engineers changed regulator settings, opened and closed airways and modified the operation of auxiliary fans in order to accommodate new production layouts. These adjustments caused substantial fluctuations in airflow, pressure and motor load, with several short abnormal episodes in which the fan temporarily operated outside its usual range. The vibration response in this period shows pronounced variations associated with these network changes.
In the early degradation phase P4 (from 1 January to 30 June 2024), routine vibration monitoring and periodic inspections indicated that vibration levels under comparable operating conditions were gradually increasing, and abnormal noise was occasionally reported near the drive-end bearing. No catastrophic fault occurred, and the fan remained in service, but mine engineers started to suspect bearing degradation and began considering bearing replacement during a future planned shutdown. In the severe degradation phase P5 (from 1 July to 28 December 2024), the degradation became more evident, with higher vibration levels, more frequent abnormal observations and an increased risk of failure. This phase is therefore treated as a severe degradation stage of the main fan bearing.
A complete replacement of the main fan bearing was carried out during a planned shutdown between 29 and 31 December 2024. After this major maintenance event, the vibration levels dropped markedly and stabilised at a much lower level under similar operating conditions. The subsequent operation in 2025, from 1 March to 30 September, is regarded as the post-maintenance healthy phase P6, although occasional short shutdowns and communication gaps still appear in the data. In this phase the fan operates under comparable or even higher airflow and pressure than in the earlier high-load period, but the vibration remains at a low level, confirming the effectiveness of the bearing replacement.
These operating phases and maintenance events provide important reference information for the analyses in Sections 3 and 4. They are used to select representative time windows, to interpret the evolution of the vibration-based health index in different stages and to verify that the index behaves consistently with known degradation and maintenance actions.
3. Construction of maintenance-event-constrained vibration health index
3.1. Operating-condition modelling and residual vibration
As discussed in Section 2, the vibration of the main mine fan is strongly influenced by operating conditions such as airflow, pressure and motor load. Before constructing a health index, it is therefore necessary to separate the effect of changing operating conditions from the effect of mechanical degradation. In this study, this is achieved by modelling the dependence of the overall RMS vibration velocity on key SCADA variables under non-degraded conditions and then analysing the residual vibration relative to this model.
The analysis focuses on the overall RMS vibration velocity at the drive-end bearing of the main fan in the horizontal and vertical directions. Let and denote the hourly RMS vibration velocities at time t in the horizontal and vertical directions, respectively. For each hour the corresponding SCADA records provide the airflow rate at the exhaust shaft, , the inlet pressure at the fan intake, , the static pressure near the impeller and motor electrical quantities such as active power , reactive power, voltage, current and power factor . These variables describe the loading of the fan and the ventilation system at each time step.
To obtain a reference model representing healthy operation, a training dataset is selected from the early monitoring period. In particular, data from the baseline stage (December 2022-May 2023, phase P1) and the high-load stage without confirmed degradation (June-August 2023, phase P2) are used, after removing hours affected by planned shutdowns, major maintenance and obviously abnormal operating episodes. During these stages, inspections did not reveal bearing damage and the vibration levels, although higher in P2 due to increased load, were considered acceptable by site engineers. As shown later, the residuals in P1 and P2 do not exhibit a systematic positive bias, so these phases are regarded as representative of non-degraded conditions over a wide range of operating points.
For each vibration direction, a regression model is fitted to describe the expected RMS vibration velocity as a function of the operating variables. In view of the strong correlations among electrical quantities, only active power and power factor are retained as representative load variables, while voltage and current do not improve the model fit. The model takes the form:
where denotes the expected RMS vibration velocity under non-degraded conditions. A multiple linear regression structure with selected quadratic and interaction terms is adopted. Model parameters are estimated from the P1-P2 training data, and the model performance is checked using standard error measures, cross-validation and residual analysis. The resulting models capture the main trend of increasing vibration with increasing airflow, pressure and load under healthy conditions, while remaining simple enough to retain physical interpretability.
For clarity, the following formulation is written for a single vibration direction; the same procedure is applied separately to the horizontal and vertical RMS vibration. The residual vibration is defined as:
where is the measured RMS vibration velocity and is the corresponding model prediction at time . Positive residuals indicate that the measured vibration is higher than expected for the given operating condition, whereas negative residuals indicate lower-than-expected vibration. In the baseline and high-load healthy stages (P1-P2) the residuals fluctuate around zero with limited variance and do not show a clear trend over time, while sustained positive residuals in later stages suggest additional vibration that cannot be explained by normal variations in airflow, pressure and motor load.
The residual vibration signal thus provides a condition-normalised measure of the fan vibration and forms the basis for the subsequent construction of the vibration health index [33].
The performance of the operating-condition model for horizontal vibration is illustrated in Fig. 2.
Fig. 2Performance of the operating-condition regression model for horizontal vibration
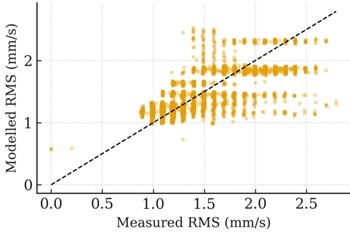
a) Horizontal vibration 0.63
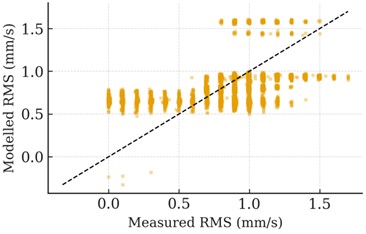
b) Vertical vibration 0.24
3.2. Health index formulation with maintenance constraints
The residual vibration obtained from the operating-condition model represents the part of the overall RMS vibration that cannot be explained by normal changes in airflow, pressure and motor load. To use this signal for degradation assessment, a scalar health index is designed to satisfy three requirements: it should remain low and relatively stable during confirmed healthy operation, increase as mechanical degradation progresses and respond consistently to major maintenance actions such as bearing replacement. Here, a maintenance-event-constrained vibration health index is defined by transforming and accumulating the residual vibration, while using the known operating phases and maintenance records as practical checks on its behaviour.
The construction is described for the horizontal RMS vibration at the drive-end bearing, which showed a clearer degradation trend; the same procedure is applied to the vertical direction for consistency checks. Let denote the residual vibration in the chosen direction at hour 𝑡. First, the residuals in the non-degraded phases P1-P2 are used to define a healthy reference range. Denote by and the mean and standard deviation of in P1-P2. A tolerance level is introduced as:
where is chosen such that approximately corresponds to a high percentile (about 95 %) of the residual distribution in P1-P2. In these phases, random residual fluctuations are therefore expected to lie below most of the time. The instantaneous excess residual is then defined as:
This transformation suppresses small residual variations that are consistent with healthy operation and retains only the part of the vibration that exceeds the healthy reference range.
To reduce the influence of isolated spikes and emphasise persistent changes, the excess residual is smoothed by a moving average over a sliding window of length W hours. Although the moving-average smoothing in Eq. (5) already mitigates isolated spikes, we additionally quantified the occurrence of sporadic outliers in the archived hourly RMS sequence and verified that the proposed MEC-HI and the phase-wise RMS exceedance statistics are insensitive to such artefacts. Specifically, a Hampel identifier was applied to the detrended hourly horizontal RMS (7-day median trend removed) using a 49-h window and a 4×(1.4826·MAD) threshold; only isolated detections (no adjacent flagged points within ±3 h) were treated as outliers. The occurrence rates and a sensitivity check are reported in Table A1:
The window length is selected within a range that is long enough to suppress short-term disturbances, such as brief operating transients, but still short enough to capture gradual changes over weeks. Several candidate values of are examined, and it is verified that the main degradation trends are robust within this range. In healthy phases the smoothed excess stays close to zero, whereas during degradation it becomes consistently positive.
The vibration health index is then defined as the cumulative sum of the smoothed excess residual:
where denotes the starting time of the considered operating segment. By construction, is non-decreasing within a segment and increases more rapidly when the residual vibration persistently exceeds the tolerance level . In practice, the degradation rate is characterised by the slope of over a given period rather than by its absolute value, so that differences in monitoring duration between segments do not bias the assessment. A few isolated spikes in produce only a small local increase in , whereas sustained excess residuals lead to much steeper growth [29].
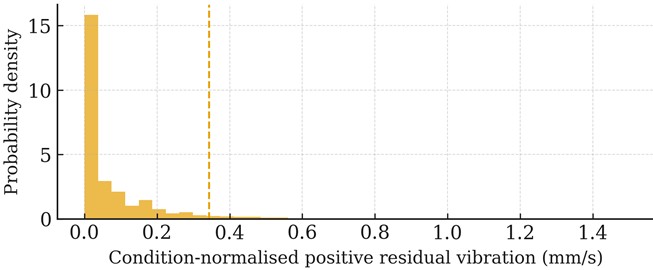
Fig. 3 shows the distribution of residuals in the baseline healthy phase and the resulting statistical warning threshold .
Major maintenance events are used to segment the monitoring period and to check the consistency of the index. The complete bearing replacement carried out between 29 and 31 December 2024 divides the data into a pre-replacement segment and a post-replacement segment. The index is computed separately for each segment, with its initial value reset to zero at the beginning of the segment. Before replacement, is expected to grow slowly in the baseline and high-load healthy phases P1-P2 and to accelerate as the fan passes through the early and severe degradation phases P4-P5. After replacement, the evolution of in 2025 is expected to resemble that of P1, with slow growth indicative of healthy operation. The phase division P1-P6 and the bearing replacement event are thus used mainly to verify that the chosen tolerance level and window length lead to an index evolution consistent with known degradation stages and maintenance actions, rather than to tune the index to a particular pattern.
Fig. 3Distribution of residual horizontal vibration in the baseline healthy phase and definition of the statistical warning threshold
To enable comparison across measurement directions and maintenance segments, the cumulative index is scaled linearly to the range [0, 1] within each segment. The resulting maintenance-event-constrained vibration health index provides an interpretable, condition-normalised measure of accumulated degradation, which is used in the following sections to examine the long-term behaviour of the main mine ventilation fan and to benchmark its performance against conventional vibration indicators [34].
3.3. Implementation details
This subsection summarises the practical steps used to train the operating-condition model, compute the residual vibration and construct the maintenance-event-constrained health index. The procedure can be divided into three stages: data pre-processing, regression model identification and long-term computation of the residuals and health index.
3.3.1. Data pre-processing
All vibration and SCADA records are first aligned on the hourly time axis from 1 December 2022 to 17 November 2025. Records with missing or obviously inconsistent values in any of the key variables (RMS vibration, airflow, pressures, motor active power, power factor) are discarded. Hours corresponding to planned shutdowns and major maintenance activities are identified from the operating logs and from SCADA tags, and are excluded from the training dataset. Hours with extremely low airflow and motor power are also treated as non-operating and removed from the analysis. To reduce the risk that sporadic sensor glitches or communication artefacts interfere with diagnosis, isolated outliers in RMS vibration and key operating tags are additionally flagged using robust median-based rules (e.g., Hampel identification in a sliding window) and treated as missing values during model fitting and health-index updating.
For the remaining operating hours, the input variables used in the regression model (airflow, inlet pressure, impeller pressure, active power, and power factor) are standardised to zero mean and unit variance based on statistics from the P1-P2 training data. This improves numerical conditioning and makes the relative importance of different regressors more transparent. The RMS vibration outputs are kept in physical units (mm/s) so that the residual vibration and the subsequent health index maintain a clear engineering interpretation.
3.3.2. Regression model identification under non-degraded conditions
The operating-condition model is trained using data from the baseline phase P1 and the high-load healthy phase P2, after the cleaning described above. For each vibration direction, the available P1-P2 samples are randomly split into a training subset and a validation subset. A multiple linear regression model with selected quadratic and interaction terms in the standardised input variables is then fitted to the training subset by ordinary least squares.
Several candidate model structures, differing in the included quadratic and interaction terms, are compared using the validation error (root-mean-square error) and information criteria such as the Akaike information criterion. Because of strong correlations among electrical quantities, only active power and power factor are retained as load variables; adding voltage or current was found not to yield a meaningful reduction in validation error. Residual plots and basic diagnostics such as variance inflation factors are used to check that no single regressor dominates due to multicollinearity and that no strong systematic patterns remain in the residuals.
The final models for the horizontal and vertical directions are chosen as the simplest structures that provide a satisfactory fit across the operating range covered by P1-P2. Numerical performance indices of the selected models (e.g. training and validation RMSE and ) are reported in Section 4 together with illustrative plots of measured versus predicted vibration in the non-degraded phases.
3.3.3. Long-term computation of residuals and health index
Once the operating-condition models have been identified, they are applied to the entire three-year dataset. For each operating hour and for each vibration direction, the model prediction is computed from the corresponding SCADA variables, and the residual vibration is obtained as .
The instantaneous excess residual and the smoothed excess are evaluated for each hour using a moving-average window of length . In hours where the window contains too many missing or non-operating samples (for example, due to short shutdowns or communication gaps), is not updated and the health index is held constant. For continuous operating periods, the vibration health index is computed by cumulative summation of , with the initial value reset to zero at the beginning of each segment defined by major maintenance events. In this study, the complete bearing replacement at the end of 2024 is used to separate the pre-replacement and post-replacement segments.
In the subsequent analysis, the health index based on the horizontal RMS vibration is used as the main indicator of degradation, while the index obtained from the vertical direction is used for consistency checks. For graphical comparison across phases and segments, is normalised to the range [0, 1] within each segment. The full processing chain, from raw vibration and SCADA data to the maintenance-event-constrained health index, can be summarised in a flowchart and provides a reproducible framework for long-term vibration-based degradation assessment of the main mine fan.
The proposed MEC-HI is constructed primarily from overall vibration velocity RMS, because this quantity is routinely available in mine SCADA historians and is directly aligned with the vibration severity measures used in industrial standards and plant alarm practices [9]. In the present application, the goal is robust identification and trending of progressive bearing degradation under strongly varying load, rather than detailed fault-mode classification. By modelling the expected RMS as a function of airflow, pressure and electrical load, and by accumulating only the statistically significant positive residuals, the MEC-HI extracts degradation information that is not visible from raw RMS trends alone. This makes RMS sufficient for the intended decision task (early warning and maintenance scheduling) while keeping the method interpretable and implementable in a production SCADA environment.
Nevertheless, additional diagnostic indicators can complement RMS when higher-resolution vibration data are available. Within a sliding window of length W, dispersion and impulsiveness statistics such as the coefficient of variation, skewness and kurtosis can be computed for a vibration feature sequence, and the crest factor can be evaluated when both peak and RMS values are recorded. Such indicators are known to improve sensitivity to transient impacts in early bearing damage. To incorporate them in the proposed framework, each indicator can be normalised using the same operating-condition modelling approach (i.e., constructing a residual relative to a normal-behaviour model) and then fused into a multivariate health index using established techniques such as PCA or isolation-forest-based fusion [30]. Recent SCADA condition-monitoring reviews also highlight the importance of combining robust preprocessing, normal-behaviour modelling and interpretable indicators for industrial adoption under variable operating conditions [31, 32].
3.4. Baseline RMS-based health indicator for comparison
To highlight the benefit of the proposed maintenance-event-constrained health index, a simple baseline health indicator is constructed directly from the horizontal RMS vibration without operating-condition normalisation. This baseline reflects the common practice of monitoring exceedances of an RMS limit and accumulating them over time.
Let denote the 30-day rolling mean of the measured horizontal RMS vibration velocity, and let be the statistical warning level defined from the baseline healthy phase P1 as the mean plus three standard deviations. The instantaneous exceedance of the RMS warning level is defined as:
Similar to the MEC-HI construction, a moving average is applied to smooth short-term fluctuations:
where is the smoothing window size in hours. The baseline health indicator is then obtained by cumulative integration of the smoothed exceedance:
and is finally normalised to [0, 1] over the whole monitoring period:
For a fair comparison with the MEC-HI, the baseline indicator is reset to zero after the bearing replacement at the end of 2024, but it does not use the operating-condition regression model or the residual-based threshold . Therefore, increases whenever the RMS vibration exceeds its warning level, regardless of whether the increase is caused purely by higher airflow and pressure or by true mechanical degradation. As shown in Section 4.3, this behaviour leads to a strong growth of the baseline indicator during the high-load and ventilation-adjustment phases in 2023, whereas the MEC-HI remains almost flat in these periods and only increases markedly during the confirmed bearing degradation stages.
4. Degradation assessment based on long-term field data
4.1. Long-term vibration and operating conditions
During the monitoring period from December 2022 to November 2025, the main mine ventilation fan experienced pronounced changes in both vibration levels and operating conditions. Based on the operating logs and maintenance records summarised in Table 2, the data can be divided into several characteristic phases, including baseline healthy operation, prolonged high-load operation, ventilation system adjustment, early and severe degradation, and post-maintenance healthy operation. In this subsection the long-term evolution of the conventional RMS vibration indicator and the main SCADA variables is examined as a basis for the subsequent construction of the health index.
The three-year trend of the 30-day RMS horizontal vibration velocity of the fan bearing housing is shown in Fig. 4. In the baseline phase P1 (December 2022-May 2023) the RMS vibration remains at a relatively low and stable level, typically around 1-1.5 mm/s, which is consistent with the absence of reported faults. During the high-load phase P2 and the subsequent ventilation adjustment phase P3, the RMS vibration increases and exhibits frequent peaks, with many periods in which the 30-day RMS exceeds the statistical warning level derived from the baseline stage. At that time no clear mechanical defect was confirmed, suggesting that a considerable portion of the RMS increase is associated with changes in loading and network configuration rather than true damage. In the early and severe degradation phases P4 and P5 in 2024, the RMS level remains elevated and shows more persistent high values, especially in the months directly preceding the bearing replacement. After the replacement at the end of 2024, the RMS vibration drops markedly and stabilises at a lower level in the post-maintenance phase P6, indicating recovery of the mechanical condition.
Fig. 4Three-year trend of 30-day RMS horizontal vibration of the main mine ventilation fan
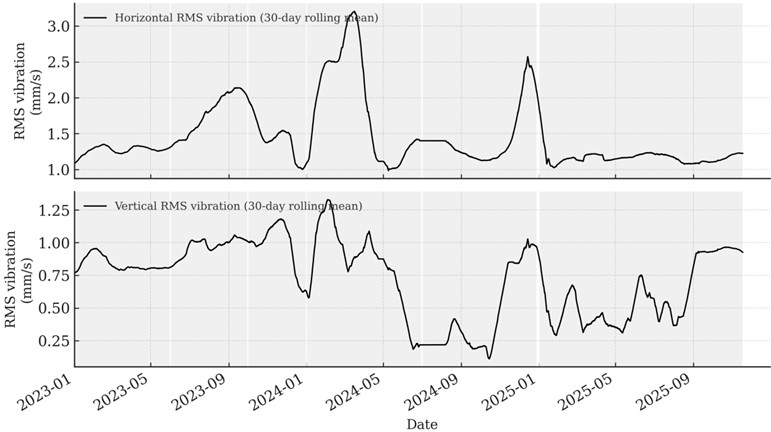
The corresponding long-term evolution of the operating conditions is illustrated in Fig. 5. The airflow rate, inlet pressure and impeller pressure all show a clear increase during the high-load phase P2, reflecting the higher ventilation demand when new stopes and development headings were opened. In the ventilation adjustment phase P3 these variables fluctuate over a wide range as regulators and airways are reconfigured. The motor current, active power and power factor follow a similar pattern, with significantly higher loading in P2-P3 than in the baseline phase and noticeable short-term excursions during network changes. In contrast, the operating variables in the early degradation phase P4 do not show a further systematic increase compared with P2-P3, whereas the RMS vibration remains elevated and becomes more persistent. This behaviour suggests that the additional vibration in 2024 cannot be explained solely by load variations, but is associated with progressive bearing degradation. After the bearing replacement, the fan operates at comparable or even higher airflow and pressure in 2025, while both RMS vibration and electrical loading return to levels similar to or lower than those observed in the initial baseline stage.
Fig. 5Long-term evolution of operating conditions of the main mine ventilation fan (airflow, fan pressures and motor electrical quantities)
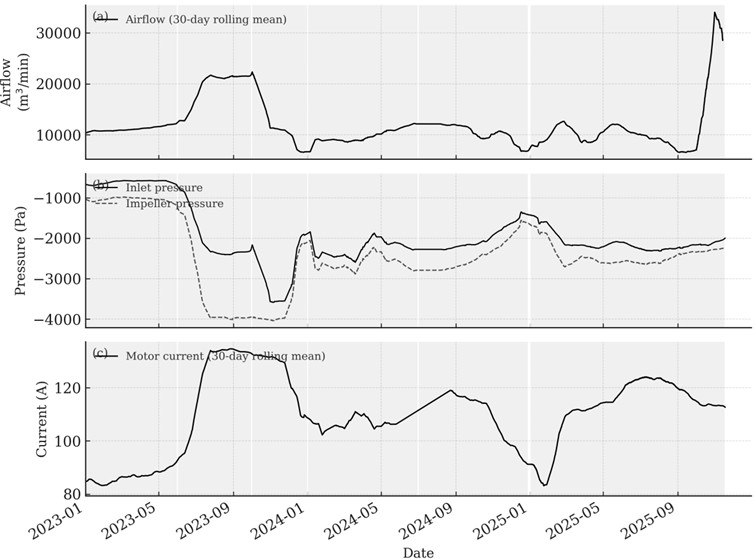
The combined analysis of Figs. 4 and 5 highlights two important features of the main fan operation. First, the conventional RMS vibration indicator is strongly influenced by operating condition, which leads to frequent apparent “over-limit” periods during high-load and ventilation adjustment phases even when no confirmed defect is present. Second, in the 2024 degradation phases the vibration remains high although the operating variables do not increase further, and it drops sharply only after the bearing replacement. These observations motivate the development of a condition-normalised vibration health index that suppresses load-induced fluctuations and better captures the underlying mechanical degradation, as discussed in the following subsections.
4.2. Evolution of the maintenance-event-constrained health index
The maintenance-event-constrained health index (HI) constructed in Section 3 is now applied to the three-year monitoring data of the main mine ventilation fan. Fig. 6 presents the long-term evolution of the normalised HI, together with the operating phases and the bearing replacement at the end of 2024. For clarity, the HI is shown in normalised form, with linear scaling applied within each maintenance segment. Lower values indicate healthier condition and higher values indicate more severe accumulated degradation within the corresponding segment.
Fig. 6Maintenance-event-constrained vibration health index over the monitoring period, with identified operating phases and bearing replacement
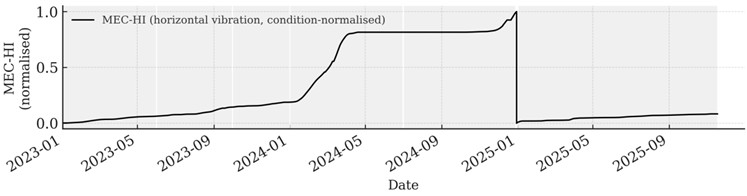
In the baseline healthy phase P1 the HI remains at a low level with only a slight upward drift, consistent with the low and stable RMS vibration and the absence of abnormal observations in this period. During the high-load phase P2 and the ventilation adjustment phase P3, the HI increases gradually but its growth rate is still moderate. This behaviour reflects the influence of prolonged high loading and frequent network changes on the residual vibration, while indicating that the mechanical degradation is still limited. Compared with the strong fluctuations of RMS vibration in the same phases, the HI shows a much smoother and more interpretable trend.
A marked change in the HI evolution occurs in 2024. In the early degradation phase P4 the HI rises much more rapidly than in the preceding phases, indicating that the residual vibration after operating-condition normalisation accumulates at a significantly higher rate. This corresponds to the period in which routine inspections began to report increasing vibration levels under comparable loads and occasional abnormal noise near the drive-end bearing. In the severe degradation phase P5 the HI continues to grow and approaches its maximum value, reflecting sustained high degradation risk. Although the operating conditions in P4–P5 do not differ systematically from those in P2-P3, the HI clearly distinguishes the degradation stages, which supports its use for long-term condition assessment.
The effect of the bearing replacement between 29 and 31 December 2024 is clearly visible in the HI trajectory. Immediately after this major maintenance event, the HI is reset to a low level and then increases only slowly in the post-maintenance phase P6, despite the fact that the fan continues to operate at comparable or even higher airflow and pressure. This confirms that the proposed maintenance-event-constrained formulation can represent both the monotonic accumulation of degradation in each service period and the restoration of health due to major maintenance. Overall, the HI provides a compact and physically interpretable description of the long-term mechanical condition of the main fan under strongly varying operating conditions, and forms the basis for comparison with conventional vibration indicators in the next subsection.
4.3. Comparison with conventional vibration indicators
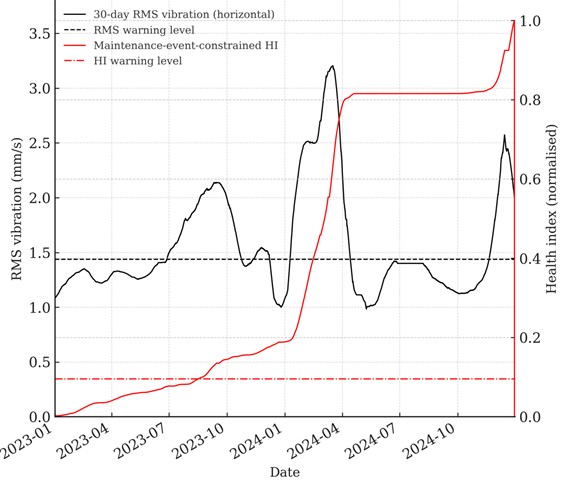
In many mines the condition of main ventilation fans is still assessed mainly on the basis of overall RMS vibration compared with fixed alarm thresholds. To quantify the benefit of the proposed health index, the 30-day RMS horizontal vibration of the fan bearing and the maintenance-event-constrained HI are compared directly over the period from January 2023 to December 2024. For both quantities, a statistical warning level is defined from the baseline healthy phase P1 as the mean plus three standard deviations. The resulting RMS and HI warning levels are then used to mark periods of elevated vibration and degradation risk. Fig. 7 shows the 30-day RMS vibration and the proposed health index together.
As seen in Fig. 7, the RMS vibration reacts strongly to changes in operating conditions.
During the high-load phase P2 and the ventilation adjustment phase P3, the 30-day RMS frequently crosses its warning level and exhibits long periods of apparently over-limit behaviour, even though no confirmed mechanical fault was reported in these phases. This reflects the sensitivity of the RMS indicator to airflow, pressure and motor loading, and makes it difficult to distinguish between benign high-load operation and true degradation. In contrast, the HI remains at relatively low to moderate values in P1-P3 and increases only gradually, indicating that the proposed operating-condition normalisation suppresses a large part of the load-induced variability.
A clear difference between the two indicators emerges in the degradation phases P4 and P5. In 2024 the RMS vibration continues to fluctuate and sometimes drops back toward the warning level, which complicates interpretation under strongly varying operating conditions. The HI, on the other hand, shows a much more consistent upward trend. Its increase in P4 and P5 is significantly larger than in the earlier phases, and it reaches its highest values in the months immediately preceding the bearing replacement. After the replacement at the end of 2024, both RMS and HI decrease, and the HI is reset to a low level and then increases slowly during the post-maintenance phase P6, which agrees well with the engineering judgement of restored bearing health.
Fig. 7Comparison of the 30-day rolling RMS horizontal vibration and the proposed maintenance-event-constrained health index
In addition to the raw RMS trend, the simple baseline HI defined in Section 3.4 was computed. This indicator increases rapidly during the high-load operation and ventilation-adjustment phases in 2023, because the RMS vibration frequently exceeds the warning level under these heavy operating conditions. However, no confirmed bearing damage was reported in this period. In contrast, the MEC-HI remains almost flat in 2023 and starts to grow mainly during the early and severe degradation stages in 2024. This comparison confirms that the operating-condition normalisation and maintenance-event constraints effectively suppress load-induced false alarms and make the proposed index more consistent with the actual degradation behaviour of the main fan.
To summarise these observations in a compact form, Table 3 lists, for each operating phase, the number of hours during which the 30-day RMS exceeds its warning level and the corresponding increase in HI within the same period. In the high-load and ventilation adjustment phases P2 and P3, the RMS exceeds its warning level for a large number of hours, while the HI increase remains modest and comparable to that in the baseline phase, indicating that most RMS exceedances in these phases are related to load rather than degradation. In the early and severe degradation phases P4 and P5, the HI increase is several times larger than in P1-P3, whereas the RMS continues to show frequent exceedances without clear phase separation. In the post-maintenance healthy phase P6 both indicators return to low levels, and the HI increase is again small.
Quantitative comparisons between RMS exceedance hours and HI increments for each phase are given in Table 3.
Table 3Hours with RMS vibration above the warning level and corresponding increase in health index for different operating phases
Operating phase | Period | Hours with RMS above warning level | Increase in HI |
Baseline healthy | 2022-12-01 – 2023-05-31 | 0 | 0.061 |
High-load operation | 2023-06-01 – 2023-08-31 | 1557 | 0.047 |
Ventilation adjustment | 2023-09-01 – 2023-12-31 | 1787 | 0.076 |
Early degradation | 2024-01-01 – 2024-06-30 | 2204 | 0.626 |
Severe degradation | 2024-07-01 – 2024-12-28 | 932 | 0.173 |
Post-maintenance healthy | 2025-03-01 – 2025-09-30 | 0 | 0.051 |
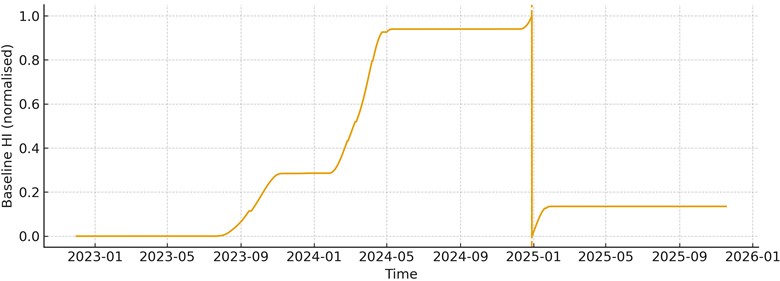
In addition to the raw RMS trend, the simple baseline health indicator , defined in Section 3.4 was also evaluated. This indicator accumulates the exceedance of a fixed RMS warning level without operating-condition normalisation. Its long-term evolution is shown in Fig. 8. It can be seen that the baseline HI grows rapidly already during the high-load phase P2 and the ventilation adjustment phase P3, reflecting the frequent RMS exceedances in these periods even though no confirmed bearing damage was reported. As a result, the baseline HI remains at a relatively high level throughout 2023, making it difficult to distinguish benign high-load operation from genuine degradation. In contrast, the proposed MEC-HI stays almost flat in P1-P3 and increases mainly during the early and severe degradation phases P4 and P5 in 2024. This comparison confirms that operating-condition normalisation and the use of residual-based increments are essential to suppress load-induced false alarms and to obtain a health index that is consistent with the actual degradation behaviour of the main fan.
Fig. 8Long-term evolution of the baseline RMS-based health indicator derived from the 30-day RMS horizontal vibration, with reset at the bearing replacement at the end of 2024
In the present case, the MEC-HI crosses its warning level on 7 February 2024, while the 30-day RMS reaches its warning level already on 24 January 2024. Together with the much higher number of RMS exceedance hours in phases P2 and P3 (Table 3), this confirms that the RMS-based indicators tend to trigger very early but ambiguous alarms driven by operating-condition changes, whereas the MEC-HI provides a long advance warning that is more clearly associated with the documented degradation of the bearing.
Overall, the comparison indicates that the conventional RMS indicator is prone to false alarms when the fan operates under strongly varying load, while the proposed health index provides a more stable and interpretable measure of long-term degradation that is consistent with the known maintenance events and field observations. The HI is therefore better suited as a primary indicator for condition-based maintenance of the main mine ventilation fan, with RMS vibration remaining useful as a complementary indicator for detecting sudden severe faults.
To address the request for indicators beyond RMS while remaining consistent with SCADA-resolution data, we computed simple variability and distribution-shape statistics from the 30-day RMS sequence. The coefficient of variation increases from 0.044 in the baseline phase to 0.389 in the early degradation phase and returns to 0.042 after bearing replacement, consistent with the MEC-HI trend. In addition, an outlier-occurrence analysis on the hourly RMS data identified 131 isolated outliers over 22,097 in-service hours (0.59 %). Replacing these points with the local median changes the phase-wise RMS exceedance hours by at most 2 h and the phase-wise HI increments by at most 0.0018. These checks confirm that the main conclusions are not driven by a small number of extreme points and that RMS-derived sequence statistics can provide complementary evidence when high-rate waveforms (needed for crest factor or waveform kurtosis) are unavailable.
4.4. Early-warning behaviour around bearing replacement
The bearing replacement carried out at the end of 2024 provides an opportunity to examine the early-warning behaviour of the proposed health index in comparison with the conventional RMS indicator. As shown in Fig. 6, the HI exhibits a pronounced increase during the early and severe degradation phases in P4 and P5 and reaches its highest values in the months immediately preceding the planned shutdown. In contrast, the operating variables in Fig. 5 do not show a systematic increase over the same period, indicating that the additional vibration captured by the HI is not simply due to higher load but reflects progressive mechanical degradation of the bearing.
When the statistical warning levels defined in Section 4.3 are taken into account, Fig. 7 reveals a clear difference in the alarm behaviour of RMS and HI. The 30-day RMS vibration crosses its warning level frequently already in the high-load and ventilation adjustment phases, and this pattern continues in 2024, making it difficult to judge from RMS alone whether the risk of bearing failure is actually increasing or the fan is merely operating under temporarily unfavourable conditions. The HI, on the other hand, remains at relatively low to moderate levels in P1-P3 and then attains persistently elevated values throughout the degradation phases in 2024, staying close to or above its warning level in the period before the bearing replacement. This sustained high HI level is consistent with the repeated abnormal observations reported by site engineers and with their decision to replace the bearing during a planned year-end shutdown.
The phase-wise statistics in Table 3 support this interpretation. While the number of hours with RMS above its warning level is already large in the high-load phase P2 and the ventilation adjustment phase P3, the increase in HI in these phases remains limited and comparable to that in the baseline phase P1. In contrast, the HI increase in the early degradation phase P4 is several times larger than in P1–P3, and a further increase is observed in the severe degradation phase P5, even though the RMS exceedance hours do not show a similarly clear phase separation.
Using the warning levels defined in Section 3, the 30-day horizontal RMS first exceeds its warning level LRMS on 24 January 2024, about 339 days before the bearing replacement on 29 December 2024. However, similar RMS exceedances already occur frequently during the high-load and ventilation-adjustment phases in 2023 (Table 3), so it is difficult for engineers to interpret this early crossing as a reliable early-warning signal. In contrast, the proposed MEC-HI remains close to its healthy baseline throughout 2023 and only exceeds its warning level on 7 February 2024, approximately 325 days before the bearing replacement. From that time onwards the MEC-HI increases almost monotonically until the maintenance event, providing a long-term indication of progressive degradation while avoiding the load-induced false alarms observed in the RMS trend.
It should be emphasised that the present analysis is based on a single fan and one documented bearing replacement. The HI is therefore not intended to provide precise remaining useful life predictions, but rather to offer an interpretable long-term degradation measure and a robust early-warning signal under strongly varying operating conditions. Further validation on additional fans and failure cases would be required to quantify the statistical distribution of advance warning times and to calibrate decision thresholds for different mine ventilation systems.
Because SCADA data streams may contain rare spikes due to sensor noise, communication interruptions or short operating transients, the robustness of the proposed indicator was considered explicitly. First, isolated outliers are mitigated at the preprocessing stage using median-based screening and are excluded from regression training and from health-index updates. Second, the MEC-HI uses a tolerance threshold derived from the residual distribution in confirmed healthy phases and applies moving-average smoothing before accumulation; therefore, isolated spikes contribute only limited increments, whereas sustained condition-normalised increases drive the monotonic growth of the index. These design choices reduce the risk that a small number of outliers will trigger misleading degradation interpretation. For applications in which higher-resolution vibration data are available, complementary statistics (e.g., windowed CV and kurtosis) can be monitored alongside MEC-HI to improve sensitivity to impulsive behaviour and to support fault-type discrimination, while still using operating-condition normalisation to suppress load effects [7, 22].
5. Discussion
5.1. Engineering implications for mine ventilation fans
The results obtained in Sections 4 have several practical implications for the monitoring and maintenance of main mine ventilation fans. First, the analysis confirms that conventional RMS-based monitoring can become difficult to interpret when the fan operates under strongly varying operating conditions. In the present case, the 30-day RMS vibration exceeded its statistical warning level for a large number of hours during high-load and ventilation-adjustment phases, although no confirmed mechanical defect was present in these periods. Such frequent apparent “over-limit” events can lead to alarm fatigue and reduce the confidence of ventilation and maintenance engineers in the vibration monitoring system.
The proposed maintenance-event-constrained health index provides a more stable and interpretable representation of long-term degradation under these conditions. By explicitly modelling the dependence of vibration on airflow, pressure and motor electrical quantities, and by accumulating only the positive residual vibration beyond what can be explained by loading, the HI suppresses a large part of the load-induced variability. In the field application, this allows engineers to distinguish between benign periods of high load, in which the HI increases only moderately, and true degradation phases, in which the HI grows rapidly and remains at an elevated level. The clear decrease of the HI after the bearing replacement further supports its use as a tool for validating the effectiveness of major maintenance actions.
From an implementation point of view, the framework is compatible with existing SCADA-based monitoring systems. The variables required for the operating-condition model – airflow, fan pressures, motor current and active power – are already measured in most modern mine ventilation systems. The additional computational burden is limited to a regression model, the calculation of residuals and a simple cumulative update of the HI, which can be implemented as an online function in the SCADA historian or in a separate monitoring server. The warning threshold for the HI can be calibrated using historical data from a known healthy phase in the same way as for RMS, but with the advantage that it is less sensitive to future changes in production intensity or network configuration.
The practical value of MEC-HI extends beyond a single case study: it converts heterogeneous, condition-dependent vibration behaviour into a single, actionable degradation indicator. In a mine, this enables maintenance teams to focus inspections of the fan and bearings when MEC-HI shows sustained growth, to reduce nuisance alarms by separating load-driven RMS excursions from abnormal residual vibration, to document the effectiveness of interventions such as bearing replacement through the post maintenance reset response, and to support risk-based ventilation planning in which fan availability is a safety-critical constraint. Because MEC-HI relies on standard SCADA tags and a lightweight regression model, it can be deployed as an online calculation and scaled across fleets of fans or other rotating assets, supporting the shift from time-based to data driven maintenance in mining and other process industries [32].
In practical terms, the proposed HI is not intended to replace RMS vibration entirely, but rather to complement it. RMS remains valuable as a fast indicator of sudden severe faults and for compliance with existing vibration standards, whereas the HI is better suited for tracking slow degradation and supporting decisions on condition-based bearing replacement. For mines operating large axial-flow fans as the single main exhaust unit, such a combined strategy can improve the reliability of early-warning information, reduce unnecessary alarms during planned high-load operation and help schedule major maintenance at times that minimise production losses and safety risks.
5.2. Generalisation to other rotating machinery
Although the case study in this paper focuses on a single main mine ventilation fan, the proposed framework is not restricted to this specific machine type. Many classes of industrial rotating machinery, such as large axial and centrifugal fans, pumps, compressors and wind turbine drivetrains, operate under time-varying load and are equipped with SCADA systems that record both vibration and key operating variables. In such systems, conventional vibration indicators often suffer from the same difficulty observed in the present application: it is hard to separate load-induced changes from genuine mechanical degradation using RMS thresholds alone. The idea of constructing a condition-normalised health index from residual vibration therefore has broader potential.
To apply the framework to other machines, several elements would need to be adapted. The choice of operating-condition variables in the regression model should reflect the main load drivers of the specific machine, for example flow rate and head for pumps, discharge pressure and compression ratio for compressors, or wind speed, rotor speed and generator power for wind turbines. The training data for the operating-condition model should cover a representative range of healthy operating conditions, and the definition of operating phases and maintenance events should follow the maintenance strategy and logging practice of the target system. In multi-bearing or multi-stage machines, separate health indices could be constructed for different locations, or a combined index could be derived from multiple vibration channels.
At the same time, several limitations need to be acknowledged when generalising the method. The present study uses a relatively simple linear regression model and a single scalar HI, which is appropriate for the available data and the engineering requirement of interpretability, but may not capture strongly nonlinear load–vibration relationships or complex interacting degradation mechanisms in more intricate systems. For machines with very sparse or irregular maintenance records, the incorporation of maintenance events as explicit constraints may also be less straightforward. Therefore, further studies on other types of rotating machinery and larger machine populations would be needed to evaluate the robustness of the framework, to explore the benefit of more flexible operating-condition models and multivariate health indices, and to quantify the variability of early-warning behaviour across different applications.
5.3. Limitations and future work
Several limitations of the present study should be recognised when interpreting the results. First, the analysis is based on a single main mine ventilation fan and one documented bearing replacement. Although the dataset spans nearly three years and covers multiple operating phases, it represents only one machine and one major degradation-maintenance cycle. The observed evolution of the health index and the phase-wise statistics may therefore not be fully representative of other fans or other mines, and no statistical distribution of warning times or failure probabilities can be established from the available data.
Second, the operating-condition model used to normalise the vibration is restricted to a linear regression structure with a fixed set of SCADA variables. This choice is motivated by the need for interpretability and ease of implementation, and it appears sufficient to capture the main load-vibration relationship in the present case. Nevertheless, more complex machines or more strongly nonlinear operating regimes may require more flexible models, for example with nonlinear terms or machine-learning-based regressors. The current framework does not explore such alternatives, and the potential gain in accuracy and robustness remains to be evaluated.
Third, the health index is constructed from a single overall horizontal RMS vibration channel, and the maintenance-event constraint is implemented in a relatively simple way by resetting the cumulative residual at the time of bearing replacement. While this is adequate for illustrating the concept, additional information could be exploited in principle. For example, frequency-band-specific vibration features, vertical vibration, or temperature measurements might help distinguish between different fault modes, and more sophisticated formulations could take into account partial repairs, lubrication events or multiple interacting degradation mechanisms. The present study also relies on engineering judgement and simple statistical rules to select healthy periods and to define warning thresholds, rather than performing a systematic optimisation.
These limitations point to several directions for future work. One line of research is to apply and validate the proposed framework on a larger population of main mine ventilation fans and on other classes of rotating machinery, in order to assess the variability of health index trajectories and early-warning behaviour across different machines and operating environments. Another direction is to investigate more advanced operating-condition models and multivariate health indices that incorporate additional vibration and process features while still retaining sufficient interpretability for field engineers. Finally, with more annotated degradation and failure cases, it would be possible to link the health index quantitatively to remaining useful life through probabilistic models, and to develop decision rules that balance early-warning benefits against the cost of premature maintenance in mine ventilation systems.
6. Conclusions
This paper has presented a degradation assessment framework for a main mine ventilation fan based on long-term field data and a maintenance-event-constrained vibration health index. The case study uses nearly three years of hourly monitoring data from a Howden AMN4240/2000B axial-flow fan serving as the only main exhaust fan in an underground copper mine. The dataset combines bearing vibration measurements with SCADA variables, including airflow, fan pressures and motor electrical quantities, and covers multiple operating phases as well as a documented bearing replacement.
The first contribution is the compilation and analysis of a long-term multi-source dataset for a main mine ventilation fan under strongly varying operating conditions. The data reveal that the fan experiences pronounced changes in load and network configuration associated with production scheduling and ventilation adjustments, and that these changes have a strong impact on conventional RMS vibration indicators. During high-load and ventilation-adjustment phases, the 30-day RMS vibration frequently exceeds a statistical warning level derived from a baseline healthy period, even though no confirmed mechanical fault is present, which highlights the risk of false alarms when RMS is interpreted without explicit consideration of operating conditions.
The second contribution is the development of a condition-normalised vibration health index that explicitly incorporates both operating-condition dependence and maintenance events. An operating-condition regression model is first established to estimate the expected vibration level as a function of airflow, fan pressures and motor electrical quantities. The positive residual vibration beyond this model is then smoothed and accumulated over time, with major maintenance events used to reset the cumulative degradation. The resulting health index provides a compact, monotonic representation of the long-term mechanical condition of the fan, remaining low in the baseline phase, increasing slowly under prolonged high load and network adjustments, rising rapidly during the documented degradation phases in 2024, and dropping sharply after the bearing replacement.
The third contribution is a quantitative comparison between the proposed health index and the conventional RMS indicator in terms of warning behaviour across different operating phases. Phase-wise statistics of RMS exceedance hours and health index increments show that RMS is heavily influenced by load and does not clearly separate benign high-load operation from true degradation, whereas the health index exhibits a much larger increase in the early and severe degradation phases than in the preceding phases and returns to a low-growth regime after maintenance. From an engineering perspective, this suggests that the health index is better suited as a primary indicator for long-term degradation assessment and planning of condition-based bearing replacement, with RMS retaining its role as a complementary indicator for sudden severe faults.
The study is subject to several limitations, including the focus on a single fan and one major bearing replacement, the use of a linear operating-condition model and a scalar health index derived from one vibration channel, and the absence of a probabilistic remaining useful life model. Nevertheless, the results demonstrate that explicitly combining long-term vibration data, SCADA operating variables and maintenance records can substantially improve the interpretability of condition monitoring for main mine ventilation fans. Future work will extend the proposed framework to larger populations of fans and other rotating machinery, investigate more flexible operating-condition models and multivariate health indices, and explore probabilistic links between the health index and maintenance decision-making under uncertainty.
References
-
K. Zhou, X. Lu, C. Yang, Z. Chen, W. Liu, and H. Yan, “Architecture and application of mine ventilation system safety knowledge graph based on Neo4j,” Sustainability, Vol. 17, No. 7, p. 3209, Apr. 2025, https://doi.org/10.3390/su17073209
-
M. Jing, G. Zhang, D. Yang, and H. Qin, “Research on risk identification of coal mine ventilation systems based on HFACS and apriori algorithm,” Advances in Civil Engineering, Vol. 2025, No. 1, May 2025, https://doi.org/10.1155/adce/9579500
-
D. Dramlic, V. Ristic, D. Djukanovic, N. Djokic, and D. Zlatanovic, “Reliability of main fan coal mining plants,” Thermal Science, Vol. 27, No. 1 Part A, pp. 47–59, Jan. 2023, https://doi.org/10.2298/tsci2301047d
-
Y. Xue, J. Wang, and J. Xiao, “Bibliometric analysis and review of mine ventilation literature published between 2010 and 2023,” Heliyon, Vol. 10, No. 4, p. e26133, Feb. 2024, https://doi.org/10.1016/j.heliyon.2024.e26133
-
E. Rusinski, J. Czmochowski, P. Moczko, and D. Pietrusiak, “Monitoring and testing of high power industrial fans vibration,” Procedia Engineering, Vol. 199, pp. 2190–2195, Jan. 2017, https://doi.org/10.1016/j.proeng.2017.09.181
-
“Mechanical vibration-Measurement and evaluation of machine vibration-Part 3: Industrial machinery with a power rating above 15 kW and operating speeds between 120 r/min and 30 000 r/min,” ISO, Geneva, Switzerland, ISO 20816-3:2022, 2022.
-
J. Sim, J. Min, S. Kim, S. W. Lee, and J.-H. Choi, “Construction of bearing health indicator under time-varying operating conditions based on Isolation Forest,” Engineering Applications of Artificial Intelligence, Vol. 126, p. 107058, Nov. 2023, https://doi.org/10.1016/j.engappai.2023.107058
-
M. Rao et al., “A new health indicator for rotating machinery condition monitoring under variable operation conditions through regression among vibration features,” Mechanical Systems and Signal Processing, Vol. 241, p. 113447, Dec. 2025, https://doi.org/10.1016/j.ymssp.2025.113447
-
L. Ma, Z. Li, S. Yang, and J. Wang, “A review on vibration sensor: key parameters, fundamental principles, and recent progress on industrial monitoring applications,” Vibration, Vol. 8, No. 4, p. 56, Sep. 2025, https://doi.org/10.3390/vibration8040056
-
S. Wang, Y. Vidal, and F. Pozo, “Recent advances in wind turbine condition monitoring using SCADA data: A state-of-the-art review,” Reliability Engineering and System Safety, Vol. 267, p. 111838, Mar. 2026, https://doi.org/10.1016/j.ress.2025.111838
-
A. Oliveira-Filho, M. Comeau, J. Cave, C. Nasr, P. Côté, and A. Tahan, “Wind turbine SCADA data imbalance: a review of its impact on health condition analyses and mitigation strategies,” Energies, Vol. 18, No. 1, p. 59, Dec. 2024, https://doi.org/10.3390/en18010059
-
Z. Xu et al., “A novel health indicator for intelligent prediction of rolling bearing remaining useful life based on unsupervised learning model,” Computers and Industrial Engineering, Vol. 176, p. 108999, Feb. 2023, https://doi.org/10.1016/j.cie.2023.108999
-
A. Heng, S. Zhang, A. C. C. Tan, and J. Mathew, “Rotating machinery prognostics: state of the art, challenges and opportunities,” Mechanical Systems and Signal Processing, Vol. 23, No. 3, pp. 724–739, Apr. 2009, https://doi.org/10.1016/j.ymssp.2008.06.009
-
M. H. Mohd Ghazali and W. Rahiman, “Vibration analysis for machine monitoring and diagnosis: a systematic review,” Shock and Vibration, Vol. 2021, No. 1, Sep. 2021, https://doi.org/10.1155/2021/9469318
-
G. R. Sabareesh, H. Mithun Praveen, D. Shah, K. D. Pandey, and I. Vamsi, “PCA based health indicator for remaining useful life prediction of wind turbine gearbox,” Vibroengineering Procedia, Vol. 29, pp. 31–36, Nov. 2019, https://doi.org/10.21595/vp.2019.21161
-
Z. Ye, Q. Zhang, S. Shao, T. Niu, and Y. Zhao, “Rolling bearing health indicator extraction and RUL prediction based on multi-scale convolutional autoencoder,” Applied Sciences, Vol. 12, No. 11, p. 5747, Jun. 2022, https://doi.org/10.3390/app12115747
-
J. Zhou, J. Yang, and Y. Qin, “A systematic overview of health indicator construction methods for rotating machinery,” Engineering Applications of Artificial Intelligence, Vol. 138, p. 109356, Dec. 2024, https://doi.org/10.1016/j.engappai.2024.109356
-
L. Guo, N. Li, F. Jia, Y. Lei, and J. Lin, “A recurrent neural network based health indicator for remaining useful life prediction of bearings,” Neurocomputing, Vol. 240, pp. 98–109, May 2017, https://doi.org/10.1016/j.neucom.2017.02.045
-
Y. Tefera, Q. van Baelen, M. Meire, S. Luca, and P. Karsmakers, “Constraint-guided learning of data-driven health indicator models,” International Journal of Prognostics and Health Management, Vol. 16, No. 2, Aug. 2025, https://doi.org/10.36001/ijphm.2025.v16i2.4268
-
F. Zhang, Z. Wen, D. Liu, J. Jiao, H. Wan, and B. Zeng, “Calculation and analysis of wind turbine health monitoring indicators based on the relationships with SCADA data,” Applied Sciences, Vol. 10, No. 1, p. 410, Jan. 2020, https://doi.org/10.3390/app10010410
-
G. Liu, J. Zhao, H. Li, and X. Zhang, “Bearing degradation assessment based on entropy with time parameter and fuzzy c-means clustering,” Journal of Vibroengineering, Vol. 21, No. 5, pp. 1322–1329, Aug. 2019, https://doi.org/10.21595/jve.2019.20255
-
M. Qiu, W. Li, Z. Zhu, B. Wu, and G. Zhou, “Health monitoring of rolling element bearing using a spectrum searching strategy,” Journal of Vibroengineering, Vol. 19, No. 6, pp. 4231–4246, Sep. 2017, https://doi.org/10.21595/jve.2017.18331
-
C. Chen and L. Liu, “Health assessment of rolling bearings based on multivariate state estimation and reliability analysis,” Applied Sciences, Vol. 15, No. 10, p. 5396, May 2025, https://doi.org/10.3390/app15105396
-
E. Rusiński, P. Moczko, P. Odyjas, and D. Pietrusiak, “Investigation of vibrations of a main centrifugal fan used in mine ventilation,” Archives of Civil and Mechanical Engineering, Vol. 14, No. 4, pp. 569–579, Aug. 2014, https://doi.org/10.1016/j.acme.2014.04.003
-
H. Zhou et al., “Construction of health indicators for condition monitoring of rotating machinery: A review of the research,” Expert Systems with Applications, Vol. 203, p. 117297, Oct. 2022, https://doi.org/10.1016/j.eswa.2022.117297
-
Z. Shen, Z. He, X. Chen, C. Sun, and Z. Liu, “A monotonic degradation assessment index of rolling bearings using fuzzy support vector data description and running time,” Sensors, Vol. 12, No. 8, pp. 10109–10135, Jul. 2012, https://doi.org/10.3390/s120810109
-
X. Zhang, H. Wang, X. Li, S. Gao, K. Guo, and Y. Wei, “Fault diagnosis of mine ventilator bearing based on improved variational mode decomposition and density peak clustering,” Machines, Vol. 11, No. 1, p. 27, Dec. 2022, https://doi.org/10.3390/machines11010027
-
H. P. Jagtap, A. K. Bewoor, and R. Kumar, “Failure analysis of induced draft fan used in a thermal power plant using coordinated condition monitoring approach: A case study,” Engineering Failure Analysis, Vol. 111, p. 104442, Apr. 2020, https://doi.org/10.1016/j.engfailanal.2020.104442
-
R. Muñiz, F. Nuño, J. Díaz, M. González, M. J. Prieto, and Menéndez, “Real-time monitoring solution with vibration analysis for industry 4.0 ventilation systems,” The Journal of Supercomputing, Vol. 79, No. 6, pp. 6203–6227, Nov. 2022, https://doi.org/10.1007/s11227-022-04897-3
-
K. Witaszek and Duss, “The use of wireless vibration sensors to monitor the technical condition of industrial fans,” Diagnostyka, Vol. 26, No. 4, pp. 1–12, Dec. 2025, https://doi.org/10.29354/diag/214933
-
T. Bublil, R. Cohen, R. S. Kenett, and J. Bortman, “Machine health indicators and digital twins,” Sensors, Vol. 25, No. 7, p. 2246, Apr. 2025, https://doi.org/10.3390/s25072246
-
A. Ahmed Murtaza, A. Saher, M. Hamza Zafar, S. Kumayl Raza Moosavi, M. Faisal Aftab, and F. Sanfilippo, “Paradigm shift for predictive maintenance and condition monitoring from Industry 4.0 to Industry 5.0: A systematic review, challenges and case study,” Results in Engineering, Vol. 24, p. 102935, Dec. 2024, https://doi.org/10.1016/j.rineng.2024.102935
-
Z. Tian, X. Huang, F. Xie, X. Wu, J. Ji, and Y. Guo, “Fault diagnosis of mine main ventilator based on multi-eigenvalue selection and data fusion,” Engineering Applications of Artificial Intelligence, Vol. 133, p. 108211, Jul. 2024, https://doi.org/10.1016/j.engappai.2024.108211
-
M. Minervini et al., “Condition monitoring of highway tunnel fans motors: case studies based on experimental data,” Electronics, Vol. 14, No. 24, p. 4809, Dec. 2025, https://doi.org/10.3390/electronics14244809
About this article

This work was supported by Zijin Mining Group Co., Ltd. The authors would like to thank the management and technical staff for their valuable assistance with data collection and field measurements.
The datasets generated during and/or analyzed during the current study are available from the corresponding author on reasonable request.
Xiao Meng: conceptualization, methodology, data analysis, preparation of figures and tables, and writing. Mei Wang: supervision, guidance on methodology, interpretation of results, review and editing.
The authors declare that they have no conflict of interest.
