Abstract
As key equipment in the power system, the operating state of switchgear circuit breakers directly affects power grid reliability. Traditional fault diagnosis methods suffer from complex installation and high susceptibility to interference, while voiceprint diagnosis has become a research hotspot due to its non-contact, high sensitivity and easy deployment. However, the acquisition orientation (angle and distance) of sensors can significantly change voiceprint signal characteristics and reduce diagnostic accuracy. Therefore, this paper takes 10 kV switchgear circuit breakers as the research object, collects opening and closing voiceprint signals at different angles and distances through experiments, and studies the influence of sensor orientation on voiceprint characteristics. Time-frequency analysis shows that the energy of the closing signal is about twice that of the opening signal. Within the range of ±45°, the angle change has little effect on the energy (difference < 8 %), and the 0° orientation has the best signal-to-noise ratio. The angle has no significant effect on the frequency-domain characteristics, but the closing signal has richer high-frequency components. Distance experiments show that the signal energy follows the / attenuation law, and the high-frequency components attenuate faster. Accordingly, this paper proposes a signal compensation method based on energy normalization, which can eliminate the spectrum distortion caused by distance and keep the signal characteristics consistent at different distances. The results provide a theoretical basis for the optimal layout of sensors in circuit breaker voiceprint diagnosis. The proposed compensation method can effectively improve the accuracy of fault diagnosis models and has important engineering application value for power equipment condition monitoring.
1. Introduction
As the key equipment in power system, the operation state of switchgear is directly related to the reliability and safety of power grid. As the core component of switchgear, the normal opening and closing operation of circuit breaker directly affects the stable operation of power system [1]. However, in the long-term operation process, the circuit breaker may fail due to mechanical wear, contact aging or electromagnetic interference. If it is not diagnosed and treated in time, it may lead to equipment damage or even power failure. Therefore, it is of great engineering significance to develop efficient and accurate fault diagnosis methods for circuit breakers.
Traditional circuit breaker fault diagnosis methods mainly rely on vibration signal, current signal or infrared detection [2, 3]. However, these methods often have limitations such as complicated installation, high cost or great environmental interference. In recent years, voiceprint diagnosis technology has gradually become a research hotspot because of its advantages of non-contact, high sensitivity and easy deployment [4]. Voiceprint signal can reflect the information of mechanical vibration, electromagnetic noise and other physical fields in the process of circuit breaker opening and closing, which provides a new idea for fault diagnosis [5]. However, the voiceprint signal is easily influenced by the orientation of sensors (such as angle and distance) in the actual acquisition process, which leads to the change of signal characteristics and further affects the accuracy of the diagnosis model. Therefore, it is very important to study the influence law of azimuth factors on voiceprint signals for improving the reliability of fault diagnosis [6, 7].
Table 1Common mechanical faults and possible causes
Fault location | Failure cause |
Drive system | Insufficient lubrication leads to excessive friction |
Four-link deformation | |
The distance between the four-bar intermediate shaft and the “dead point” is too small | |
Mechanism jamming | |
Opening and closing coil | The coil is burnt or broken |
Coil terminal voltage is too low | |
Iron core motion is blocked | |
Iron core blockage | |
Insufficient stroke of iron core |
In the field of voiceprint signal processing and circuit breaker fault diagnosis, scholars at home and abroad have done a lot of research. The empirical mode decomposition (EMD) method proposed by Huang et al. provides an effective tool for the processing of nonlinear and non-stationary signals, and is widely used in feature extraction of voiceprint signals [8]. In addition, Welch power spectral density estimation and other methods are also used to analyze the frequency domain characteristics of voiceprint signals [9]. In addition, researchers found through experiments that the energy and frequency domain characteristics of voiceprint signals are closely related to the mechanical state of circuit breakers. For example, the energy of closing signals is usually higher than that of opening signals, and high-frequency components can effectively reflect the arcing phenomenon between contacts [10]-[12]. However, the research on circuit breaker voiceprint fault diagnosis at home and abroad focuses on the optimization of signal processing algorithm, feature extraction and model construction under a single fixed working condition, and has not yet involved the systematic influence of sensor acquisition orientation on voiceprint signal, nor has it proposed a targeted azimuth deviation correction method, as shown in Table 2. Especially under different angles and distances, the attenuation law of voiceprint signal, the change of frequency domain characteristics and its influence on fault diagnosis have not been systematically studied.
Table 2Comparison between related research results and research gaps
Research method | Data type | Method advantage | Research blank |
Acoustic fingerprint+VMD+SVM | Voiceprint signal of opening and closing collected in a single fixed direction | Effectively identify typical mechanical faults | The influence of angle and distance on signal characteristics is not analyzed, and there is no signal correction method |
Acoustic signal+wavelet packet+depth confidence network | Fixed distance and fixed angle voiceprint signal | Identify early latent faults | |
Voiceprint feature+ BP neural network | Single working condition simulation and experimental data | The algorithm has fast convergence and high efficiency | |
Voiceprint feature+multiscale fusion+lightweight network | Collecting voiceprint signal in fixed direction | The model is lightweight and suitable for the edge |
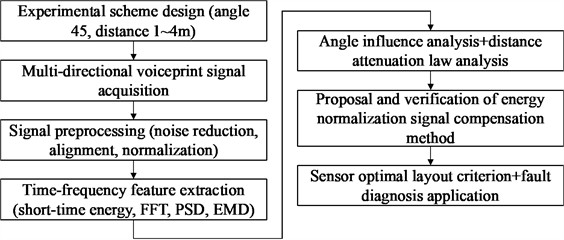
In order to solve the above problems, this paper takes the 10 kV switchgear circuit breaker as the research object, and constructs a brand-new research system from three dimensions: the optimization of acquisition end, the correction of signal end and the application of engineering end, so as to systematically explore the influence of azimuth factors on its voiceprint signal characteristics, and put forward corresponding signal compensation and normalization methods to eliminate the influence of azimuth differences on signals and provide data reference for subsequent fault diagnosis models. The research results are expected to provide new technical means for condition monitoring and fault diagnosis of switchgear circuit breakers and improve the reliability of power supply. The flow of this paper is shown in Fig. 1.
Fig. 1Flowchart of this paper
2. Feature extraction method of voiceprint signal
The empirical mode decomposition (EMD) algorithm flow is shown in Fig. 2. The algorithm mainly deals with nonlinear and non-stationary signals. According to the characteristics of signals in different time scales, the original complex signal is decomposed into several local stationary intrinsic mode functions (IMF) and the superposition of residual terms by continuous iterative decomposition [13]. Each IMF component can reflect the local oscillation characteristics of the signal in a certain frequency band, and actually present the internal structure of the signal itself. This decomposition method transforms non-stationary signals into stationary sub-signals that can be analyzed separately, and has good anti-interference ability in complex noise environment.
Fig. 2EMD algorithm flow chart
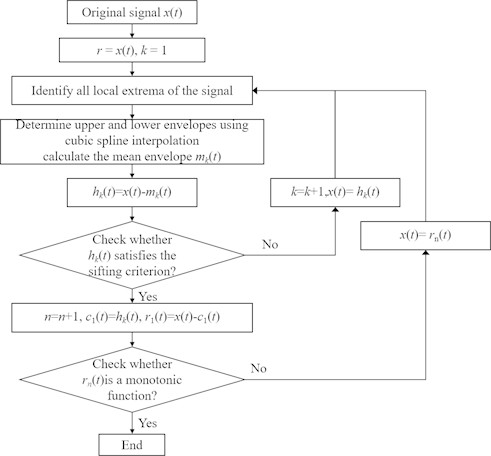
In the whole decomposition process, every IMF obtained must meet two constraints: within the global range of the signal, the number of maximum points and the number of minimum points are equal, or the difference between them will not exceed one; At any given moment, the local average value of the envelope fitted by all extreme points must be zero.
3. Influencing factors and analysis of voiceprint signal
In this section, aiming at the voiceprint signal generated in the process of opening and closing of 10 kV switchgear, several experiments are designed to collect data according to two conditions of different angles and different distances, and the research on preprocessing, feature extraction and law summary is carried out systematically. In order to eliminate the difference of energy attenuation caused by different distances and angles, the signals of other working conditions are normalized according to the average square energy based on the samples of 1 m and 0 working conditions, so as to ensure that the subsequent data of each group are compared at the same energy scale.
3.1. Analysis of voiceprint signals from different angles
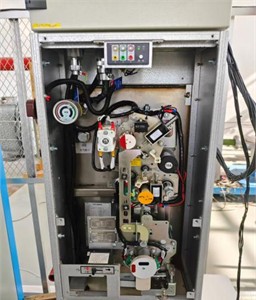
The switch cabinet used in this experiment is shown in Fig. 3. In the experiment, the opening and closing audio frequency was recorded at the angle of 0 and 45 in front of the switch cabinet, with a distance of 1m; And extract the signal of the first 5 seconds after the start of each opening and closing operation to eliminate the environmental noise and non-action parts before and after the start. Unified processing of all signal lengths can eliminate the statistical deviation caused by time difference.
Fig. 3Switch cabinet for experiment
3.1.1. Time domain analysis
In the time domain analysis of signals, short-term energy can reflect the “activity” of signals in a certain time window, which is usually used in audio signal processing, speech recognition and feature extraction [14, 15]. Short-term energy is the signal obtained by filtering the square of voiceprint signal through a window function, and the short-term energy in each window can be expressed as:
where is voiceprint signal, is window function and is window length. If a rectangular window is used, Eq. (1) can be simplified as follows:
Short-term energy directly reflects the total sound intensity of the signal in a certain period of time. The greater the energy, the stronger the sound wave generated by the action of the circuit breaker, which provides a quantitative basis for the difference of sound pressure level between different angles. Calculate the short-term energy of the three-component brake and the normal energy storage signal, and the statistics of the results are shown in Table 3.
Table 3Calculation results of short-term energy of signals at different angles
Angle | –45° | 0° | 45° |
Short-term energy | |||
Switch on and store energy normally | 0.000637 | 0.000601 | 0.000591 |
Separating brake | 0.000281 | 0.000306 | 0.000285 |
As can be seen from the above table, the energy of the closing and energy storage signal is significantly higher than that of the opening signal, and the former is about twice as much as the latter, indicating that the mechanical energy released by the rebound of the energy storage spring and the contact collision is greater than that of the breaker opening process when the switch is opened; The maximum relative difference between opening energy and closing energy in these three angles is only about 8 %, and the maximum relative difference between opening energy and closing energy is about 7 %, which shows that the attenuation of collected acoustic energy is very limited when the acquisition system is arranged within 45, and the main transient characteristics can be retained.
Although the angle difference is small, the opening energy at 0 is the highest, and the signal-to-noise ratio is slightly better. Therefore, in the subsequent online monitoring system, priority should be given to placing the sensor in front of the circuit breaker to obtain a more stable and stronger voiceprint signal.
From the above time domain results, it can be seen that the voiceprint energy of the circuit breaker’s opening and closing action is significantly different, which is highly consistent with the mechanical action process: the closing process includes multiple strong impact events such as energy storage spring release, contact impact and mechanism in place, so the energy is obviously higher. When the angle changes in the range of 45, the energy difference is less than 8 %, which shows that the voiceprint signal of the circuit breaker has good azimuth tolerance in the near field, and effective characteristics can be obtained without strict alignment in field installation. 0 azimuth energy and signal-to-noise ratio are the best, because the proportion of direct sound waves in this direction is the highest and the reflection interference is the smallest, so the opposite arrangement is preferred in engineering.
3.1.2. Frequency domain analysis
Frequency domain analysis can reveal the main frequency component, harmonic structure and energy distribution characteristics of the signal. This section focuses on FFT amplitude spectrum and power spectral density (PSD).
Fast Fourier transform (FFT) maps the time domain signal to the frequency domain, and can decompose the discrete signal with length n into a series of sine and cosine components, thus obtaining the complex frequency domain coefficients of the signal at each frequency [16], and its expression is as follows:
The amplitude spectrum is the modulus of :
The FFT amplitude spectrum mainly shows the instantaneous frequency components and harmonic structure of the signal. Although the instantaneous amplitude information of each frequency point is given, spectrum leakage and fluctuation often occur due to the window function and truncation effect of a single FFT. Power spectral density measures the average power in the unit frequency band of the signal, which reflects the frequency and energy distribution of the signal more smoothly and steadily.
The Welch method estimates PSD by dividing the signal into several overlapping segments, applying a window function to each segment, then calculating the periodogram of each segment, and finally averaging all periodograms to obtain a smooth power spectral density estimation [17]. The equation can be described as Eq. (5):
where is the window function and is the k-th discrete signal. represents the number of segments into which the signal is divided, is the length of each segment, and is the energy normalization factor of the window function, which is calculated as shown in Eq. (6):
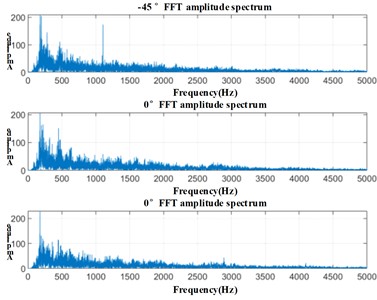
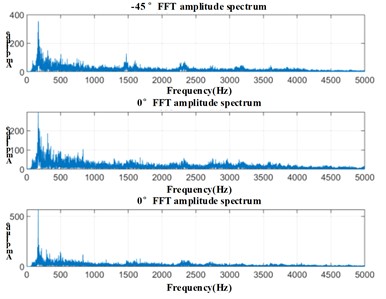
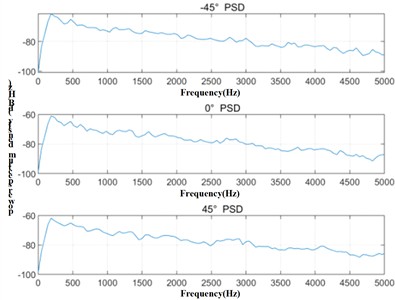
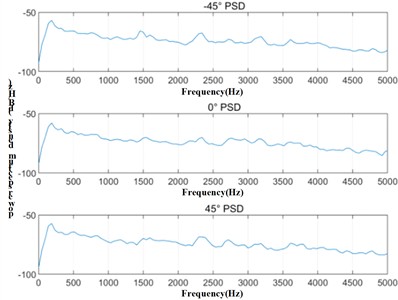
Combining FFT amplitude spectrum with power spectral density, the frequency domain characteristics of voiceprint signal of switch cabinet opening and closing under different working conditions can be presented comprehensively and deeply, which provides rich and reliable feature input for fault diagnosis and machine learning model. The analysis results are shown in Fig. 4 and Fig. 5 respectively.
Fig. 4FFT amplitude spectra of two signals at different angles
a) Break-brake signal
b) Switch on and store energy normally
As can be seen from Fig. 4, the FFT amplitude spectrum of the same type of signal at different angles presents a consistent main frequency peak and its harmonic structure, and the amplitude difference is small; In contrast, the energy distribution of PSD curve in the low frequency band of 0-500 Hz and the high frequency band of 2-5 kHz in Fig. 5 is also coincident, which shows that the sensor angle has little influence on the frequency domain characteristics. The amplitude of the main frequency of the closing signal is about 1.6 times that of the opening, and the PSD energy is improved by 2-4 dB as a whole, and the subharmonic and high-order components are more obvious, reflecting the stronger mechanical impact and electromagnetic interference in the closing process.
Fig. 5PSD of two signals at different angles
a) Break-brake signal
b) Switch on and store energy normally
From the frequency domain results, it can be seen that the acquisition angle has little influence on the main frequency, harmonic structure and energy distribution of the signal in the range of 45, which shows that the angle is not a sensitive influencing factor of voiceprint characteristics. The high-frequency component of closing signal is richer and higher in amplitude, which directly corresponds to the stronger mechanical impact, electromagnetic oscillation and arc effect in closing process. This feature can be used as an important basis for distinguishing working conditions and identifying anomalies in subsequent fault diagnosis models. The results of FFT and PSD confirm each other, which shows that the frequency domain features are stable and reliable, and can be used to extract voiceprint fault features in different directions.
3.2. Analysis of voiceprint signals at different distances
In this section, based on the aligned time domain signals of the tripping events, the influence of the acquisition distance of 1m–4m on the characteristics of voiceprint signals is discussed respectively.
3.2.1. Law of energy attenuation
Under the condition of free field, the sound pressure amplitude of point sound source follows the law of inverse attenuation with propagation distance [18]-[20], as shown in Eq. (7):
Therefore, the acoustic energy (or sound pressure square) should follow the following equation:
where represents the aligned signal sample intercepted at the distance r and N is the sample length. Short-term energy can directly describe the sound pressure power at this distance from the perspective of digital signal, which is proportional to the physical sound pressure level of .
Draw the relationship curve between the short-term energy of the signal and the distance, as shown in Fig. 6.
Fig. 6Law of energy attenuation
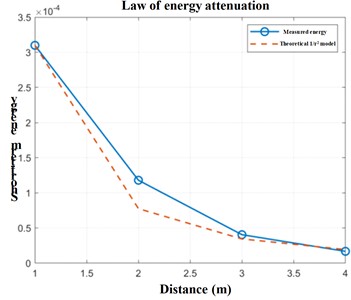
The measured data show that the overall short-term energy shows a downward trend, which is in good agreement with the inverse square attenuation model. There may be two reasons for the deviation: the reflection of sound waves by walls and equipment in the laboratory increases reverberation energy in a long distance, making the measured attenuation slightly slower than the ideal model; The automatic gain effect of equipment may also lead to energy attenuation differences. Although there is a slight deviation, the overall law is still valid in the range of 1-4 m, which can provide reference for the determination of sensor placement in online monitoring system. To obtain purer direct sound characteristics, a shorter transient window or reverberation separation can be used.
3.2.2. Spectrum attenuation law
In open space or weak absorption environment, the propagation of sound waves will not only be attenuated in total amplitude, but also the attenuation rates of different frequency components may be different. In the aspect of frequency domain analysis, this section introduces the frequency band energy ratio to better describe the relative retention of low-frequency and high-frequency components in the propagation process of sound waves, and respectively investigates the energy ratio changes of low-frequency (0-500 Hz) dominated by mechanical noise and high-frequency (2-5 kHz) dominated by electromagnetic noise at different distances.
Let the aligned and intercepted discrete signal (length ) have its unilateral power spectrum:
In the process of opening and closing, the low-frequency impact caused by the contact collision of circuit breaker and the vibration of mechanical connecting rod is mostly concentrated in the range of 100-500 Hz, while the high-frequency components caused by arc discharge and electromagnetic oscillation between contacts are mainly concentrated in the range of 2-5 kHz, so these two typical frequency ranges are selected to analyze the attenuation of low-frequency and high-frequency components. The calculation equations of low-band energy ratio and high-band energy ratio are as follows:
The sum of these two ratios is generally less than 1, which can be used to measure the energy proportion in two typical noise bands: low frequency and high frequency. The curves of -low system and -high with distance are calculated and drawn by using the voiceprint signals of the four distances of 1m, 2m, 3m and 4m, and the results are shown in Fig. 7.
Fig. 7Comparison of frequency band energy retention rate
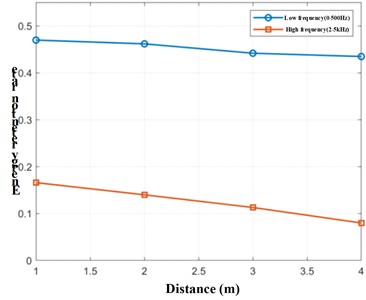
According to the analysis of the processing results, -low and -high both decrease with the distance, while the latter decreases more than the former, which shows that the attenuation speed of high-frequency components is faster than that of low-frequency, and the high-frequency scattering or absorption is more significant.
3.2.3. Signal compensation and normalization method
In acoustics and signal processing, the amplitude of discrete signal is directly proportional to the instantaneous sound pressure , and its energy is directly proportional to the square of sound pressure, as shown in Eq. (12); Therefore, if the whole signal is amplified by a multiple, its energy will be amplified by the square. In order to make the compensated energy exactly equal to the reference energy , Eq. (13) must be satisfied:
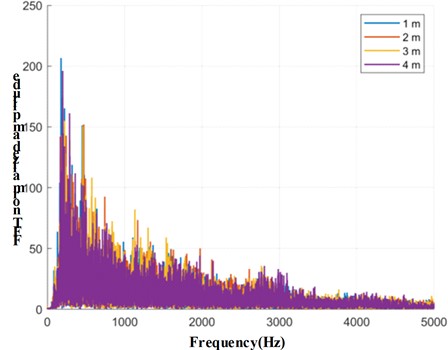
where, is the compensation coefficient, which can pull back the amplitude in proportion to the distance, so that the value is equivalent to the energy at 1 m. Theoretically, after correcting the signal amplitude, the spectrum amplitude of the long-distance signal should be restored to the same level as that of the short-distance sample, and the spectrum shape will not be distorted. In order to verify the compensation effect, the FFT amplitude spectrum is re-measured after multiplying the remote signal by the compensation coefficient, and the result is shown in Fig. 8.
After energy normalization compensation, the frequency spectra of signals with different distances are highly coincident, which proves that this method can effectively eliminate amplitude attenuation and spectrum distortion caused by distance, and only correct energy, without changing the original frequency domain structure of signals and introducing false features. This method has a small amount of calculation and strong real-time performance, and can be directly embedded in online monitoring system to realize real-time correction, which significantly improves the generalization ability and robustness of fault diagnosis models at different installation distances, and provides key technical support for flexible deployment of sensors on site.
Fig. 8Comparison of FFT amplitude spectrum superposition of compensated and normalized distances
4. Conclusions
In this paper, the influence of sensor orientation in voiceprint fault diagnosis of switchgear circuit breaker is studied, and the influence of different angles and distances on voiceprint signal characteristics is analyzed through experiments, and the signal compensation method is put forward, and the following conclusions are obtained:
1) The energy of closing signal is about twice that of opening signal, which reflects the stronger mechanical impact and electromagnetic noise during closing. In the range of 45, the angle change has little influence on the energy of voiceprint signal (the maximum difference is 8 %), but the signal-to-noise ratio of the position directly in front (0°) is slightly better, so it is suggested to choose this orientation to arrange sensors first. Frequency domain analysis shows that the angle change has no significant influence on the main frequency and harmonic structure of the signal, but the high frequency components of the closing signal are richer, which can be used to distinguish different working conditions.
2) In the aspect of distance influence, the energy of voiceprint signal decays approximately with the increase of distance, and the high frequency component decays faster. In order to solve this problem, this paper proposes a signal compensation method based on energy normalization. By adjusting the amplitude of the long-distance signal, its spectral characteristics are consistent with those of the short-distance signal, which effectively eliminates the influence of distance difference on diagnosis. The experimental results show that the compensated signal spectra are highly coincident at different distances, which verifies the effectiveness of this method.
This study provides an important reference for the voiceprint fault diagnosis of switchgear circuit breaker. By optimizing the sensor layout orientation and adopting signal compensation technology, the accuracy and robustness of the diagnosis model can be significantly improved, which provides a new technical means for the condition monitoring of power equipment. In the future, multi-source noise suppression methods in complex environment can be further studied to enhance the applicability of voiceprint diagnosis.
References
-
S. Zhao et al., “Research on fault diagnosis method of circuit breaker based on adaptive weight evidence theory,” (in Chinese), Proceedings of the CSEE, Vol. 37, No. 23, pp. 7040–7046+7096, 2017, https://doi.org/10.13334/j.0258-8013.pcsee.161394
-
X. Wang, “Fault diagnosis of high-voltage vacuum circuit breaker based on vibration signal,” Beijing Jiaotong University, 2010.
-
Y. Guan et al., “Overview of mechanical fault diagnosis methods for high-voltage circuit breakers,” (in Chinese), High Voltage Apparatus, Vol. 54, No. 7, pp. 10–19, 2018, https://doi.org/10.13296/j.1001-1609.hva.2018.07.002
-
X. Xia et al., “Mechanical fault diagnosis method for high-voltage circuit breakers based on acoustic fingerprint analysis,” (in Chinese), High Voltage Apparatus, Vol. 57, No. 10, pp. 66–76, 2021, https://doi.org/10.13296/j.1001-1609.hva.2021.10.009
-
S. Liao et al., “Latent fault identification method of circuit breaker operating mechanism based on acoustic signals,” IET Conference Proceedings, Vol. 2022, No. 5, pp. 755–761, 2022, https://doi.org/10.1049/icp.2022.1284
-
J. Li, “Research on mechanical fault diagnosis of high-voltage circuit breaker based on vibration-acoustic joint analysis,” North China Electric Power University, 2012.
-
F. A. Shah, W. Z. Lone, and A. Y. Tantary, “Short-time quadratic-phase Fourier transform,” Optik, Vol. 245, p. 167689, Jul. 2021, https://doi.org/10.1016/j.ijleo.2021.167689
-
N. Huang et al., “Mechanical fault diagnosis of high voltage circuit breakers based on wavelet time-frequency entropy and one-class support vector machine,” Entropy, Vol. 18, No. 1, pp. 1–17, Dec. 2015, https://doi.org/10.3390/e18010007
-
S. Moritoh and N. Takemoto, “Expressing Hilbert and Riesz transforms in terms of wavelet transforms,” Integral Transforms and Special Functions, Vol. 34, No. 5, pp. 365–370, May 2023, https://doi.org/10.1080/10652469.2022.2126465
-
J. Luo and X. Liu, “Mechanical fault diagnosis method for 10kV distribution network high-voltage circuit breaker based on neural network,” (in Chinese), China High-Tech, No. 16, pp. 117–119, 2024, https://doi.org/10.13535/j.cnki.10-1507/n.2024.16.36
-
S. Wang, Y. Zhou, and Z. Ma, “Research on fault identification of high-voltage circuit breakers with characteristics of voiceprint information,” Scientific Reports, Vol. 14, No. 1, p. 9340, Apr. 2024, https://doi.org/10.1038/s41598-024-59999-0
-
Y. Xu et al., “Partial discharge noise suppression method for transformer based on multi-level threshold in synchrosqueezing domain,” (in Chinese), High Voltage Apparatus, Vol. 57, No. 6, pp. 123–131, 2021, https://doi.org/10.13296/j.1001-1609.hva.2021.06.017
-
M. N. Keshtan and M. Nouri Khajavi, “Bearings fault diagnosis using vibrational signal analysis by EMD method,” Research in Nondestructive Evaluation, Vol. 27, No. 3, pp. 155–174, Jul. 2016, https://doi.org/10.1080/09349847.2015.1103921
-
J. Huang, X. Hu, and F. Yang, “Support vector machine with genetic algorithm for machinery fault diagnosis of high voltage circuit breaker,” Measurement, Vol. 44, No. 6, pp. 1018–1027, Mar. 2011, https://doi.org/10.1016/j.measurement.2011.02.017
-
R. Yan et al., “Fault diagnosis of high-voltage circuit breaker based on EEMD and convolutional neural network,” (in Chinese), High Voltage Apparatus, Vol. 58, No. 4, pp. 213–220, 2022, https://doi.org/10.13296/j.1001-1609.hva.2022.04.029
-
L. Marple, “Computing the discrete-time "analytic" signal via FFT,” IEEE Transactions on Signal Processing, Vol. 47, No. 9, pp. 2600–2603, Aug. 2002, https://doi.org/10.1109/78.782222
-
K. K. Parhi and M. Ayinala, “Low-complexity Welch power spectral density computation,” IEEE Transactions on Circuits and Systems I: Regular Papers, Vol. 61, No. 1, pp. 172–182, Jun. 2013, https://doi.org/10.1109/tcsi.2013.2264711
-
H. C. Peng, F. H. Long, and C. Ding, “Feature selection based on mutual information criteria of max-dependency, max-relevance, and min-redundancy,” IEEE Transactions on Pattern Analysis and Machine Intelligence, Vol. 27, No. 8, pp. 1226–1238, Jun. 2005, https://doi.org/10.1109/tpami.2005.159
-
C. Hong et al., “Fault identification method for distribution network based on improved multi-class support vector machine,” (in Chinese), Journal of Electronic Measurement and Instrumentation, Vol. 33, No. 1, pp. 7–15, 2019, https://doi.org/10.13382/j.jemi.b1801731
-
P. Gao et al., “Protection of HVDC transmission lines based on specific frequency band energy ratio,” Automation of Electric Power Systems, Vol. 46, No. 15, pp. 136–144, 2022.
About this article

This research was funded by the Science and Technology Project of Inner Mongolia Electric Power (Group) Co., Ltd. (2024-4-15).
We are grateful to Han Xuechun for his valuable feedback and discussions. We would also like to thank our members for their constant support and encouragement throughout this research.
The datasets generated during and/or analyzed during the current study are available from the corresponding author on reasonable request.
Gu Guangmin and Zhang Wei performed the measurements; Liu Hao and Zhao Like were involved in planning and supervised the work, Gu Guangmin processed the experimental data, performed the analysis, drafted the manuscript and designed the figures. Zhao Like aided in interpreting the results and worked on the manuscript. All authors discussed the results and commented on the manuscript.
The authors declare that they have no conflict of interest.

