Abstract
To investigate the effects of confining stress on the fracture behavior of rock masses under deep high-stress environments, this study employed stereolithography 3D printing technology to fabricate rock-like specimens featuring Cracked Chevron Notched Brazilian Disc (CCNBD) geometry. Static fracture tests under varying confining stress were conducted using a custom-designed confining stress loading system. The key findings are as follows: 1) Fracture toughness exhibited a linear increase with confining stress. When the confining stress reached 1.168 MPa, the fracture toughness increased to 2.86 times that of the unconfined specimen. 2) Crack propagation paths were influenced by confining stress. Under zero confinement, cracks propagated straight through the specimen. Increasing confining stress caused significant deflection in the crack propagation path. Concurrently, the fractal dimension of the fracture surface showed a positive correlation with increasing confining stress. 3) Confinement constrained lateral deformation and altered fracture characteristics. The presence of confining stress constrained lateral deformation under load. As confining stress increased, the resulting fracture surfaces became progressively rougher, and the corresponding energy release rate of the specimens demonstrated an increasing trend. These research outcomes hold significant theoretical and practical importance for enriching the understanding of fracture mechanisms in deep rock masses subjected to external loads.
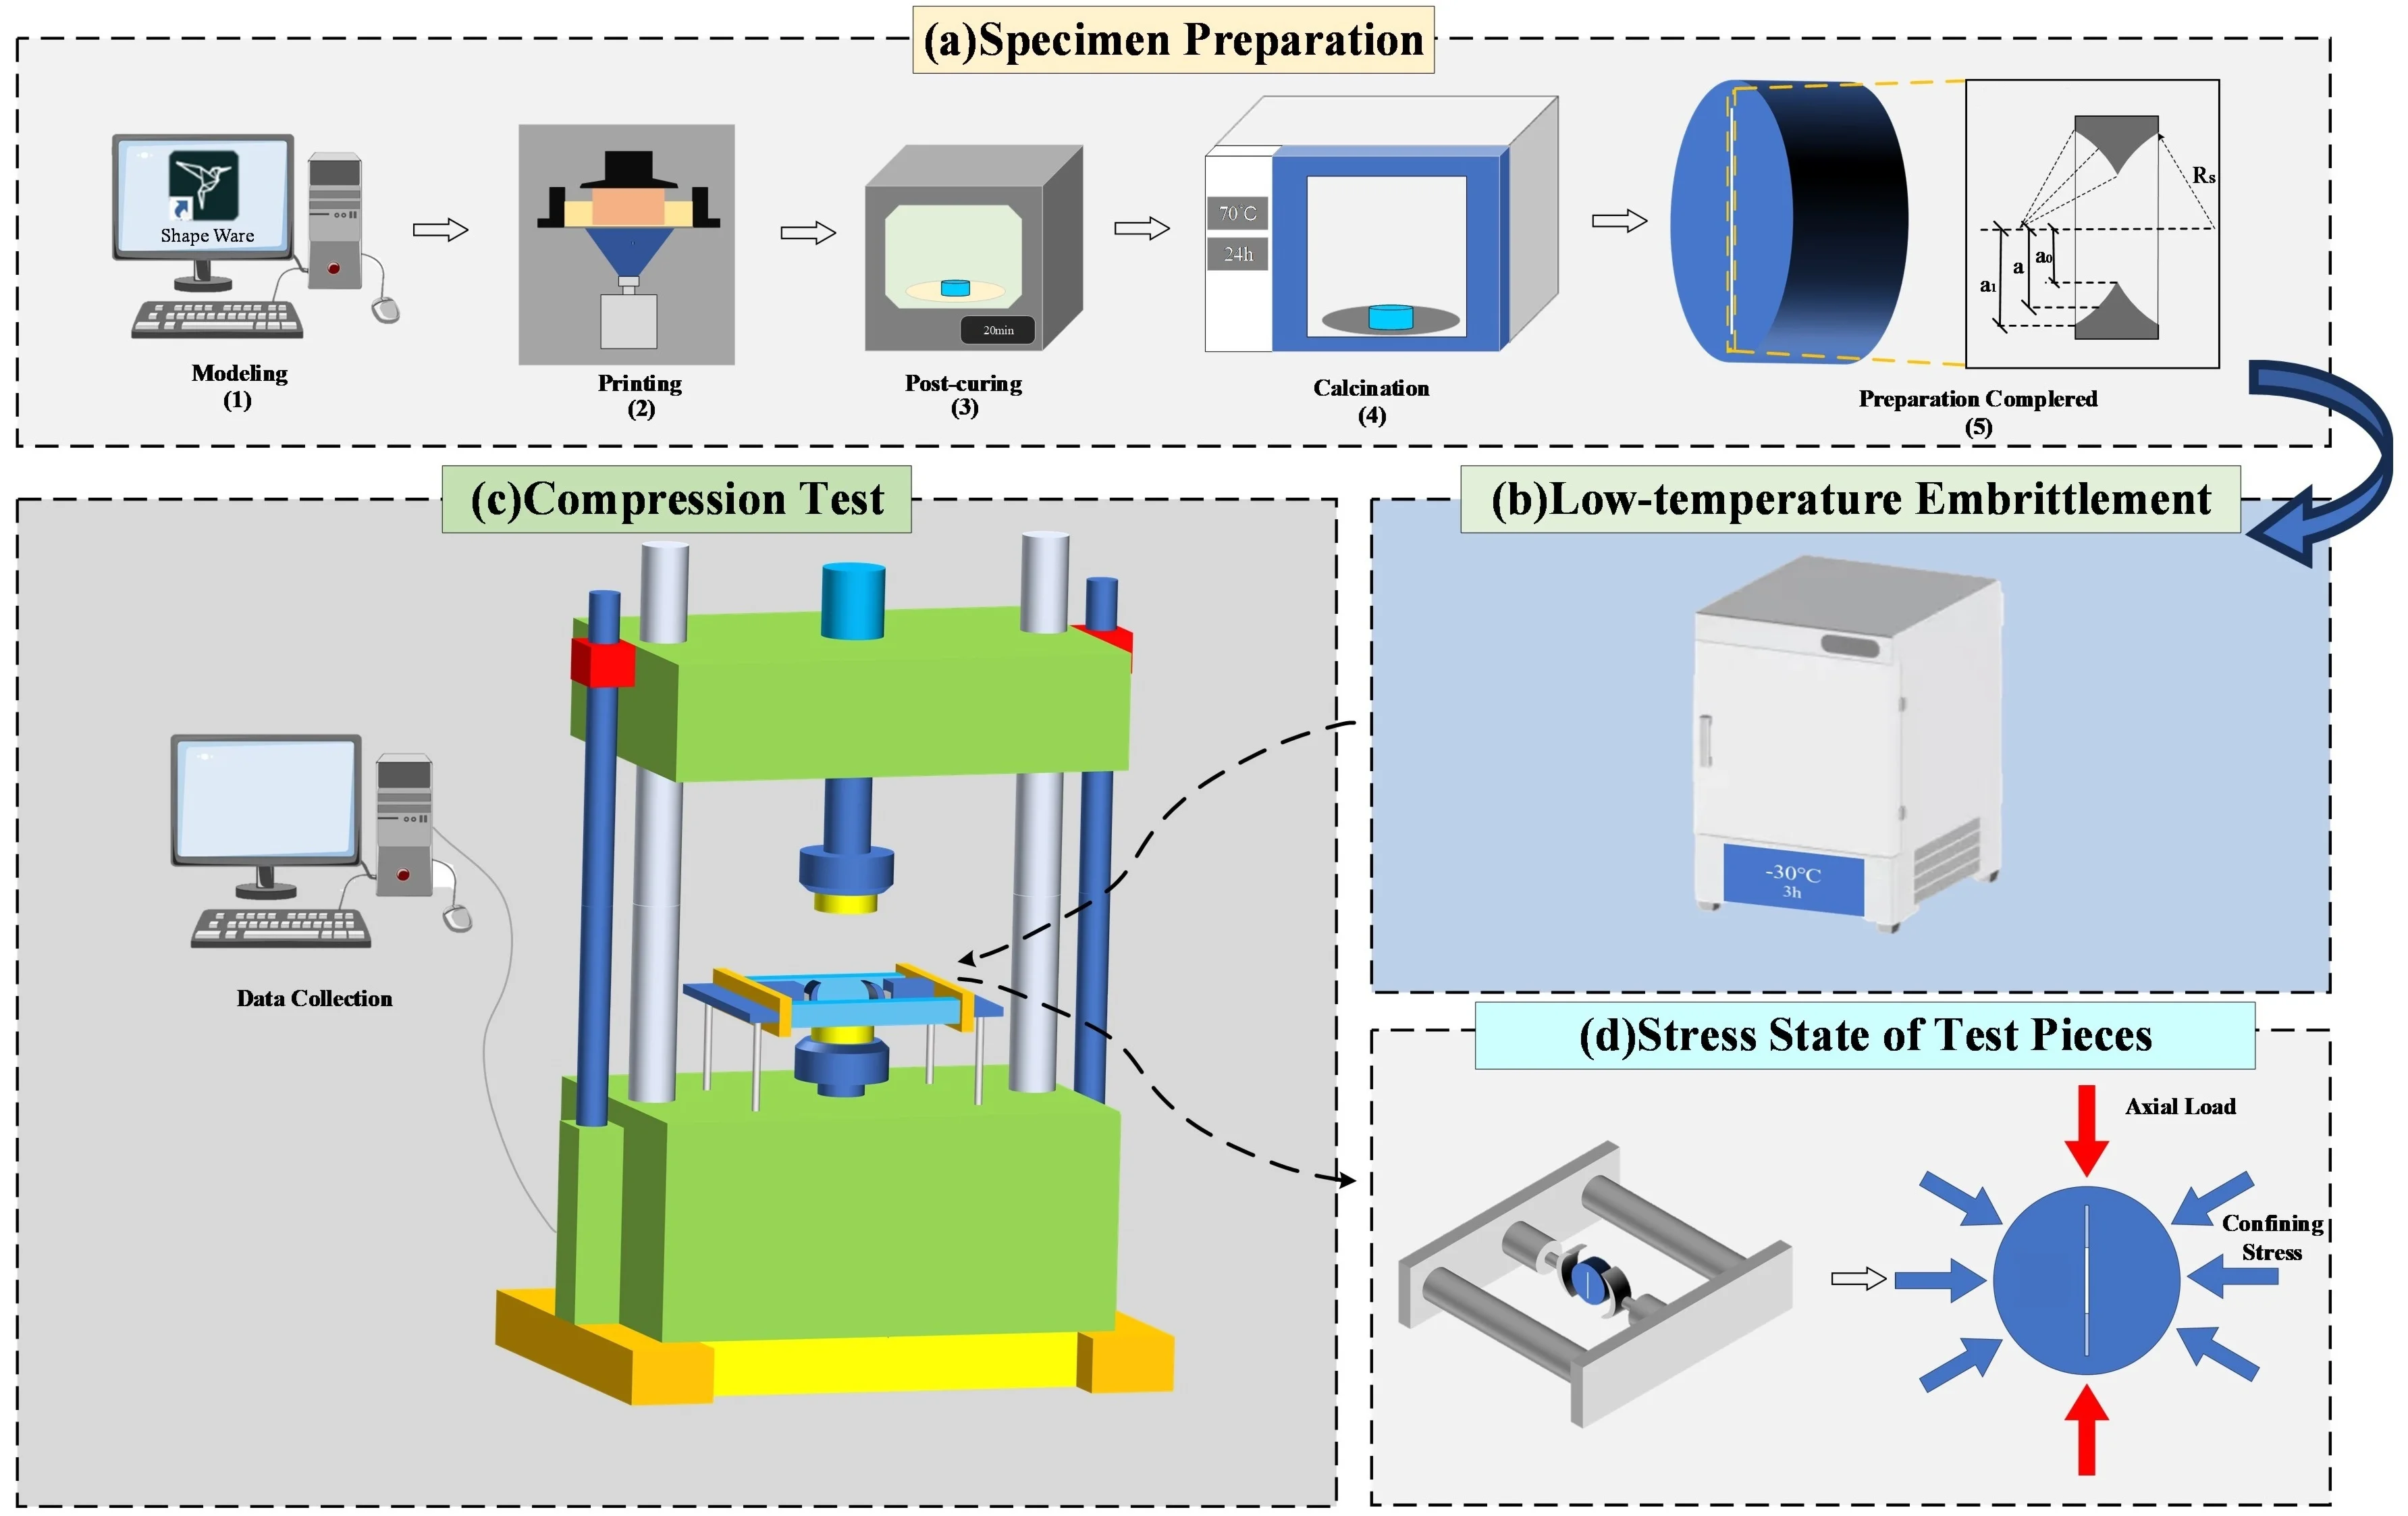
Highlights
- Confining pressure clearly improved the load-bearing capacity of the CCNBD specimens. This indicates that lateral constraint limited the opening of the pre-existing crack and increased the resistance to crack initiation and propagation.
- The fracture toughness increased with increasing confining pressure. Therefore, the measured effective fracture toughness represents the combined effect of material fracture resistance and confining-pressure-induced crack closure.
- Confining pressure changed the crack propagation path and fracture mode. This suggests that the stress state around the crack tip changed under lateral constraint, and the fracture process gradually showed tensile-shear mixed features.
1. Introduction
With the increasing depletion of shallow coal resources, many coal mines in China have begun mining at depths exceeding one thousand meters [1]. In underground rock excavation, in-situ stresses of rock mass gradually vary from shallow layer to great depth with high in-situ stresses [2, 3]. This leads to frequent rock mass instability and disasters in exploitation of deep underground resources and construction of underground space, which are difficult to predict and effectively prevent.
Existing research indicates that rock mass instability often originates from the initiation and propagation of fractures [4]. In recent years, the resilience and fragility assessment of underground structures under complex disturbances has also received increasing attention. Guo et al. [5] studied the seismic fragility of underground structures under stochastic ground motion, providing a useful reference for the safety assessment of underground engineering. To characterize the rock material's resistance to crack propagation, researchers frequently employ rock fracture toughness as a key parameter for assessing rock fracture properties [6, 7]. Therefore, accurately measuring the fracture toughness of deep rocks is crucial for predicting the mechanical behavior of deep rock masses and ensuring engineering safety.
Currently, standardized methods such as NSCB (semi-circular bend) and CCNBD (Cracked Chevron Notched Brazilian Disc) recommended by the International Society for Rock Mechanics (ISRM) are primarily used for rock fracture toughness testing [8, 9]. Among these, the CCNBD specimen is widely employed for Mode I fracture toughness testing due to its well-symmetrical stress field and stable pre-crack propagation. Zhao et al. [10] measured the mode I fracture toughness of a marble using CCNBD specimens. Dai Feng [11] et al. performed mesoscopic damage mechanics simulations on CCNBD specimens to understand their progressive fracture process. Liu [12] et al. carried out dynamic impact tests on CCNBD specimens using a split Hopkinson pressure bar, investigating the effects of impact angles and strain rates on the specimens’ dynamic fracture behavior. Ma [13] et al. employed experimental testing and numerical simulations to study the fracture behavior of CCNBD sandstone specimens under cyclic loading.
However, the traditional preparation of fracture toughness test specimens relies on mechanical cutting or slotting methods, which makes it difficult to accurately control the geometric shape of cracks, and the heterogeneity of natural rocks leads to significant dispersion in the test results [14]. Therefore, many researchers have applied 3D printing technology based on digital modeling and photopolymerization to the preparation of fracture toughness test specimens. For instance, Yu Leilei et al. [15] revealed the control law of crack geometry parameters on fracture toughness by 3D printing NSCB specimens with inclined cracks. Jiang Quan et al. [16] successfully reproduced the crack deflection characteristics of real rocks using gypsum-based printing specimens. Zhou et al. [17] prepared 3D-printed rock samples using five types of raw materials such as ceramics, and conducted uniaxial compression and direct tensile tests. The results showed that photosensitive resin was the best raw material for simulating rocks. Tian Wei [18] et al. studied the effects of crack inclination angle and temperature on the mechanical properties of 3D-printed rock samples. Ju Yang et al. [19] used 3D printing technology to quantitatively characterize and visualize the complex structure and three-dimensional stress field distribution inside underground rock masses. These achievements indicate that 3D printing technology can break through the bottleneck of traditional specimen preparation and provide an effective approach for the study of rock fracture mechanisms.
In terms of material and process selection, existing studies mainly focus on two aspects. One is whether the printing material can reflect the basic failure features of hard and brittle rocks. The other is whether the printing process can meet the forming requirements of cracks, pores, and mesoscopic structures. Niu et al. [20] analyzed photopolymer materials from the aspects of material properties and forming quality. They suggested that photosensitive resin has good performance in fine structure formation and specimen consistency.
At present, common 3D printing methods mainly include FDM, SLA, and DLP. The FDM process has simple equipment and low cost. However, its interlayer interfaces are obvious, and its forming accuracy for fine cracks and complex structures is relatively limited. SLA has high forming accuracy and is suitable for making complex fine structures. DLP can also provide high resolution. At the same time, it has good printing efficiency and good layer consistency [21-22]. Therefore, for CCNBD specimens with pre-existing cracks, DLP light-curing technology is more suitable for keeping the crack geometry and specimen repeatability. It can be used to simulate crack propagation and fracture processes in deep hard and brittle rocks.
Researchers have conducted extensive studies on the fracture toughness, fracture characteristics, and influencing factors of rocks under uniaxial and triaxial confining stress. For instance, B. Mahanta et al. [23] conducted three-point bending tests using notched semi-circular bent shale specimens to investigate the effects of strain rate on fracture toughness and energy release rate of shale, and established a corresponding strain rate function. Navid Ghanbari [24] et al. studied the effect of confining stress on the fracture toughness of cement mortar specimens using the oil pressure loading method. Funatsu [25] et al. found through experiments that the increase in confining stress significantly improves the fracture toughness of clay-bearing rocks. Yan Mingfei [26] et al. studied the effects of confining stress and bedding planes on shale fracture toughness via triaxial compression tests and numerical simulations. These findings have enriched the understanding of rock fracture mechanisms and crack propagation mechanisms under uniaxial and triaxial confining stress. However, in the process of deep rock roadway excavation, the lateral confining stress effect is bound to have an impact on rock fracture and stress distribution at the crack tip, causing the dynamic relationship between lateral confining stress and fracture parameters of deep rock mass, as well as the influence mechanism of lateral confining stress on the fracture characteristics of deep rock mass, to remain unclear. Clearly, existing theories cannot be directly applied to deep mining conditions. Based on the above background, this study employed 3D printing technology to prepare CCNBD specimens, used a self-developed confining stress loading system, and systematically explored the influence of confining stress on rock fracture toughness, crack propagation mode, and energy evolution. The aim of this study is to reveal that the mechanism of the influence of lateral confining stress on the fracture characteristics, and provide theoretical guidance for the stability assessment of deep rock masses and enrich the research on the fracture mechanism of deep rock masses.
2. Experiments
2.1. Test methods for fracture toughness
To meet the needs for studying rock fracture characteristics under different confining pressures, a CCNBD specimen was selected for fracture toughness testing. According to the ISRM recommended method [9], the dimensional parameters of specimens required for tests were determined as shown in Table 1.
Table 1Geometric dimensions for CCNBD specimens
(mm) | (mm) | |||
50 | 25 | 1 | 0.264 | 0.8 |
Note: – diameter; – thickness; – /; – initial chevron notched crack length; – final chevron notched crack length | ||||
As shown in Process 5 of Fig. 2(a), the CCNBD specimen features a pre-existing crack that propagates outward radially from the chevron-shaped tip in a stable manner, ultimately reaching the specimen surface. Correspondingly, the fracture toughness of CCNBD specimen is calculated using Eq. (1) [9]:
where, is Mode I fracture toughness of rock; is the maximum test load; is the dimensionless critical stress intensity factor of specimen, which is calculated by Eq. (2):
where, and are constants determined by and respectively. Here, the corresponding values of = 0.3195 and 1.7009 were obtained using the method described in reference [27].
2.2. Specimen preparation
2.2.1. Principle of 3D printing
This study employed a 3D printer based on digital light processing (DLP) surface exposure ultraviolet (UV) curing (the Shape 1 HD host machine). Its core working mechanism is derived from the photopolymerization reaction characteristics of photo-sensitive resin. When 405 nm blue light irradiates the liquid photo-sensitive resin, the liquid material undergoes a change from liquid to solid state through the photopolymerization reaction.
As shown in Fig. 1(a), Process 2 is a schematic diagram of the structure for a DLP 3D printing system, which includes a printing platform, resin tank (resin material), release film, and DLP UV light machine.
When the printing button is activated, the print platform moves along the -axis downward until it is below the liquid surface. The 405nm light radiation source, based on the pre-processed three-dimensional model data by the software, generates a two-dimensional light field distribution corresponding to the cross-section at the transparent base of the resin tank. When these lights act on the photosensitive resin, the resin forms a cured layer adhesive at the substrate interface, and the DLP light machine performs layer by layer projection curing operation according to the sequence instructions.
Fig. 1Process of preparing rock-like specimens and conducting fracture toughness tests
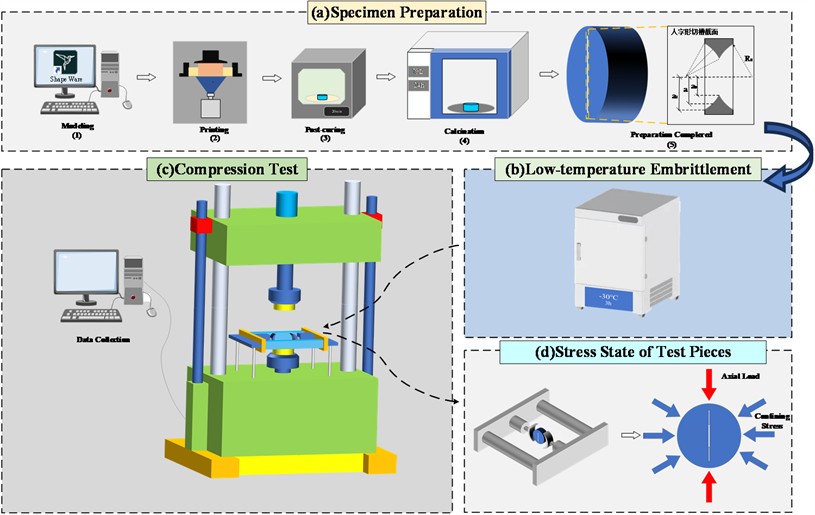
2.2.2. Preparation method
According to the size requirements of specimen for the experiment, a geometric model was established using the SketchUp software and the *.STL format file was exported. The pre-existing crack was directly designed in the three-dimensional model and was formed together with the specimen during DLP printing. It was not produced by mechanical cutting after printing. The designed crack thickness was 1 mm, and the crack penetrated through the specimen thickness. After printing, the pre-existing crack was visually checked to confirm that it was continuous and that no obvious blockage, deformation, or defect existed at the crack edge. Specimens with poor crack quality or obvious crack thickness deviation were not used in the subsequent tests.
The *.STL format file was then input into the printer’s built-in software, Shape Ware, for support editing and slicing processing. Based on the optimization balance between molding quality and manufacturing efficiency, 0.025 mm was ultimately selected as the optimal layer thickness parameter through experimental measurements. As shown in process 1 of Fig. 1(a), the printing platform connects the specimens through tree-like supports. After the printing test, the final top width of tree-like supports was set to 0.5 mm and the top ball diameter to 0.8 mm. Finally, the *.RS file that the printer could recognize was exported.
Before printing the specimen, the resin reservoir was filled with photopolymer material, and a USB flash drive containing model data was inserted into the 3D printer. During printing, the 3D printer read the model data from USB flash drive, the printing button was pressed, and then the DLP system cured each layer based on data until the entire model was printed.
The printed specimens were cleaned of residual resin by immersing them in alcohol, then transferred and irradiated in a high-intensity ultraviolet curing chamber for 20 minutes. Finally, the supporting and connecting surfaces of specimens were sanded smooth using an electric disc sander. To improve the transparency of specimens, the polished specimens were baked in an oven (70 ℃) for 24 hours, after which the specimens changed from dark brown to transparent. The process of specimen preparation is shown in Fig. 1(a).
2.2.3. Strengthening brittleness through low temperature
To ensure that 3D-printed specimens conform to the basic mechanical properties of rocks, the temperature dependence of resin-based organic materials is used to enhance the brittleness of 3D-printed rock-like specimens [28-29], i.e., a low-temperature freezer is used to “embrittle” the printed specimens. The specimens were wrapped in plastic wrap and placed in a low-temperature freezer. The freezer temperature was adjusted to –20 ℃, –30 ℃, and –40 ℃ respectively. After freezing for 3 hours, a uniaxial compressive strength test on specimens was conducted at low temperature. To ensure the reliability of the test results, three repeated tests were carried out under each temperature condition. The specimen resulting with a curve close to the average level was selected for presentation. When the temperature dropped to –40 °C, the printed specimens suffered damage due to the excessively low temperature and cracks appeared. As a result, the specimens lost their load-bearing capacity. The stress-strain curves of specimens at 20 °C, –20 °C and –30 °C are shown in Fig. 2.
Fig. 2Stress-strain curves for 3D-printed specimens under uniaxial compression
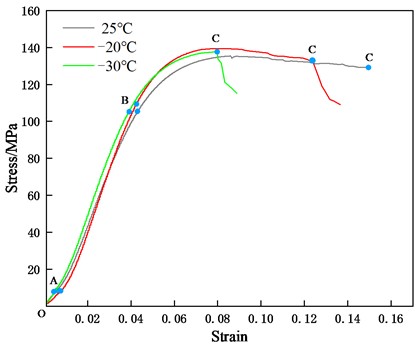
As shown in Fig. 2, the stress-strain curve of specimen can be divided into three stages: the compaction stage (OA), the elastic deformation stage (AB), and the plastic deformation stage (BC). At room temperature, the strain in the plastic deformation stage of specimen is much greater than that in the compaction and elastic deformation stages. In the plastic deformation stage, as the strain of specimen continuously increases, the internal stored energy also keeps increasing, but the specimen has not yet developed cracks. To prevent the occurrence of “bursting” on the specimen, it is unloaded at point C of the stress-strain curve. After unloading, the specimen can still partially recover its deformation. This phenomenon indicates that the printed specimen at room temperature exhibits plastic deformation under compressive load, which is inconsistent with the brittle failure characteristics of rock and cannot be directly used for experimental research on the fracture characteristics of deep rock masses.
When the specimen is subjected to compression at a low temperature of –20 ℃, its stress-strain curve shows a significant difference from that at room temperature. Although the vertical compression deformation is still relatively large, the specimen will experience a sudden decrease in strength. This indicates that the decrease in temperature can enhance the brittleness of printed specimen. When the specimen is subjected to compression at a low temperature of –30 ℃, its stress-strain curve shows a significant downward trend, exhibiting a clear brittle failure mode. This is quite close to the results of Yu [15], based on 3D printing simulation of rock compression fracture, and is consistent with the failure mode of brittle rocks. In summary, after investigation, the optimal freezing temperature for printed specimen was finally determined to be –30 ℃. At this juncture, the elastic modulus of the specimen is determined to be 1.728 GPa through calculation.
Under the condition of –30 ℃, the elastic moduli of the three specimens were 1.728, 1.737, and 1.713 GPa, respectively. The average value was 1.726 GPa, the standard deviation was 0.012 GPa, and the coefficient of variation was 0.70 %. These results indicate that the elastic modulus of the specimens had low dispersion, and the material stiffness after low-temperature treatment showed good repeatability.
It should be noted that the low-temperature treatment used in this study is mainly a temperature-induced physical embrittlement process. It is not an additional curing reaction. Before freezing, the specimens had already been formed by DLP light curing. They were also treated by UV post-curing and oven drying at 70 ℃. The main cross-linked structure of the resin had been basically formed. During the –30 ℃ treatment, no further UV irradiation or high-temperature curing was applied. Therefore, the increase in brittleness mainly comes from the restricted movement of polymer chain segments at low temperature. As the temperature decreases, the photosensitive resin shows a more obvious glassy mechanical behavior. Its plastic deformation capacity decreases, and its failure mode changes from obvious plastic deformation at room temperature to brittle failure at low temperature.
However, the photosensitive resin specimens after low-temperature embrittlement still cannot be fully regarded as natural rock. The mechanical properties of natural rock are affected by mineral grains, pores, microcracks, and cementation. In contrast, photosensitive resin is a polymer-based rock-like material. It still has temperature sensitivity and some viscoelastic behavior. Therefore, the mechanical parameters obtained in this study are mainly suitable for the analysis of crack propagation and fracture behavior under the controlled condition of −30 ℃. They cannot directly represent the long-term stable mechanical properties of natural rock. In future work, DSC, DMA, FTIR, and room-temperature recovery tests can be used to further examine the molecular structure change and stability of the material.
2.3. Test scheme
To simulate the in-situ stress environment present in deep rock masses, the self-developed Brazilian disc stress loading system was utilized to provide the required confining stress values for CCNBD specimens. As shown in Fig. 1(d), the device consists of a hydraulic control system and a stress platform. The hydraulic control system uses a hydraulic station with a rated power of 5 MPa and an ultimate power of 7 MPa, and the piston area of a single cylinder is 314.16 mm2. Based on specimen dimensions of Ø50 mm×25 mm (diameter × thickness) and the corresponding central symmetry plane dimensions of 50 mm×25 mm, the application of this device can achieve a rated load concentration of 1.43 MPa and an ultimate load concentration of 2 MPa inside the specimen, meeting the condition of uniform stress field within the specimen.
It should be noted that the hydraulic loading pressure in Table 2 is not equal to the confining pressure directly applied to the side surface of the specimen. Therefore, the confining pressure acting on the side surface of the specimen should be converted according to the piston area and the loaded area of the specimen. The calculation formula is as follows:
where is the lateral confining pressure of the specimen, is the hydraulic loading pressure, is the piston area of the hydraulic cylinder, and is the lateral loaded area of the specimen.
Based on the confining stress design method in reference [30], the design values for confining stress loading on rock mass in the tests are ranging from 0 MPa to 1.168 MPa. The detailed loading scheme is shown in Table 2.
Table 2Loading scheme for confining stress
Specimen number | Confining stress design / MPa | Hydraulic loading pressure / MPa | Number of test blocks |
WY-0 | 0.000 | 0.00 | 3 |
WY-1 | 0.300 | 1.19 | 3 |
WY-2 | 0.743 | 2.95 | 3 |
WY-3 | 1.168 | 4.64 | 3 |
As shown in Fig. 1(c), the confining pressure loading system was fixed on the platform of the hydraulic servo rigid testing machine during the test. The height of the test platform and the position of the loading system were adjusted to align the specimen with the center of the testing machine and ensure full contact with the loading ends. After the specimen was installed, initial confining pressures of 0, 0.300, 0.743, and 1.168 MPa were applied. Then, the main oil source was started and connected to the control system. Under axial position control, the upper loading head was slowly moved downward, and the axial load was applied to the specimen. The axial loading rate was 0.2 kN/s. During the test, the data acquisition system automatically recorded the load, displacement, and other mechanical data.
It should be noted that the maximum confining pressure in this study is 1.168 MPa. This value is lower than the in-situ stress level commonly found in deep mining sites. This pressure range is not used to directly represent the actual in-situ stress of rock masses at a depth of 1000 m. It was determined based on the strength of the 3D-printed photosensitive resin material, the size of the CCNBD specimen, the capacity of the loading device, and the need for stable crack propagation. If a confining pressure of tens of MPa is directly applied, the specimen may be crushed before the formal loading stage. Boundary damage or early closure of the pre-existing crack may also occur. These problems would affect the fracture toughness test results. Therefore, a confining pressure range of 0–1.168 MPa was used in this study. This range was mainly used to form different lateral constraint levels under controlled test conditions. It was used to analyze the effects of confining pressure on fracture load, fracture toughness, crack path, and energy release characteristics.
The results of this study cannot be directly scaled up to high in-situ stress conditions in deep engineering. Their engineering significance is mainly to show that stronger lateral constraint can increase crack propagation resistance, make the crack path more complex, and require more energy during fracture. For actual deep rock masses, high-confining-pressure fracture tests on natural rocks and numerical simulations are still needed. These methods can be used to further calibrate the fracture toughness parameters and the relationship between confining pressure and fracture behavior.
3. Results and analysis
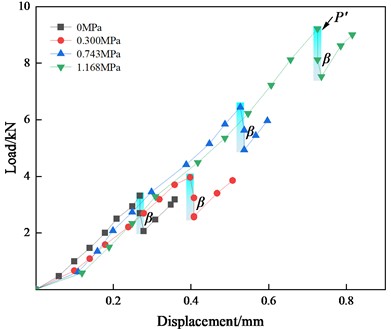
By conducting compression tests on CCNBD specimens under different confining stress, the load-displacement curves were obtained as shown in Fig. 3(a).
Fig. 3Load-displacement curves of specimen under various stress
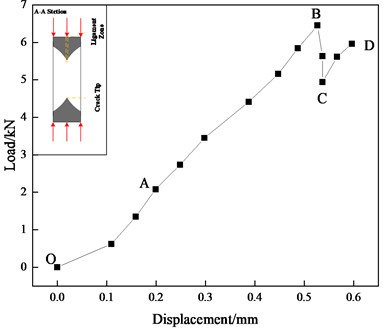
a) Single specimen
b) Multiple groups of specimens
As shown in Fig. 3(a), the load-displacement curve generally exhibits a characteristic pattern of initially rising, then rapidly decreasing, and subsequently increasing again. This phenomenon occurs because the specimen experiences axial compression deformation under load. At this stage, the two semicircular discs formed along the main crack cannot fully separate laterally. The fractured portions can continue to bear the load, leading to an initial increase followed by a decrease in load-bearing capacity. The compression load-displacement curve of CCNBD specimens under confining stress is roughly divided into four stages.
(1) OA stage: Nonlinear compaction and micro-crack initiation. In this stage, the load increases nonlinearly, mainly due to the closure of initial voids/micro-defects and structural compaction within the specimen. During this process, micro-cracks begin to initiate at the tip of the preformed chevron-shaped crack.
(2) AB stage: Linear elastic deformation. In this stage, the testing machine steadily applies the load, and the specimen continuously accumulates energy, causing the micro-cracks at the tip of chevron-shaped cut crack to continuously accumulate and propagate. At this time, the load-displacement curve of the specimen generally follows a linear trend, indicating the linear elastic extension deformation of micro-cracks in the specimen. This stage of curve reflects the stable propagation process of micro-cracks.
(3) BC stage: Instability propagation and coalescence of main crack. When the stress intensity factor at the crack tip reaches the material's fracture toughness , the main crack enters the stage of unstable propagation. Under this condition, the crack rapidly extends along the direction of maximum tensile stress or along its original path until it completely traverses the entire ligament region, resulting in a sharp reduction in the load-bearing cross-section. This process corresponds to the sharp drop segment on the load-displacement curve, representing the rapid release of fracture energy, accompanied by a sudden decrease in the specimen's load-bearing capacity.
(4) CD stage: Secondary crack evolution and residual load-bearing capacity. After the main crack coalesces, the curve exhibits an “inverted bend” (load recovery), indicating the specimen retains residual load-bearing capacity. This stage is accompanied by the initiation and propagation of secondary cracks (such as shear cracks or wing cracks) in the end area of specimen until final failure.
It should be noted here that the “reverse bend” phenomenon of load-displacement curve of CCNBD specimen in Fig. 3(a) actually reflects the load-bearing capacity of the specimen after splitting into two halves. Combining Fig. 3(b), it can be observed that after reaching the peak load under compression, the specimen's load drops to a minimum point, then the load-displacement curve continues to rise under confining stress. The difference between the peak load and the minimum load is recorded as the drop load . The angle between the “reverse bend” curve and the vertical direction is denoted as the inclination angle of residual bearing stage. Based on the measurement result shown in Fig. 3, the peak drop load () and the inclination angle of specimen can be calculated, and their variations with confining stress are illustrated in Fig. 4.
Fig. 4Variation of P' and β with confining stress
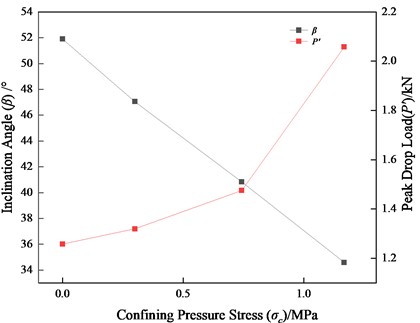
From Fig. 4, it can be seen that as the confining stress increases, the drop load on load-displacement curve continues to increase. This is because under the constraint of confining stress, the load-bearing capacity of specimen increases with the increase of confining stress, and the accumulated energy also increases accordingly. When a local stress intensity at a crack tip exceeds the material's fracture toughness, it will release energy instantaneously. The energy released at this time will also increase with the increase of confining stress, which is manifested as the drop load continuously increasing. At the same time, as the confining stress increases, the residual bearing capacity of specimen after failure also increases, that is, the secondary inclination angle decreases continuously under the same displacement conditions. This phenomenon indicates that under the same deformation, a high confining stress enables the specimen to accumulate higher elastic energy.
3.1. Fracture load of specimen
As can be seen from Fig. 3(b), when the main crack of a specimen reaches its critical state, i.e., it becomes unstable, the load-displacement curve of the specimen presents a steep decline pattern. The load corresponding to this state may be called fracture load. At this state, obvious brittle fracture sound could be heard during the test, confirming that the specimens exhibit typical brittle failure characteristics. As the confining stress increases, the fracture load of the specimen increases from 3350 N to 9590 N, and the peak displacement increases from 0.268 mm to 0.726 mm. Both are increased by 186 % and 171 % respectively with the increase of confining stress, indicating that the confining stress has a dual inhibitory effect on crack propagation. This phenomenon reveals the strengthening effect of confining stress on fracture strength: the greater the confining stress, the more significant the enhancement of deep rock fracture resistance. Specifically, under the condition of the highest initial stress (1.168 MPa), the average fracture load (9590 N) and average peak displacement (0.726 mm) of CCNBD specimen reached 2.86 times and 2.71 times the average value of unconfined specimen, respectively. This means that the specimens with the confining stress can store more elastic energy [31].
To further characterize the relationship between fracture load and confining stress of specimen, a load-confining stress relationship diagram is plotted as shown in Fig. 5.
Fig. 5Relationship between load-confining stress
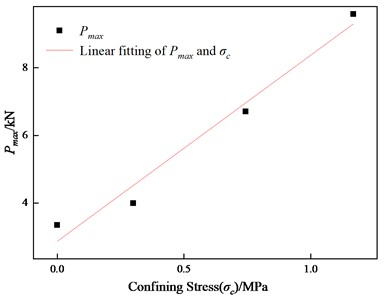
Based on the experimental results shown in Fig. 3(b), a linear fitting was conducted on the relationship between the fracture load and confining stress of specimen, resulting in the following equation:
where, represents the fracture load of specimen, and represents the confining stress. The correlation coefficient is greater than 0.95, indicating a good linear relationship between the maximum load and confining stress of specimen.
In summary, the bearing capacity and peak displacement of CCNBD specimens are significantly positively correlated with the magnitude of confining pressure they are subjected to. Specifically, the confining stress linearly enhances the fracture strength and deformation of the specimen. Meanwhile, although the confining strengthens the fracture resistance of materials, the higher elastic energy storage induced by it may also increase the rockburst tendency of deep rock masses.
3.2. Fracture toughness of specimen
The fracture toughness of rock () reflects their resistance to crack propagation [32]. When the specimen is subjected to confining stress, the rock's resistance to crack propagation increases, and the increment of rock fracture toughness caused by confining stress is referred to as . Simultaneously, the superposition of fracture toughness of rock () and the increment of rock fracture toughness () caused by confining stress is referred to as the effective fracture toughness of rock ().
Based on relevant literature [24, 26], the fracture toughness of specimen under zero confining stress () and the effective fracture toughness under confining pressure () were calculated using Eq. (1). The increment in rock fracture toughness () is then given by .
The detailed calculation results for three fracture toughness values are shown in Table 3.
The fracture toughness calculation results in Table 3 show that of CCNBD specimens exhibits a significant confining stress effect. The average without confining stress is 0.747 MPa·m1/2, while the average of specimens under confining stress shows a positive growth trend with the increase of confining stress (up to 2.138 MPa·m1/2, = 1.168 MPa), indicating the strengthening effect of stress confinement on the resistance of crack propagation. To further reveal the law of fracture toughness changing with confining stress, the relationship between fracture toughness and confining stress is plotted as shown in Fig. 6.
Table 3Fracture toughness of CCNBD specimens under different confining stress
Specimen number | (MPa) | (kN) | (MPa·m1/2) | (MPa·m1/2) | (MPa·m1/2) | Average (MPa·m1/2) |
WY-0-1 | 0 | 3.61 | 0.805 | 0 | 0.805 | 0.747 |
WY-0-2 | 0 | 3.32 | 0.740 | 0 | 0.740 | |
WY-0-3 | 0 | 3.125 | 0.697 | 0 | 0.697 | |
WY-1-1 | 0.300 | 4.01 | 0.747 | 0.146 | 0.893 | 0.885 |
WY-1-2 | 0.300 | 3.965 | 0.747 | 0.136 | 0.883 | |
WY-1-3 | 0.300 | 3.95 | 0.747 | 0.133 | 0.880 | |
WY-2-1 | 0.743 | 6.45 | 0.747 | 0.69 | 1.437 | 1.485 |
WY-2-2 | 0.743 | 6.825 | 0.747 | 0.774 | 1.521 | |
WY-2-3 | 0.743 | 6.71 | 0.747 | 0.749 | 1.496 | |
WY-3-1 | 1.168 | 9.23 | 0.747 | 1.31 | 2.057 | 2.138 |
WY-3-2 | 1.168 | 9.955 | 0.747 | 1.471 | 2.218 | |
WY-3-3 | 1.168 | 9.60 | 0.747 | 1.393 | 2.140 | |
Note: – confining stress; WY-0-1 represent the first specimen with 0 MPa confining stress | ||||||
Fig. 6Relationship between fracture toughness and confining stress
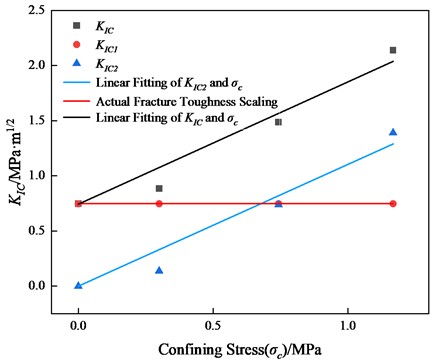
As shown in Fig. 6, the fracture toughness of specimen ( and ) increases linearly with the increase of confining stress. This trend reveals the mechanism of rock mass strengthening dominated by in-situ stress constraints. When the confining tress exceeds 0.705 MPa, the contribution of confining stress to toughness () exceeds the fracture toughness of rock (), demonstrating that the fracture behavior of deep rock masses has a significant strength characteristic dependent on stress state. This strengthening law can provide critical parameters for the design on deep rock engineering. A linear fit of the relationship between fracture toughness and confining stress yields the following equation:
where, represents the effective fracture toughness of rock; represents the increment of rock fracture toughness caused by confining stress, and represents the confining stress.
3.3. Fracture characteristics of specimens
3.3.1. Crack propagation characteristics
Reference [33] indicates that the physical mechanism of crack propagation originates from the energy release in the stress concentration areas within the material. During the experiment, it was found that the fracture of CCNBD specimen under uniaxial compressive load began at the tip of a pre-existing crack and was accompanied by sound. Without confining stress, when the specimen cracked, the crack propagated rapidly until the specimen failed (Fig. 7(a)). However, under confining stress, as the confining stress increased, the crack propagation speed significantly slowed down when it reached the edge of the specimen. And the propagation mode changed from rapid penetration to first rapidly breaking the tip and then slowly developing through (Figs. 7(b-d)). This phenomenon can be attributed to the constraint effect of initial stress (confining stress). The confining stress inhibited the free propagation of the crack, causing its propagation to slow down in the edge area.
Fig. 7Macroscopic fracture failure mode of CCNBD specimens
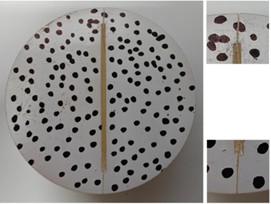
a) 0 MPa
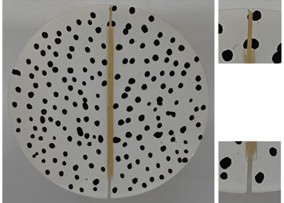
b) 0.3 MPa
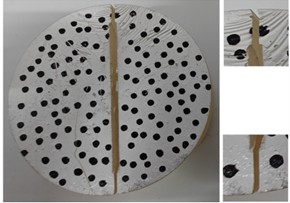
c) 0.743 MPa
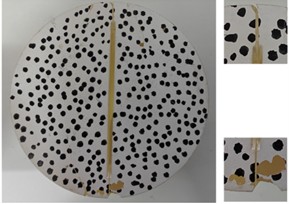
d) 1.168 MPa
To quantitatively characterize the crack propagation path, the crack propagation morphology on the surface of specimen in Fig. 7 was binarized using IMAGE J software, resulting in the crack propagation path shown in Fig. 8.
Fig. 8Binary-processed of main crack propagation path

a) 0 MPa

b) 0.3 MPa

c) 0.743 MPa

d) 1.168 MPa
From Fig. 8, it can be clearly seen that as the confining stress increases, the surface morphology of crack gradually evolves from a straight line under low stress conditions to a combination of straight lines and polylines under high stress conditions. Based on the theory of fracture mechanics, under the compressive load of the Brazilian splitting test, the CCNBD specimen generates a significant transverse tensile stress field in the pre-existing crack tip area due to stress concentration effect. When this tensile stress exceeds the material’s tensile strength, the crack tip becomes unstable, and the typical tensile failure dominates the fracture process. Under the conditions of no confining stress and low confining stress, the specimen exhibits pure tensile fracture after cracking along the crack tip. However, under medium and high confining stress conditions, when the crack extends vertically to the edge of specimen, the fracture mode changes from tensile failure to tensile-shear composite failure.
According to references [34-35], the failure mode of specimen is influenced by both the specimen itself and the confining stress. At high confining stress, the failure mode of specimen gradually becomes dominated by the confining stress for crack propagation. Under higher confining stress constraints, the specimen is subjected to a non-uniform stress field of axial compression, lateral tension, and lateral restraint. Its failure mode changes from tensile fracture under no confining stress to shear fracture.
Based on the above description, the deflection of main crack path on the specimen in this study is the result of three stresses (compression, tension, and constraint) acting on the edge of specimen simultaneously. That is, the edge area of specimen tends to be compacted due to the vertical pressure from the loading system, while also bearing the transverse tensile stress converted from this pressure and the constraint stress provided by confining stress loading device. Under the combined action of multiple stresses, the stress field at the edge of specimen is in a non-uniform state, causing cracks to eventually propagate obliquely.
3.3.2. Fractal dimension of cracks
The fractal dimension () of cracks reflects the effectiveness of a complex shape in occupying space, and it is a measure on the irregularity of complex shape. The box counting dimension method [32] is now used to calculate fractal dimension of crack propagation in specimens. The basic idea of this algorithm is to first segment image into small square boxes of equal size (with a side length ). Next, these boxes are used to cover all areas of image (as shown in Fig. 9), and the number of small square boxes required to cover the entire fractal structure is calculated. Then, the side length of the boxes () is varied, and the corresponding value of is calculated. Finally, the logarithm of r and are taken as -coordinate and -coordinate of data points, respectively. A straight line is fitted to these data points, the slope of which represents fractal dimension of studied object, as shown in Eq. (6) [36-37]:
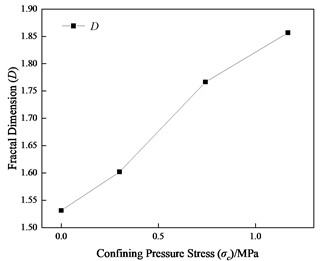
Based on the principle illustrated in Fig. 9, the fractal dimensions of propagating cracks in specimens under different confining stress stresses were calculated using Image J. The relationship between confining pressure stress and fractal dimension of cracks is obtained as shown in Fig. 10.
Fig. 10 shows that confining stress significantly influences the complexity of crack propagation path in the specimen. Specifically, as the confining stress increases, the fractal dimension of cracks also shows an increasing trend. The reason for this is that the increase in confining stress makes the complexity of crack propagation path greater. During the process of image binarization, the number of intersections between cracks and coordinate grids increases, leading to an increase in fractal dimension. Under a given condition, specimens with more complex fracture cracks exhibit higher fractal dimensions. Consequently, the fracture toughness of specimen also increases. Thus, the fractal dimension of cracks in the specimen shows a positive correlation with fracture toughness of specimens.
In summary, the increase in confining stress level alters the stress state at the edge of specimen, which fundamentally causes the deflection of crack propagation paths. The experimental results reveal the regulatory effect of initial stress on crack behavior, that is, the propagation rate of crack approaching the specimen boundary gradually slows down. With increasing initial stress, the main crack path changes from a straight line (low stress) to a composite of straight line and polyline (medium-high stress). This non-planar propagation mode is of great significance for evaluating the actual failure behavior of deep fractured rock masses.
Fig. 9Box-covered crack diagram
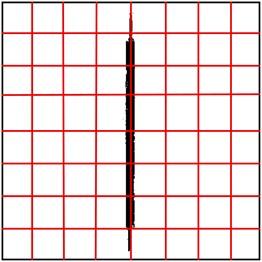
Fig. 10Relationship between confining stress and fractal dimension
3.4. Analysis on energy dissipation rate
In fracture mechanics, fracture energy is defined as the energy consumed per unit area for crack propagation. Based on the load-displacement curves obtained from experiments (as shown in Fig. 3(b)), the fracture energy can be calculated using the following formula:
where, is fracture energy, is work done by the external load, is mass of specimen, is gravitational acceleration, is displacement at fracture failure of the specimen, is load, and is area of the fracture surface.
For specimens with a smaller mass (such as CCNBD specimens used in this study), the term is much smaller than , and its effect can be ignored. Therefore, the fracture energy can be simplified as follows:
The energy release rate () refers to the energy released per unit thickness of material when cracks propagate per unit area of the specimen under tensile load. Based on the load-displacement curve measured during the test, the energy release rate of specimen can be calculated using the following formula [38-39]:
where, is energy release rate, is work done by external load, is fracture surface area of specimen, is radius of specimen, is thickness of the specimen, is total number of data points, is the -th data point, and are the load and displacement corresponding to the -th data point respectively.
When 0, it follows that . Therefore, is used in place of value in this study.
The determination methods for fracture surface area () and external load work () are as follows. Based on the characteristic that all specimens experienced penetration failure along the pre-existing crack surface, an image analysis software (IMAGE J) was used to measure actual area of fracture surface. Before measurement, the spatial scale of software was calibrated according to calibrated dimensions of specimens. The fracture surface contour was obtained by digitally tracing points, and the area was calculated accordingly. Since all specimens fractured perpendicular to the central seam, the change in fracture surface area can be considered negligible. Dense boundary point sets were selected during the measurement process to ensure accuracy. The final measured area was 486.86 mm2. The total mechanical work W done by external load on the specimen is equal to the integral area below load-displacement curve (Fig. 3(b)), which is obtained by numerical integration of load-displacement data points collected in the experiment.
Thus, energy release rate () for crack propagation energy consumption was calculated according to Eq. (7). At the same time, values of each specimen were calculated based on aforementioned fracture toughness calculation results (Table 3). The results of both calculations are summarized in Table 4.
Table 4Calculation results for GIc and KIC2/E
Specimen number | / MPa | / (J·m2) | Average / (J·m2) | / (J·m2) | Average / (J·m2) |
WY-0-1 | 0.000 | 1.020 | 0.887 | 0.375 | 0.412 |
WY-0-2 | 0.000 | 0.870 | 0.317 | ||
WY-0-3 | 0.000 | 0.770 | 0.281 | ||
WY-1-1 | 0.300 | 1.871 | 1.682 | 0.461 | 0.578 |
WY-1-2 | 0.300 | 1.590 | 0.451 | ||
WY-1-3 | 0.300 | 1.584 | 0.448 | ||
WY-2-1 | 0.743 | 3.272 | 3.508 | 1.195 | 1.629 |
WY-2-2 | 0.743 | 3.763 | 1.339 | ||
WY-2-3 | 0.743 | 3.488 | 1.295 | ||
WY-3-1 | 1.168 | 6.478 | 6.590 | 2.449 | 2.648 |
1Y-3-2 | 1.168 | 6.680 | 2.847 | ||
WY-3-3 | 1.168 | 6.612 | 2.650 | ||
Note: – confining stress; – energy release rate; – stress intensity factor; – elasticity modulus (1.728 GPa) | |||||
The data in Table 4 show that energy release rate of CCNBD specimen is the lowest under unconfined pressure conditions. This is attributed to the weaker fracture resistance of specimens in absence of confining stress (manifested as lower fracture toughness), resulting in reduced resistance to crack propagation and consequently lower energy dissipation levels during the crack propagation process. However, the energy release rate of specimens under confining stress shows a significant increasing trend with the rise of confining stress.
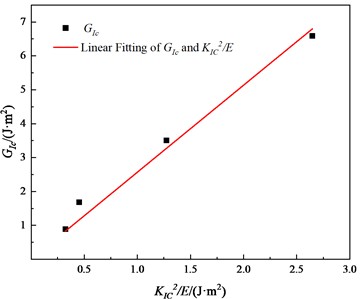
To quantitatively characterize the correlation between stress intensity factor and energy release rate of specimens, a scatter plot and linear fitting curve of the two variables were plotted in this study, as shown in Fig. 11.
By fitting the data points in Fig. 11, the relationship between and can be expressed as follows:
In linear elastic fracture mechanics, energy release rate () and fracture toughness () satisfy the relationship of [40]. Obviously, the coefficient (2.57) in Eq. (11) is not equal to the coefficient 1 of linear elastic fracture equation. This deviation indicates that the fracture behavior of rock-like materials in this study deviates from ideal linear elastic assumption under confining stress (initial stress) [41], exhibiting non-linear elastic characteristics. This conclusion is corroborated by the following experimental observations. Fig. 3 demonstrates that the load-displacement curve displays nonlinearity in the initial loading stage, revealing the existence of energy dissipation mechanisms such as microplastic deformation or microcrack closure/generation. Additionally, due to the influence of loading method, deformation occurs in the contact zone between specimen and indenter during loading process, resulting in a continuous variation in effective loading area.
Fig. 11Linear fitting relationship between GIc and KIC2/E
These phenomena collectively indicate that the mechanical work absorbed by specimen is not entirely used for propagation of main crack. A portion of energy is consumed in plastic deformation and initiation and development of microcracks [42-43]. It should be noted that the integral region covers the total area under load-displacement for calculation method employed in this study, thus including the energy dissipated by plastic deformation and microcrack development mentioned above. Meanwhile, the true crack area of specimen was determined by the nominal crack area in this study, but the true crack area was larger than the nominal crack area. These reasons lead to the coefficient (2.57) of empirical relationship Eq. (11) being significantly higher than theoretical value (1.0), and also reflect the complex energy dissipation mechanisms involved in fracture process of rock masses under deep high-stress conditions.
In summary, under high in-situ stress conditions, the failure mode of specimen will change from linear elastic failure to non-linear elastic failure. The research findings provide certain theoretical basis for studying fracture and instability of rock masses under high in-situ stress environments.
4. Discussions
4.1. Fracture process of CCNBD specimen
Based on the loading principle illustrated in Fig. 2, the fracture mechanism of CCNBD specimen is analyzed as follows. The concentrated compressive load applied along the direction of pre-existing crack plane first induces axial compressive deformation in the specimen. Through the Poisson effect, it triggers transverse tensile deformation in the vertical direction (i.e., the ligament zone), where elastic strain energy accumulates continuously. The accumulated strain energy is immediately converted into transverse tensile stress acting on the ligament area, and becomes the maximum principal stress of the local stress field in that area. Due to the geometric discontinuity at the tip of pre-existing chevron crack, this principal stress exhibits a highly non-uniform distribution, resulting in a stress peak in the crack tip area. When this peak tensile stress exceeds the material's fracture toughness in ligament zone, crack initiation occurs. Following initiation, the stored elastic strain energy is rapidly released, driving the crack surface to rapidly propagate along the ligament zone (dominantly in I-type fracture mode), which is often accompanied by audible brittle fracture sounds.
The complete fracture process and its energy evolution described above are quantitatively characterized by the synchronous recorded load-displacement curve (Fig. 3), which comprehensively reflects the mechanical response of specimen throughout the entire fracture process.
4.2. Microscopic morphology characteristics of fracture
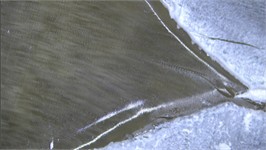
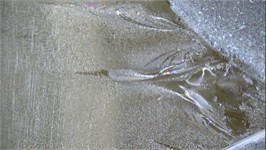
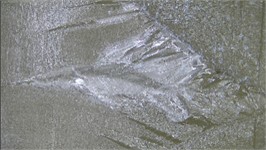
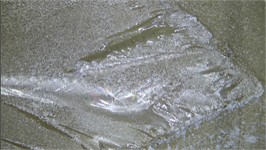
The fracture morphology characteristics of CCNBD specimens under different confining stresses were observed via electron microscopy, as shown in Fig. 12.
Fig. 12Microscopic fracture morphology of CCNBD specimens
a) 0 MPa
b) 0.3 MPa
c) 0.743 MPa
d) 1.168 MPa
From Fig. 12(a), it can be observed that the fracture surface of specimen without confining stress is straight and smooth, exhibiting typical brittle tensile fracture characteristics. After initiating from the tip of pre-existing fracture, the crack rapidly propagated along the direction of the maximum principal stress (i.e., the loading direction), forming a single main crack. No obvious friction marks or secondary fragmentation zones are observed on the fracture surface.
As can be seen from Fig. 12(b), the fracture surface of specimen under low confining stress conditions remains mainly straight, but slight undulations and fine debris appear locally. The crack path continues to propagate in a straight line, and after the crack initiates along the tip of pre-existing fracture, it penetrates along the maximum principal stress direction (i.e., the loading direction) at a slower rate. When the specimen fails under medium confining pressure (Fig. 12(c)), the fracture surface is accompanied by extrusion-crushed zones and microcrack propagation, and the roughness of. fracture surface increases. Under high confining stress conditions, the extrusion-crushed zones and propagation range of microcracks on the fracture surface (Fig. 12(d)) expand. In addition, the proportion of local fragmentation on the fracture surface increases, and the roughness rises significantly.
This is because, in the absence of confining stress, stress concentration at the crack tip leads to specimen fracture, with the tensile strength of material being the dominant factor. Under these conditions, the resistance to crack propagation is small and the energy dissipation is low, resulting in a smooth fracture surface. As the confining stress gradually increases, the crack surfaces become in micro-contact, increasing frictional resistance. The crack tip undergoes local grinding under the combined action of transverse tensile stress and confining stress constraint stress, resulting in formation of local fracture zones and microcrack propagation areas in the material.
As analyzed in Section 3.4, the energy release rate of specimen increases with the increase in confining stress. This phenomenon is reflected by the deflection of crack propagation paths in the specimen (Section 3.3.1) during the fracture test and an increase in the roughness of fracture surface.
4.3. Confined pressure effect of fracture toughness
Based on the analysis of crack propagation morphology (Fig. 8) after specimen failure, the mechanism by which the fracture toughness () of rock-like materials increases with increasing confining stress was derived.
Firstly, confining stress causes the cracks in specimen to tend to close, thereby enhancing the strength of specimen. The normal stress provided by confining stress prompts the closure or compaction of crack surface, including the macroscopic main crack and its surrounding microcrack network. This closing effect effectively reduces the stress singularity at the crack tip and improves the continuity of material ahead of crack tip, thereby enhancing the material’s resistance to crack initiation and propagation. Macroscopically, this is manifested as an increase in the ultimate load.
The next is superposition effect of stress intensity factors. According to the principle of stress intensity factor superposition in fracture mechanics, the confining stress applied to the crack surface (perpendicular to the crack surface direction) produces a stress intensity factor component (i.e. ) that causes the pre-existing crack to tend to close. This component is superimposed with the stress intensity factor generated by external load at the crack tip. Therefore, in order for the crack to propagate (i.e. to reach ), the external load required must be increased to overcome the closing effect produced by confining stress. Macroscopically, this mechanism leads to a significant increase in the measured apparent fracture toughness.
In summary, the confining pressure environment can strengthen the local material at the crack tip, while the confining stress can counteract part of the stress generated by external loads. This dual effect leads to the experimental phenomenon that the fracture toughness increases linearly with the increase of confining stress.
5. Conclusions
In this study, 3D-printed CCNBD specimens were used to investigate the effect of confining pressure on fracture behavior. Based on the test results and fracture morphology analysis, the following conclusions can be drawn.
1) Confining pressure clearly improved the load-bearing capacity of the CCNBD specimens. As the confining pressure increased from 0 to 1.168 MPa, the fracture load and peak displacement both increased. This indicates that lateral constraint limited the opening of the pre-existing crack and increased the resistance to crack initiation and propagation. The increase in the post-peak drop load also shows that more elastic strain energy was stored before fracture under higher confining pressure.
2) The fracture toughness increased with increasing confining pressure. This increase was mainly related to the crack-closing effect caused by lateral constraint. Under confining pressure, the crack surface was compressed, and a higher external load was required to drive crack propagation. Therefore, the measured effective fracture toughness represents the combined effect of material fracture resistance and confining-pressure-induced crack closure.
3) Confining pressure changed the crack propagation path and fracture mode. Without confining pressure, the main crack propagated almost straight through the specimen, showing a typical tensile fracture feature. With increasing confining pressure, the crack path became more tortuous, and local deflection appeared near the specimen edge. This suggests that the stress state around the crack tip changed under lateral constraint, and the fracture process gradually showed tensile-shear mixed features.
4) The energy release rate increased with increasing confining pressure. This result shows that more energy was required for crack propagation under stronger lateral constraint. The difference between the measured energy release rate and the ideal linear elastic relationship also indicates that part of the external work was consumed by microcrack development, local crushing, friction, and non-elastic deformation during fracture.
5) The results show that confining pressure can increase crack propagation resistance, promote crack path deflection, and raise the energy required for fracture. These findings help explain the fracture behavior of deep hard and brittle rocks under lateral constraint. However, the specimens used in this study are 3D-printed rock-like resin materials. Therefore, the obtained fracture toughness values should be regarded as equivalent parameters under the present test conditions. They should not be directly used as quantitative design parameters for natural deep rocks without further calibration by high-confining-pressure tests on natural rocks and numerical simulations.
References
-
H. Xie, F. Gao, and Y. Ju, “Research and exploration of deep rock mechanics,” Chinese Journal of Rock Mechanics and Engineering, Vol. 34, No. 11, pp. 2161–2178, 2015.
-
J. Ge, Y. Xu, L. Cheng, and Q. Zong, “Relationship between in-situ stress and propagation direction of main cracks induced by blasting,” (in Chinese), Journal of Vibration and Shock, Vol. 42, No. 4, pp. 54–64, 2023, https://doi.org/10.13465/j.cnki.jvs.2023.04.007
-
J. Jin, L. Fang, Y. Wang, H. Xiong, Y. Xiao, and X. Peng, “Experimental study on dynamic response characteristics of rocks under high water pressures and high stresses,” (in Chinese), Chinese Journal of Rock Mechanics and Engineering, Vol. 43, No. 8, pp. 1821–1838, 2024, https://doi.org/10.13722/j.cnki.jrme.2023.1004
-
L. Dong, Y. Zhang, and J. Ma, “Micro-crack mechanism in the fracture evolution of saturated granite and enlightenment to the precursors of instability,” Sensors, Vol. 20, No. 16, p. 4595, Aug. 2020, https://doi.org/10.3390/s20164595
-
L. Guo, Y. Shen, M. Lyu, D. Zhang, and Z. Huang, “Non-parametric seismic fragility assessment of underground structures incorporating stochastic ground motion,” Soil Dynamics and Earthquake Engineering, Vol. 200, p. 109893, Nov. 2025, https://doi.org/10.1016/j.soildyn.2025.109893
-
J. Guan, Y. Ma, and C. Xie, “Predicting fracture behavior of quasi-brittle materials using quantitatively varied geometric specimens: a design method,” Materials and Design, Vol. 236, p. 112476, Dec. 2023, https://doi.org/10.1016/j.matdes.2023.112476
-
H. Bao et al., “Evaluation of mode-i fracture toughness of rock based on brittleness index of strength parameters,” Journal of Architecture and Civil Engineering, Vol. 35, No. 4, pp. 97–104, 2018.
-
M. D. Kuruppu, Y. Obara, M. R. Ayatollahi, K. P. Chong, and T. Funatsu, “ISRM-suggested method for determining the mode i static fracture toughness using semi-circular bend specimen,” Rock Mechanics and Rock Engineering, Vol. 47, No. 1, pp. 267–274, Apr. 2013, https://doi.org/10.1007/s00603-013-0422-7
-
R. J. Fowell, “Suggested method for determining mode i fracture toughness using cracked chevron notched Brazilian disc (CCNBD) specimens,” International Journal of Rock Mechanics and Mining Sciences and Geomechanics Abstracts, Vol. 32, No. 1, pp. 57–64, Jan. 1995, https://doi.org/10.1016/0148-9062(94)00015-u
-
W. Zhao, S. Zhang, M. Wang, W. Shen, and Z. Jiao, “Experimental study on testing rock fracture toughness with two types of disc specimens recommended by ISRM,” (in Chinese), Journal of Experimental Mechanics, Vol. 35, No. 4, pp. 702–711, Aug. 2020, https://doi.org/10.7520/1001-4888-18-216
-
F. Dai, M. Wei, N. Xu, Y. Xu, and T. Zhao, “A numerical study of mode-i progressive rock fracture process of cracked chevron notched Brazilian disc,” (in Chinese), Chinese Journal of Rock Mechanics and Engineering, Vol. 34, No. S2, pp. 3906–3914, Sep. 2015, https://doi.org/10.13722/j.cnki.jrme.2014.1050
-
H. Liu et al., “Study on the dynamic fracture behavior of anisotropic CCNBD shale specimens under different impact angles,” Theoretical and Applied Fracture Mechanics, Vol. 133, p. 104616, Aug. 2024, https://doi.org/10.1016/j.tafmec.2024.104616
-
G. Ma, J. Li, X. Zhou, J. Chen, Y. Zhang, and P. Qiu, “Experimental and numerical investigations on fracture behaviours of cracked chevron notched Brazilian disc (CCNBD) sandstone specimen under cyclic loading,” Engineering Fracture Mechanics, Vol. 271, p. 108673, Jul. 2022, https://doi.org/10.1016/j.engfracmech.2022.108673
-
D. Yan et al., “Heterogeneity indexes of unconventional reservoir shales: quantitatively characterizing mechanical properties and failure behaviors,” International Journal of Rock Mechanics and Mining Sciences, Vol. 171, p. 105577, Sep. 2023, https://doi.org/10.1016/j.ijrmms.2023.105577
-
L. Yu, Y. Xu, J. Ge, and Y. Jia, “Investigation on fracture characteristics and crack propagation behavior of fractured rock mass using 3D-printed specimens,” Blasting, Vol. 41, No. 4, pp. 25–34, 2024.
-
Q. Jiang and L. Song, “Application and prospects of 3D printing technology in mechanical testing of physical rock mass models,” (in Chinese), Chinese Journal of Rock Mechanics and Engineering, Vol. 37, No. 1, pp. 23–37, 2018, https://doi.org/10.13722/j.cnki.jrme.2017.0685
-
T. Zhou and J. B. Zhu, “Identification of a suitable 3D printing material for mimicking brittle and hard rocks and its brittleness enhancements,” Rock Mechanics and Rock Engineering, Vol. 51, No. 3, pp. 765–777, Oct. 2017, https://doi.org/10.1007/s00603-017-1335-7
-
W. Tian, X. Wang, W. Yun, C. Yu, J. Gong, and B. Qin, “Mechanical properties of sand 3D printed rock-like specimens with different post-processing methods,” Rock and Soil Mechanics, Vol. 44, No. 5, pp. 1330–1340, 2023.
-
Y. Ju et al., “Visualization of the complex structure and stress field inside rock by means of 3D printing technology,” Chinese Science Bulletin, Vol. 59, No. 36, pp. 5354–5365, Aug. 2014, https://doi.org/10.1007/s11434-014-0579-9
-
Q. Niu, L. Jiang, C. Li, Y. Zhao, Q. Wang, and A. Yuan, “Application and prospects of 3D printing in physical experiments of rock mass mechanics and engineering: materials, methodologies and models,” International Journal of Coal Science and Technology, Vol. 10, No. 1, Feb. 2023, https://doi.org/10.1007/s40789-023-00567-8
-
V. Truxova, J. Safka, M. Seidl, I. Kovalenko, L. Volensky, and M. Ackermann, “Ceramic 3D printing: comparison of SLA and DLP technologies,” MM Science Journal, Vol. 2020, No. 2, pp. 3905–3911, Jun. 2020, https://doi.org/10.17973/mmsj.2020_06_2020006
-
M. Pagac et al., “A review of vat photopolymerization technology: materials, applications, challenges, and future trends of 3D printing,” Polymers, Vol. 13, No. 4, p. 598, Feb. 2021, https://doi.org/10.3390/polym13040598
-
B. Mahanta, A. Tripathy, V. Vishal, T. N. Singh, and P. G. Ranjith, “Effects of strain rate on fracture toughness and energy release rate of gas shales,” Engineering Geology, Vol. 218, pp. 39–49, Dec. 2016, https://doi.org/10.1016/j.enggeo.2016.12.008
-
N. Ghanbari, M. Hosseini, and M. Saghafiyazdi, “Effects of temperature and confining pressure on the mode i and mode ii fracture toughness of cement mortar,” Theoretical and Applied Fracture Mechanics, Vol. 104, p. 102361, Sep. 2019, https://doi.org/10.1016/j.tafmec.2019.102361
-
T. Funatsu, M. Seto, H. Shimada, K. Matsui, and M. Kuruppu, “Combined effects of increasing temperature and confining pressure on the fracture toughness of clay bearing rocks,” International Journal of Rock Mechanics and Mining Sciences, Vol. 41, No. 6, pp. 927–938, May 2004, https://doi.org/10.1016/j.ijrmms.2004.02.008
-
M. Yan et al., “Study on evolution law of fracture toughness of ultra-deep laminated shale,” (in Chinese), Petroleum Drilling Techniques, Vol. 53, No. 2, pp. 159–167, 2025, https://doi.org/10.11911/syztjs.2025032
-
H. Fan, S. Zhang, X. Gou, and Q. Wang, “Novel numerical calibration of the critical stress-intensity factor for rock fracture toughness specimens CCNBD,” Chinese Journal of Applied Mechanics, Vol. 28, No. 4, pp. 416–422, 2011, https://doi.org/10.1016/j.ijrmms.2010.05.005
-
Y. Wu, F. J. Mcgarry, B. Zhu, J. R. Keryk, and D. E. Katsoulis, “Temperature effect on mechanical properties of toughened silicone resins,” Polymer Engineering and Science, Vol. 45, No. 11, pp. 1522–1531, Nov. 2005, https://doi.org/10.1002/pen.20423
-
Q.-L. Yuan, Z. Yang, and W.-S. Xu, “Recent advances in the entropy theory of polymer glass transition,” Scientia Sinica Chimica, Vol. 53, No. 4, pp. 616–627, 2023, https://doi.org/10.1360/ssc-2022-0247
-
J. Ge, “Model experimental study on crack propagation in rock blasting under initial stress state,” Anhui University of Science and Technology, Huainan, China, 2020.
-
J. C. Jaeger, N. G. W. Cook, and R. W. Zimmerman, Fundamentals of Rock Mechanics. Hoboken, NJ, USA: John Wiley & Sons, 2009.
-
J. Huang and S. Wang, “Experimental investigation on fracture toughness of rocks,” Chinese Journal of Geotechnical Engineering, No. 2, pp. 67–75, 1982.
-
A. A. Griffith, “The phenomena of rupture and flow in solids,” Philosophical Transactions of the Royal Society of London. Series A, Containing Papers of a Mathematical or Physical Character, Vol. 221, No. 582-593, pp. 163–198, Jan. 1921, https://doi.org/10.1098/rsta.1921.0006
-
Y. Huang, S. Yang, Y. Ju, X. Zhou, and F. Gao, “Experimental study on mechanical behavior of rock-like materials containing pre-existing intermittent fissures under triaxial compression,” Chinese Journal of Geotechnical Engineering, Vol. 38, No. 7, pp. 1212–1220, 2016, https://doi.org/10.1007/s10409-015-0489-3
-
J. Ge et al., “Analysis on characteristics and mechanism for rock fracture in deep rock with cracks under dynamic-static coupling effect,” Scientific Reports, Vol. 14, No. 1, p. 31840, Dec. 2024, https://doi.org/10.1038/s41598-024-83256-z
-
M. Luo, P. W. J. Glover, P. Zhao, and D. Li, “3D digital rock modeling of the fractal properties of pore structures,” Marine and Petroleum Geology, Vol. 122, p. 104706, Sep. 2020, https://doi.org/10.1016/j.marpetgeo.2020.104706
-
B. Li, K. Yang, and Y. Liu, “Fractal theory and computational methods for fractal parameters,” Tool Engineering, Vol. 38, No. 12, pp. 80–84, 2004.
-
G. R. Irwin, “Linear fracture mechanics, fracture transition, and fracture control,” Engineering Fracture Mechanics, Vol. 1, No. 2, pp. 241–257, Mar. 2003, https://doi.org/10.1016/0013-7944(68)90001-5
-
W. Li, P. Huang, Z. Chen, and X. Zheng, “Testing method of critical energy release rate for interfacial mode II crack,” Engineering Fracture Mechanics, Vol. 248, p. 107708, Mar. 2021, https://doi.org/10.1016/j.engfracmech.2021.107708
-
T. L. Anderson, Fracture mechanics: fundamentals and applications. Boca Raton, FL, USA: CRC Press, 2017.
-
Y. Qiao, Z.-X. Zhang, and S. Zhang, “An experimental study of the relation between Mode I fracture toughness, KIc, and critical energy release rate, GIc,” Materials, Vol. 16, No. 3, p. 1056, Jan. 2023, https://doi.org/10.3390/ma16031056
-
P. Ghabezi and M. Farahani, “A cohesive model with a multi-stage softening behavior to predict fracture in nano composite joints,” Engineering Fracture Mechanics, Vol. 219, p. 106611, Aug. 2019, https://doi.org/10.1016/j.engfracmech.2019.106611
-
P. Ghabezi and M. Farahani, “Trapezoidal traction-separation laws in mode II fracture in nano-composite and nano-adhesive joints,” Journal of Reinforced Plastics and Composites, Vol. 37, No. 11, pp. 780–794, Mar. 2018, https://doi.org/10.1177/0731684418761001
About this article

This research is supported by the Graduate Innovation Fund of Anhui University of Science and Technology (No. 2024cx2018), Research grants project for bringing in talents of Anhui University of science and technology, National Natural Science Foundation of China (No. 52104116, No. 52304118, No. 52274071).
The datasets generated during and/or analyzed during the current study are available from the corresponding author on reasonable request.
Jinjin Ge: writing-review and editing, validation, methodology, funding acquisition. Yongqi Jia: experiments, writing-review and editing, writing-original draft, data curation. Zongxian Zhang: formal analysis, conceptualization. Meilu Yu: conceptualization. Wei Huang: investigation, data curation. Ying Xu: supervision, project administration. Ling Ji: methodology, formal analysis, data curation. Hui Hong: investigation, data processing.
The authors declare that they have no conflict of interest.

