Abstract
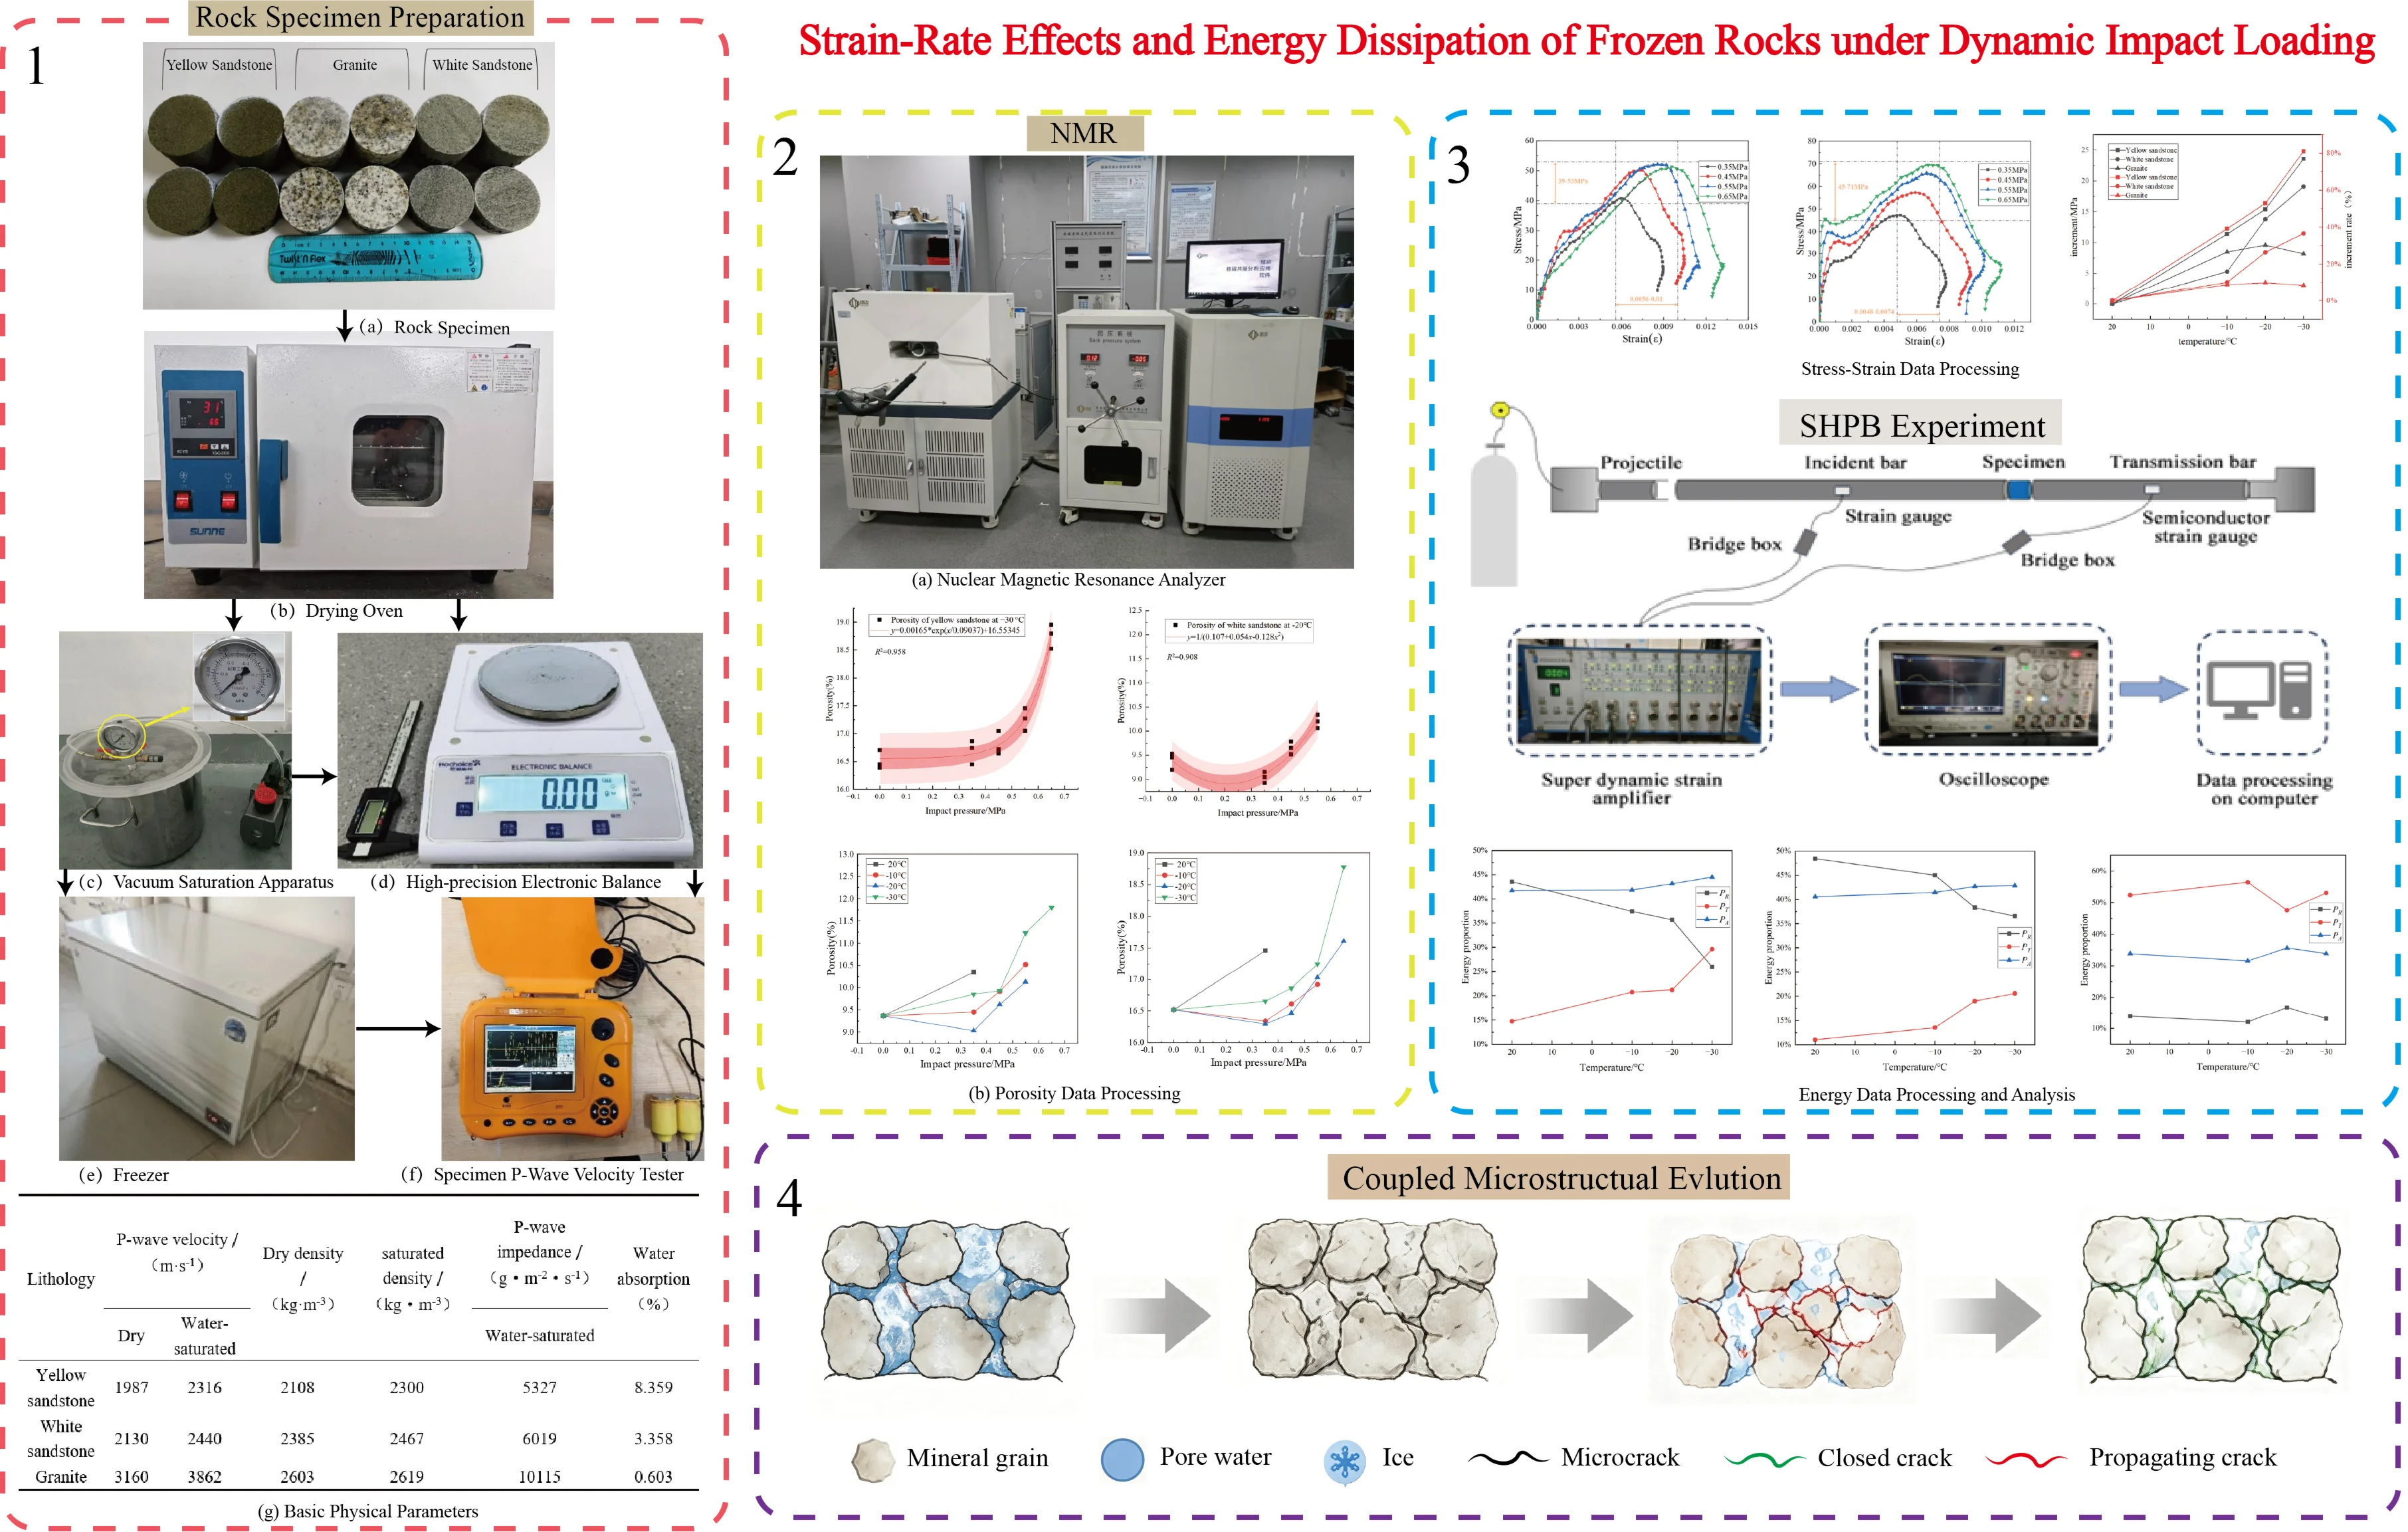
To investigate the dynamic impact response of frozen rocks, this study performed dynamic compression tests on yellow sandstone, white sandstone, and granite under various low temperatures and impact intensities using a modified split Hopkinson pressure bar (SHPB) system, and analyzed the strength, deformation, and energy dissipation characteristics of the three rock types. The results show that low temperature significantly enhances the dynamic compressive strength of the two sandstones, with yellow sandstone being the most strongly affected by temperature. The strength of the specimens exhibits a strain rate effect. The peak stress of yellow sandstone shows a linear relationship with impact pressure and is most significantly affected by temperature, while that of white sandstone follows a quadratic growth pattern, and that of granite also shows a linear relationship. Under impact loading, the three rocks exhibit differences in energy distribution. For yellow sandstone, the proportion of reflected energy is the highest, whereas that of transmitted is energy the lowest, and the dissipated energy increases with decreasing temperature. For white sandstone, both the proportions of transmitted and dissipated energies increase as temperature decreases, and both reflected and transmitted energies show low-temperature sensitivity. For granite, the proportion of reflected energy is the lowest, energy is mainly transmitted through the specimen, and the influence of temperature is weak. The three rocks have different water absorption capacities. The water-ice phase change caused by low temperature alters the rock structure and increases the wave impedance, leading to different temperature sensitivities in energy distribution under impact loading. The low-temperature strengthening mechanism originates from the filling of pores by ice, intergranular cementation, and microcrack closure caused by differential thermal contraction of minerals. The research findings can provide a theoretical basis and experimental reference for the stability evaluation and protective engineering design of rock masses of different lithologies subjected to dynamic loads in cold regions.
Highlights
- Modified SHPB tests were conducted on frozen yellow sandstone, white sandstone, and granite to quantify their dynamic strength, deformation, and energy-partitioning characteristics under different subzero temperatures and impact pressures.
- Freezing significantly enhances the dynamic compressive strength of both sandstones, with yellow sandstone exhibiting the greatest temperature sensitivity because of its relatively high porosity and water absorption.
- The peak stress increases linearly with impact pressure for yellow sandstone and granite, whereas white sandstone follows a quadratic relationship; all three rock types exhibit distinct strain-rate effects.
- Cooling generally reduces the reflected-energy proportion and increases energy dissipation in both sandstones, whereas transmitted energy remains dominant in dense granite, which exhibits limited temperature sensitivity.
- The lithology-dependent dynamic response is jointly governed by pore-ice cementation, differential thermal contraction, microcrack closure and propagation, pore structure, and wave-impedance matching.
1. Introduction
With the increasing development of mineral resources and infrastructure projects in cold regions of China, understanding the mechanical behavior of frozen rock masses subjected to dynamic disturbances, including mechanical excavation and blasting activities, has become essential for ensuring safe and efficient engineering operations. At subzero temperatures, the pore water inside the rock undergoes a water-ice phase transition, which promotes the propagation of pores and fissures and fills the skeleton structure, forming microscale ice–rock coupled structural units. Consequently, frozen rocks exhibit mechanical properties significantly different from those at room temperature. Meanwhile, under impact loading, stress waves induce a rapid proliferation of damage microcracks and alter their propagation paths, so that frozen rocks subjected to the coupled effect of dynamic loading and freezing display a pronounced temperature sensitivity.
Existing studies have shown that negative temperature environments can generally significantly increase the strength and deformation modulus of rock, while Poisson's ratio is not significantly affected by temperature. Moreover, the increase in rock strength is related to the pore water within the rock [1-5]. Xu et al. [6] pointed out that the freezing of pore water at low temperatures is the key reason for the increase in compressive strength; Barkat Ullah et al. [7] employed Split Hopkinson Pressure Bar (SHPB) and nuclear magnetic resonance (NMR) techniques to reveal the effects of freezing on the dynamic fracture and pore characteristics of sandstone. Water plays a complex and critical role in the mechanical behavior of frozen rock, and the overall strength response of low-temperature frozen rock is the result of the combined effects of pore water phase change, temperature effects, and rock matrix characteristics. Yang et al. [8] pointed out that sandstone, due to its large porosity and high water content, becomes sensitive to temperature changes after freezing, with a significant increase in strength. Liu et al. [9] investigated water-rich red sandstone and revealed the variation patterns of rock strength, toughness, and energy absorption capacity under temperature changes. Xu et al. [10] conducted dynamic compression tests on frozen sandstone with different saturation degrees at low temperatures, finding that the lower the negative temperature, the higher the peak strength of frozen sandstone. J. Kodama et al. [11] and Xi et al. [12] compared and found that under the same low-temperature conditions, the strength of dry rock is lower than that of frozen rock, and as temperature decreases, the crack density first increases and then decreases, while the absorbed energy also first increases and then decreases. Rock strength exhibits an enhancement effect in low-temperature water-saturated environments, and the strain rate effect under impact loading also increases rock strength.
At room temperature, the dynamic strength of water-saturated sandstone and air-dried sandstone is similar, but the strain rate effect is significant: the higher the impact velocity, the greater the energy dissipated during the impact process [13-16]. The strain rate effect is also significant under low-temperature conditions. Wang et al. [17] investigated the dynamic characteristics of frozen rock with ice-bearing structural planes under different impact rates and found that both the dynamic compressive strength and peak strain exhibited a strong strain rate effect, with incident energy, reflected energy, and dissipated energy increasing substantially as the strain rate increased. Gao et al. [18] compared three states: room-temperature dry, room-temperature water-saturated, and low-temperature frozen, and found that the average uniaxial dynamic compressive and tensile strengths of frozen rock at –20 °C were higher than those of rock at room temperature. Liu et al. [19] combined SHPB, a low-temperature chamber, and a high-speed DIC system and found that the fracture time and dynamic tensile strength of frozen sandstone increase with decreasing temperature and increasing strain rate. Yang et al. [20] systematically investigated the dynamic mechanical response of red sandstone at low temperatures and found that a negative-temperature environment significantly improves the dynamic compressive strength and elastic modulus, and this enhancement effect becomes more pronounced as temperature decreases and strain rate increases. Evidently, the dynamic mechanical behavior of frozen rock is also strain-rate dependent; however, due to differences in pore structure, mineral composition, and water-bearing characteristics among different lithologies, the degree of strain rate dependence varies.
Existing studies have confirmed that the strength, deformation, and energy dissipation behavior of frozen rocks are jointly controlled by the pore water–ice phase transition, temperature, and strain rate. However, most investigations have focused on the response of a single rock type under specific temperatures or strain rates, while the temperature sensitivities of rocks with different lithologies differ significantly. In this study, three typical rock types – yellow sandstone, white sandstone, and granite – are selected, and dynamic compression tests are systematically conducted under various low temperatures and impact loads. The evolution of strength characteristics and the energy dissipation mechanisms of frozen rocks are analyzed, aiming to provide a more generalized theoretical basis for the stability assessment of rock masses in cold regions subjected to dynamic loading.
2. Materials and methods
2.1. Specimen parameters and basic physical parameters
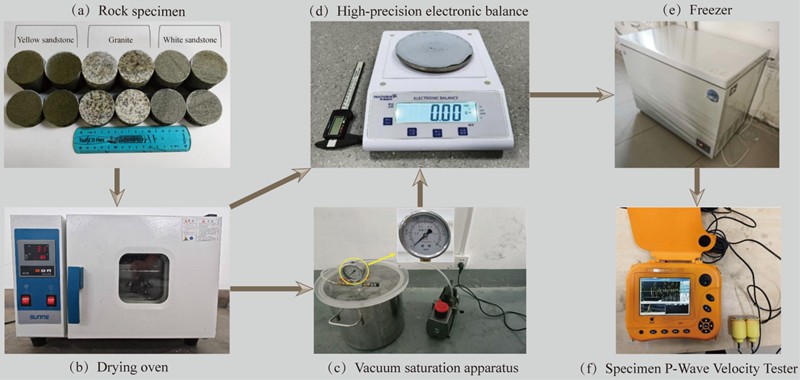
Following the standards of the International Society for Rock Mechanics (ISRM), yellow sandstone, white sandstone, and granite collected from an open-pit mine in western China were machined into cylindrical specimens of Ф50 mm×50 mm, with end-face unevenness ≤ 0.02 mm and non-parallelism ≤ 0.05 mm. To obtain parameters such as dry density, saturated density, and dry and saturated P-wave velocities, the specimens were first dried. Immediately after removal from the drying oven, their mass was measured using a high-precision electronic balance (accuracy 0.01 g), and their exact dimensions were measured using a high-precision electronic caliper. The dry P-wave velocities of the three rock types were measured using a wave velocity tester, and the wave impedance of the rock was calculated from the P-wave velocity and density of the rock [21]. Subsequently, the specimens were subjected to saturation treatment. After saturation, their saturated mass and saturated P-wave velocities were measured. Following the measurements, the specimens were wrapped with plastic wrap to prevent surface moisture evaporation during freezing, and then placed in a freezing chamber for 48 h to freeze. The specific operating procedure is shown in Fig. 1, and the relevant parameters are listed in Table 1.
Fig. 1Pre-test preparation flow. Photo by Tianxiang Deng and Qi An, 2025.12, Anhui University of Science and Technology, Huainan, Anhui 232001, China
2.2. Modification of the SHPB test system and experimental scheme
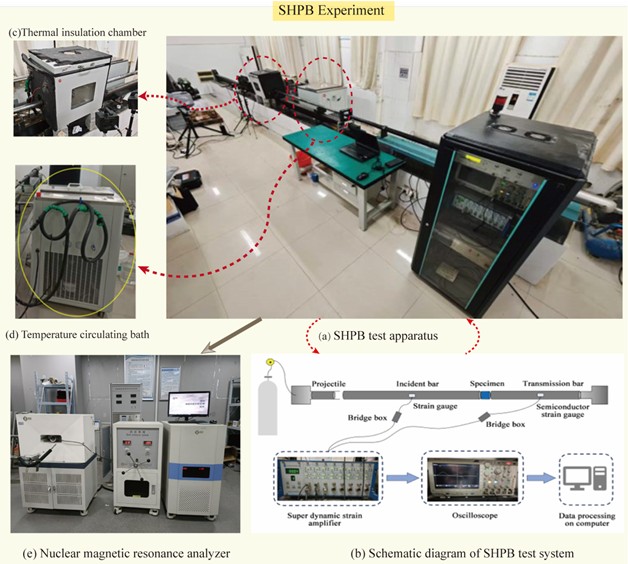
The SHPB system used in the test consists of four parts: a power system, a bar system, a damping system, and a data acquisition system. The power system includes a high-pressure nitrogen cylinder, a launch chamber, and an air pressure controller. The bar system comprises a striker bar, an incident bar, and a transmission bar. The damping system is a damper. The data acquisition system consists of strain gauges, an ultra-dynamic strain amplifier, and an oscilloscope, as shown in Fig. 2(a-b). To meet the testing requirements of frozen rock at low temperatures, a temperature control module was added to the system: a temperature-controllable (–40 °C to 60 °C) insulation chamber was installed between the incident bar and the transmission bar, with holes matching the bar diameters on both sides of the chamber, as shown in Fig. 2(c-d). The device consists of a temperature circulating bath and an insulation chamber. Industrial ethanol solution is added to the temperature circulating bath, and circulation and diversion are used to achieve temperature control. The ethanol circulates inside the pipelines of the insulation chamber, and a fan inside the chamber ensures uniform temperature distribution, with a temperature accuracy of ±1 °C.
Table 1Basic physical parameters of three types of rocks
Lithology | P-wave velocity (m·s-1) | Dry density (kg·m-3) | Saturated density (kg·m-3) | P-wave impedance (103kg·m-2·s-1) | Water absorption (%) | |
Dry | Water-saturated | Water-saturated | ||||
Yellow sandstone | 1987 | 2316 | 2108 | 2300 | 5327 | 8.359 |
White sandstone | 2130 | 2440 | 2385 | 2467 | 6019 | 3.358 |
Granite | 3160 | 3862 | 2603 | 2619 | 10115 | 0.603 |
In order to attenuate high-frequency oscillations and prolong the rising edge of the incident wave, a pulse shaper (a copper disc of 2 mm in thickness) was affixed to the impact end of the incident bar for all experiments, so that the specimen could reach stress equilibrium before fracture. The validity of pulse shaping was confirmed by the stress equilibrium verification presented in Fig. 3(b).
Fig. 2SHPB test and NMR processing. Photo by Tianxiang Deng and Qi An, 2025.12, Anhui University of Science and Technology, Huainan, Anhui 232001, China
The material parameters of the bars in the SHPB test system are listed in Table 2.
Table 2Material parameters of SHPB test system bars
SHPB materials | Density (kg/m3) | Elastic modulus (GPa) | P-wave velocity (m/s) |
Alloy steel member | 7800 | 210 | 5190 |
Aluminum alloy member | 2700 | 70 | 5045 |
This experiment requires the assumption of one-dimensional elastic stress wave propagation in the bars and the assumption of uniform distribution of the stress and strain fields along the length of the specimen. To obtain the stress, strain, and strain rate of the specimen under impact loading, only the reflected and transmitted strain signals and , respectively are used. This method is referred to as the “two-wave method” [22]. Provided that the two basic assumptions are satisfied, the results obtained by the two-wave method and the three-wave method are in good agreement, and the two-wave method is relatively simpler and faster for calculation. Therefore, after stress equilibrium has been verified, the two-wave method is used for processing and calculation in this study.
The corresponding governing equations are listed below:
where and are the length and cross-sectional area of the specimen under impact loading; for the bar, the longitudinal wave velocity, elastic modulus, and cross-sectional area are denoted as , , and ; the incident strain, transmitted strain, and reflected strain of the specimen are , , and ; the strain rate of the specimen is ; the strain of the specimen is ; and the stress of the specimen is .
All test specimens were subjected to forced water saturation. The freezing temperatures were set at –10 °C, –20 °C, and –30 °C, with room temperature (20 °C) serving as the control group. The experimental apparatus was a self-developed split Hopkinson pressure bar (SHPB) system capable of controlling a low-temperature environment. Preliminary impact tests were conducted to determine four impact pressure levels: 0.35 MPa, 0.45 MPa, 0.55 MPa, and 0.65 MPa. Under the forced water-saturated condition, a factorial test program was conducted with temperature, impact pressure, and strain rate as variables. Each test group had three parallel specimens to ensure data reliability.
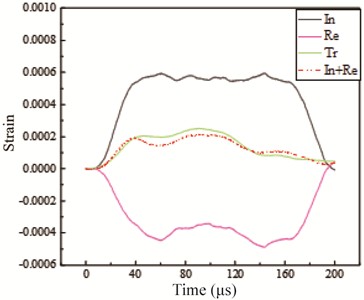
The typical waveform diagram and the stress equilibrium verification diagram of the specimen are shown in Fig. 3. It can be seen from the figure that the incident wave propagates in the form of a rectangular wave. Although the rectangular wave exhibits certain oscillations, these oscillations remain within a controllable range and the waveform is satisfactory. In addition, it can be observed from the strain time history curves that the strain curve formed by the superposition of the incident and reflected waves shows good agreement with the transmitted strain curve, which verifies that the specimen can achieve a state of uniform stress and satisfy dynamic stress equilibrium in this test. As shown in Fig. 3(b), the three curves “In”, “Re” and “Tr” represent the incident wave, the transmitted wave, and the reflected wave.
Fig. 3Typical waveform and stress equilibrium verification diagram
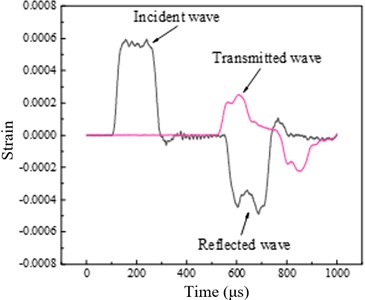
a) Typical waveform diagram of the specimen
b) Verification of dynamic stress equilibrium for a typical specimen
2.3. Changes in porosity
Under dynamic loading, rock specimens may not necessarily develop macroscopic cracks or obvious structural failure; however, their internal structure is inevitably affected by dynamic disturbance. Nuclear Magnetic Resonance (NMR) is a technique capable of analyzing the pore distribution within a specimen. Therefore, NMR testing was employed to quantitatively characterize the internal pore distribution of the specimens before and after a single impact load. The NMR analyzer is shown in Fig. 2(e) [23].
Fig. 4Yellow sandstone porosity
a) 20 ℃
b) –10 ℃
c) –20 ℃
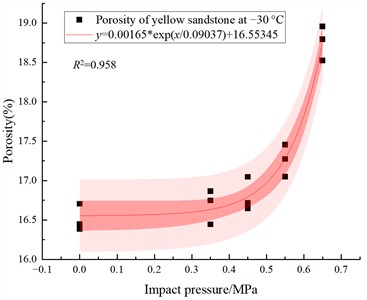
d) –30 ℃
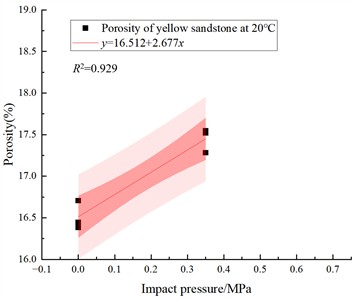
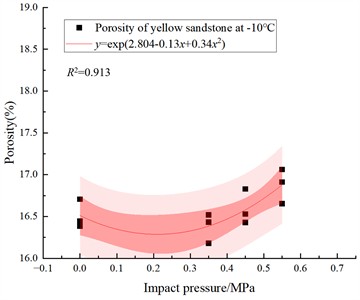
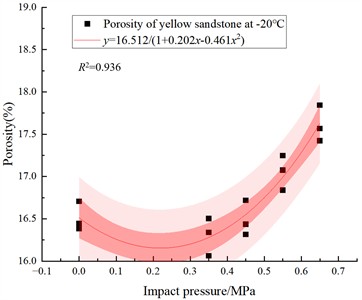
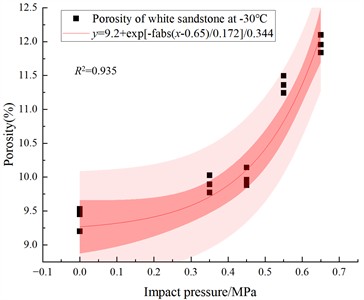
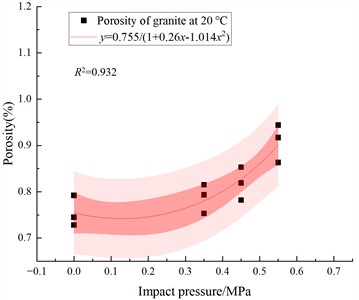
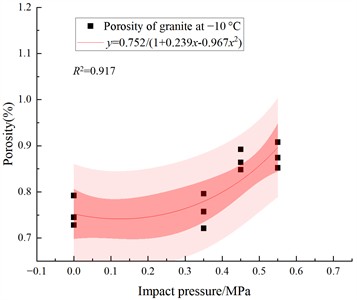
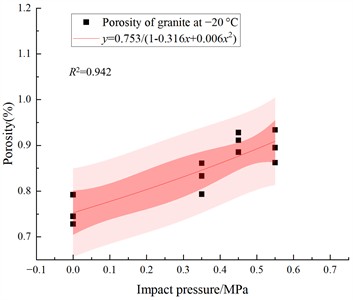
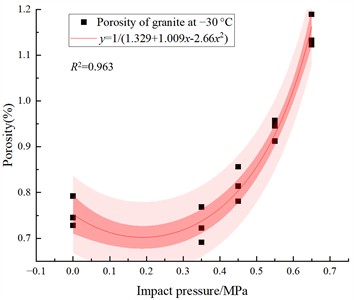
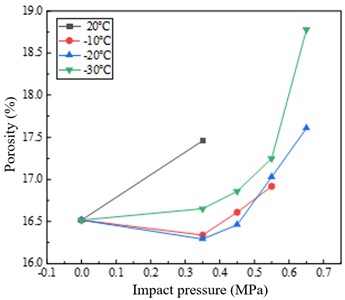
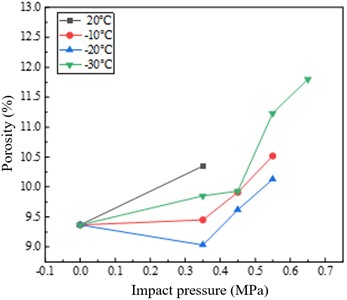
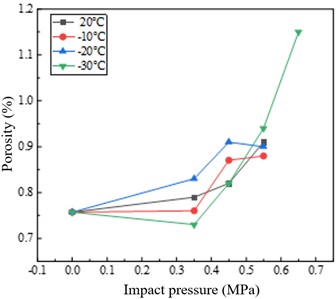
The porosities of the rocks under different test conditions were obtained by nuclear magnetic resonance (NMR) measurements, and scatter plots with fitted curves for the three rock types are presented in Figs. 4-6. In Fig. 7, 0 MPa represents the initial porosity of each specimen before impact, which is approximated here by the average porosity of three randomly selected specimens prior to testing. Only specimens that remained macroscopically intact after impact were subjected to NMR testing; specimens with visible cracks or fragmentation were excluded, because their pore structures would represent the post-impact failure state rather than the damage caused by a single impact. For example, in the relationship between porosity and impact pressure for yellow sandstone shown in Fig. 7(a), at room temperature (20 °C) the specimen maintained structural integrity only after the lowest impact pressure (0.35 MPa), while the specimens under other pressure conditions had already failed; therefore, porosity data for the other pressure conditions were not measured.
Fig. 5White sandstone porosity
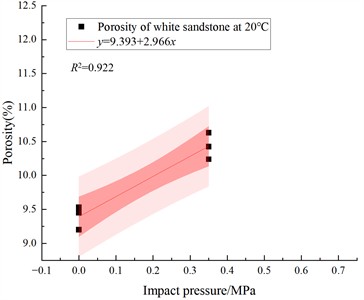
a) 20 ℃
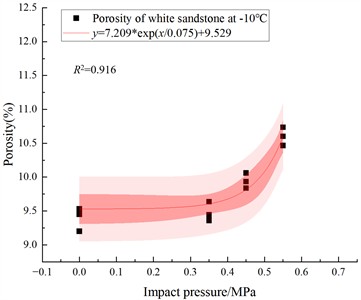
b) –10 ℃
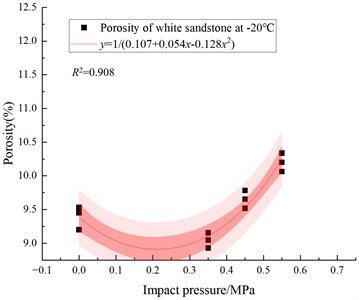
c) –20 ℃
d) –30 ℃
As shown in Fig. 7, the initial porosity of the three rocks in descending order is yellow sandstone, white sandstone, and granite, indicating that granite is the most compact, followed by white sandstone, while yellow sandstone is the loosest. Among them, the porosity variations of white sandstone and yellow sandstone are relatively large, with the most significant increase observed in yellow sandstone, reflecting that its internal structure is more susceptible to impact loading.
The influence of temperature on porosity evolution demonstrates that both sandstone varieties exhibit greater structural deterioration under room-temperature impact conditions, accompanied by a more pronounced increase in porosity. This phenomenon suggests that moderate cooling promotes the formation of a frozen internal structure, thereby improving the impact resistance of yellow sandstone and white sandstone to a certain degree. Nevertheless, further cooling to −30 °C reverses this trend, with both sandstone types showing higher porosity increments than those observed at −10 °C and −20 °C. This behavior may be attributed to the increased brittleness induced by extremely low temperatures, where thermal contraction and stress concentration facilitate the initiation and propagation of internal cracks, ultimately resulting in a more developed pore network. A comparable porosity evolution pattern is also observed in granite specimens subjected to the combined effects of severe cooling and relatively high impact pressure.
Fig. 6Granite porosity
a) 20 ℃
b) –10 ℃
c) –20 ℃
d) –30 ℃
Fig. 7Porosity changes of three pure rock specimens before and after impact
a) Yellow sandstone porosity
b) White sandstone porosity
c) Granite porosity
3. Dynamic mechanical properties of low-temperature frozen rock
3.1. Characteristics of stress-strain curves
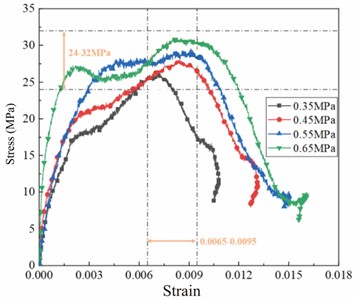
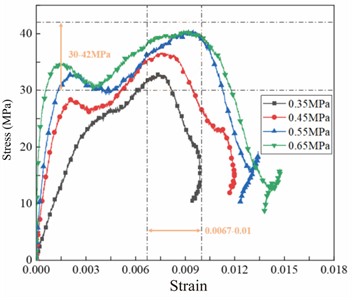
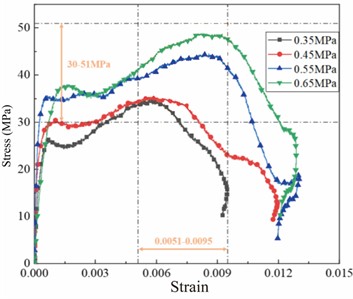
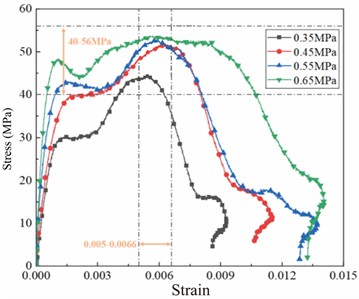
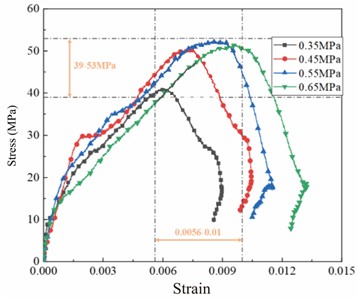
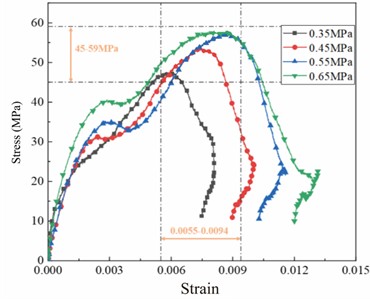
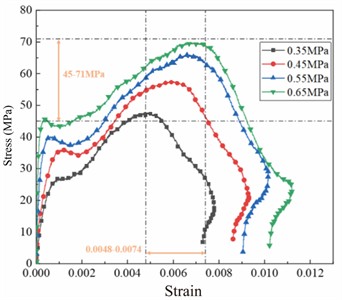
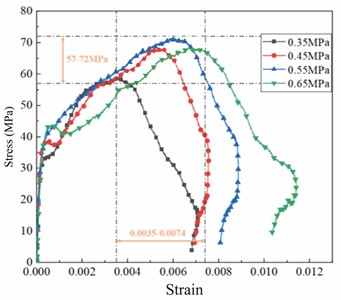
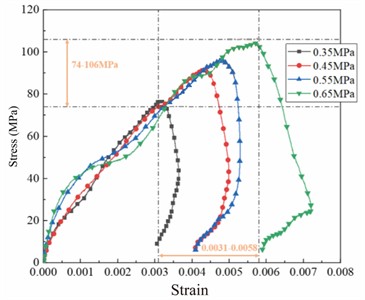
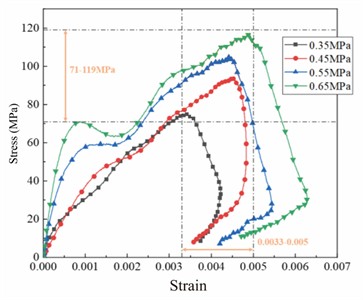
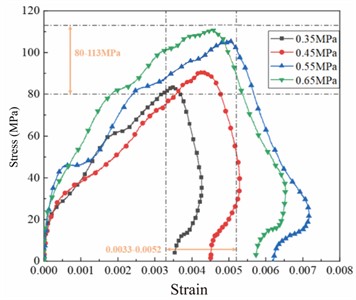
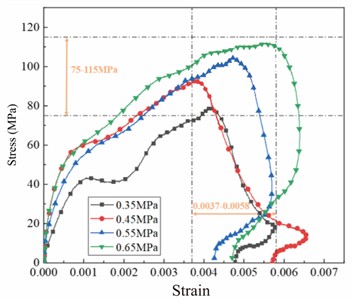
Based on Eq. (1), the valid data obtained from the SHPB test system can be used to compute the dynamic stress-strain curves of various rocks under different conditions. According to the post-impact state of the specimens and the variation characteristics of the curves, the stress-strain curves of the three lithologies (yellow sandstone, white sandstone, and granite) are plotted as shown in the Figs. 8-10.
Fig. 8Stress-strain curve of yellow sandstone specimen
a) 20 ℃
b) –10 ℃
c) –20 ℃
d) –30 ℃
The peak stress point marks the critical transition of rock from steady-state fracturing to unstable failure. The stress and strain at this point best reflect the material’s bearing capacity and deformation characteristics under specific temperature and strain rate conditions. As shown in Fig. 8, when the temperature ranges from 20 °C to –20 °C, the peak stress and the corresponding strain range under different impact pressures increase continuously; however, at –30 °C, this range narrows rapidly. Within the investigated temperature interval from 20 °C to –20 °C, yellow sandstone exhibits an increasing dependence on strain rate with decreasing temperature, indicating that its dynamic response becomes progressively more rate-sensitive under cooling conditions. However, a further reduction in temperature to –30 °C leads to a decline in the strain-rate strengthening effect, resulting in a reduced sensitivity of yellow sandstone to loading-rate variations.
Fig. 9Stress-strain curve of white sandstone specimen
a) 20 ℃
b) –10 ℃
c) –20 ℃
d) –30 ℃
As shown in Fig. 9, the variation characteristics of peak stress and the corresponding strain of white sandstone are strongly affected by freezing temperature. Compared with specimens tested at room temperature, those subjected to –10 °C and –20 °C exhibit a more concentrated peak region with an extended post-peak deformation stage. In addition, both the peak stress and the associated strain increase approximately linearly as the impact pressure increases. These observations indicate that moderate freezing conditions modify the dynamic deformation behavior of white sandstone and increase its dependence on loading rate.
Fig. 10 demonstrates that granite exhibits a relatively stable dynamic response at room temperature (20 °C), with variations in peak stress and the associated strain caused by different impact pressures being less pronounced than those observed in the two sandstone types. This indicates that the mechanical behavior of granite is less sensitive to temperature-related effects compared with sandstone under the investigated loading conditions. Under low-temperature conditions, the fissure structure in water-saturated sandstone specimens is markedly improved by the pore water-ice phase transition, leading to a substantial increase in mechanical strength. In contrast, owing to its inherently low porosity and low water absorption, although granite exhibits certain variations in its peak stress parameters, the magnitude of the temperature effect is notably smaller than that observed in the sandstone specimens.
Fig. 10Stress-strain curve of granite specimen
a) 20 ℃
b) –10 ℃
c) –20 ℃
d) –30 ℃
3.2. Dynamic mechanical properties
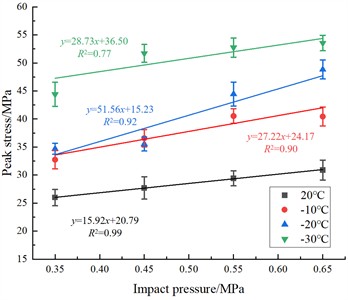
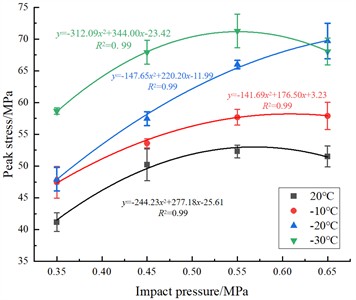
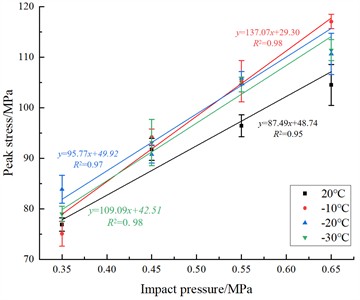
The effect of impact pressure on the peak stress response of the three rock types was evaluated under various temperature conditions. Fig. 11 summarizes the evolution of peak stress with increasing impact pressure. Within the range of 0.35-0.65 MPa, yellow sandstone and granite exhibited a progressive increase in peak stress, indicating a positive correlation between impact pressure and dynamic strength. White sandstone showed a similar tendency under most testing conditions; however, an exception occurred at –30 °C combined with an impact pressure of 0.65 MPa, where the peak stress deviated from the overall increasing trend.
In terms of the growth trend, the fitted curves for yellow sandstone and granite are well described by linear relationships, and the value of the linear fit for granite is closer to 1, indicating that granite most closely follows the linear variation trend. For white sandstone, although it does not satisfy linear growth well, its trend is can be well described by a quadratic relationship.
For yellow sandstone and white sandstone under the four different temperature conditions, as shown in Fig. 11(a-b), the data points and their corresponding four curves are clearly distinguished by peak stress, indicating a relatively strong influence of temperature. In contrast, although the data points and fitted curves of granite also exhibit certain variations with temperature, the degree of influence is considerably smaller.
Fig. 11Peak stress-impact pressure relationship diagram of three types of rock specimens
a) Yellow sandstone
b) White sandstone
c) Granite
To quantify the temperature-dependent variation in peak stress among rocks with different lithologies, the results obtained at an impact pressure of 0.55 MPa were selected for comparative analysis. The peak stress values under different temperature conditions were normalized against the corresponding values at room temperature (20 °C), and the temperature-induced increments and growth rates for the three rock types are summarized in Fig. 12.
Fig. 12Peak stress growth of three types of rock specimens under 0.55 MPa impact pressure with temperature influence
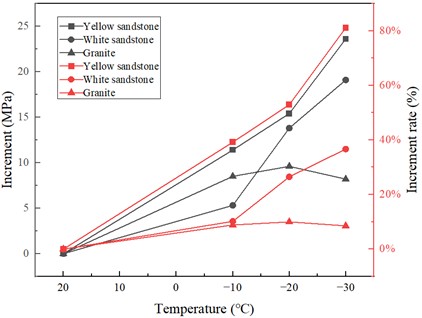
With progressive cooling, both sandstone types exhibit a gradual enhancement in peak stress, whereas the magnitude of this increase varies significantly among different lithologies. The temperature-induced strengthening effect follows the order of yellow sandstone, white sandstone, and granite, with yellow sandstone showing the most pronounced response and granite exhibiting the weakest variation. This is because under freezing conditions, the internal water in the specimens begins to freeze into solid ice due to the low-temperature environment. Although the strength of ice is lower than that of the rock matrix, the frozen state can fill the pre-existing pores inside the specimen, thereby better inhibiting the initiation of internal damage and the development of fissures under loading. Macroscopically, this enables the specimen to withstand higher stress without failure and significantly increases its peak stress. The different lithologies exhibit distinct water-storage capacities. Compared with granite, the sandstone specimens contain a larger amount of pore water under saturated conditions due to their higher initial water-holding capacity. Consequently, a greater volume of pore ice can be generated during freezing, which contributes to the filling of internal voids and enhances the bonding effect within the rock skeleton. Similarly, the porosity of the two sandstones is also much higher than that of granite. Under freezing conditions, the sandstone structure is “strengthened” to a greater extent, and the macroscopic manifestation is that sandstone is influenced by temperature factors much more significantly than granite.
4. Analysis of energy dissipation
4.1. Method of energy dissipation
According to the composition of the SHPB test system, the total energy (loading energy) during the entire test is the kinetic energy of the striker acting on the striker bar (projectile) when released under high-pressure nitrogen, denoted as . The energies carried by the incident stress wave, reflected stress wave, and transmitted stress wave collected in the test are , , and . In addition, the energy absorbed by the specimen under impact loading is . The above energies are generally calculated using the following equations, as expressed by Eqs. (4), (5), (6), and (7) [24]:
where , , and denote the longitudinal wave velocity, cross-sectional area, and elastic modulus of the elastic bar and , , and are the specific values of the incident stress wave, reflected stress wave, and transmitted stress wave collected and processed from the test at time [25].
According to the energy partition characteristics, the absorbed energy () is predominantly consumed by internal deformation and fracture processes of the specimen, accounting for approximately 95 % of the total input energy. In comparison, the energy associated with fragment separation and material ejection is relatively limited (5 %). Thus, only is considered in the subsequent fracture energy evaluation, while the minor energy components are neglected. The data calculated based on the above formulas are presented in the following Tables 3-5.
For the convenience of comparison and analysis of the relationships among the reflected energy , transmitted energy , and dissipated energy of the specimen, the corresponding proportions relative to the incident energy are analyzed [26].
Table 3Impact energy dissipation distribution of yellow sandstone
Temperature (℃) | Impact pressure (MPa) | (J) | (J) | (J) | (J) |
20 | 0.35 | 55.36 | 33.30 | 3.40 | 18.65 |
0.45 | 79.31 | 51.40 | 4.45 | 23.46 | |
0.55 | 91.74 | 63.48 | 4.19 | 24.07 | |
0.65 | 104.43 | 73.93 | 4.81 | 25.70 | |
–10 | 0.35 | 51.12 | 29.28 | 5.17 | 16.66 |
0.45 | 73.25 | 42.03 | 6.87 | 24.35 | |
0.55 | 97.33 | 55.54 | 8.45 | 33.34 | |
0.65 | 116.17 | 67.28 | 8.84 | 40.05 | |
–20 | 0.35 | 52.80 | 26.68 | 6.75 | 19.37 |
0.45 | 72.61 | 42.09 | 7.25 | 23.26 | |
0.55 | 94.16 | 50.54 | 13.51 | 30.11 | |
0.65 | 100.86 | 53.19 | 10.92 | 36.75 | |
–30 | 0.35 | 54.27 | 26.46 | 7.97 | 19.84 |
0.45 | 80.59 | 40.88 | 11.26 | 28.45 | |
0.55 | 99.95 | 58.13 | 10.51 | 31.31 | |
0.65 | 124.35 | 59.81 | 16.02 | 48.51 |
Table 4Impact energy dissipation distribution of white sandstone
Temperature (℃) | Impact pressure (MPa) | (J) | (J) | (J) | (J) |
20 | 0.35 | 54.31 | 23.65 | 8.00 | 22.66 |
0.45 | 76.08 | 31.27 | 12.18 | 32.62 | |
0.55 | 89.61 | 39.14 | 13.37 | 37.10 | |
0.65 | 104.66 | 50.69 | 11.52 | 42.45 | |
–10 | 0.35 | 53.39 | 19.99 | 11.06 | 22.34 |
0.45 | 74.05 | 31.34 | 13.07 | 29.65 | |
0.55 | 93.07 | 40.34 | 14.87 | 37.87 | |
0.65 | 113.40 | 51.04 | 15.35 | 47.01 | |
–20 | 0.35 | 51.04 | 18.20 | 10.82 | 22.02 |
0.45 | 75.93 | 26.50 | 16.27 | 33.16 | |
0.55 | 95.63 | 32.59 | 21.57 | 41.46 | |
0.65 | 114.23 | 43.77 | 21.70 | 48.76 | |
–30 | 0.35 | 56.75 | 14.72 | 16.79 | 25.25 |
0.45 | 76.40 | 18.07 | 24.19 | 34.14 | |
0.55 | 94.23 | 24.68 | 27.21 | 42.34 | |
0.65 | 109.85 | 40.16 | 22.60 | 47.09 |
Table 5Impact energy dissipation distribution of granite
Temperature (℃) | Impact pressure (MPa) | (J) | (J) | (J) | (J) |
20 | 0.35 | 46.64 | 4.80 | 27.77 | 14.07 |
0.45 | 73.94 | 9.29 | 40.09 | 24.56 | |
0.55 | 85.48 | 11.84 | 44.73 | 28.91 | |
0.65 | 109.16 | 19.60 | 50.42 | 39.14 | |
–10 | 0.35 | 49.68 | 5.68 | 26.60 | 17.39 |
0.45 | 78.07 | 12.98 | 36.63 | 28.46 | |
0.55 | 97.68 | 11.78 | 55.12 | 30.78 | |
0.65 | 118.13 | 15.37 | 66.15 | 36.61 | |
–20 | 0.35 | 57.44 | 6.66 | 33.09 | 17.69 |
0.45 | 80.47 | 10.66 | 38.98 | 30.83 | |
0.55 | 101.05 | 16.96 | 48.10 | 36.00 | |
0.65 | 116.79 | 13.91 | 59.58 | 43.30 | |
–30 | 0.35 | 57.48 | 12.04 | 25.51 | 19.92 |
0.45 | 76.49 | 14.30 | 35.85 | 26.35 | |
0.55 | 103.91 | 13.61 | 55.13 | 35.17 | |
0.65 | 135.21 | 15.62 | 71.35 | 48.24 |
The formulas for the proportions of the three energies to the incident energy are as follows:
where is the reflected energy proportion, is the transmitted energy proportion, and is the dissipated energy proportion of the specimen.
4.2. Comparison of energy evolution of three frozen rocks
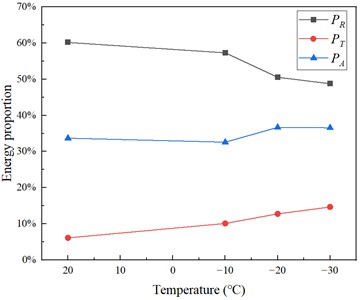
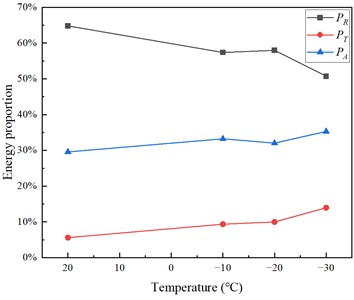
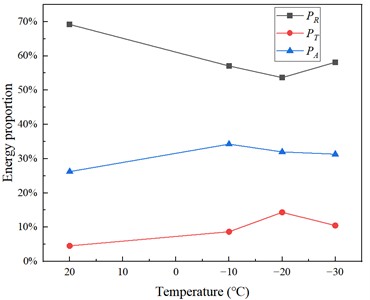
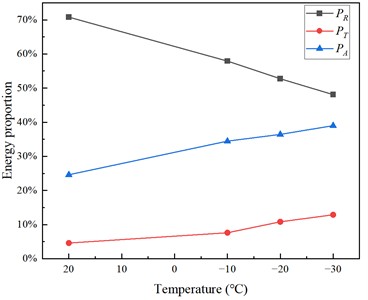
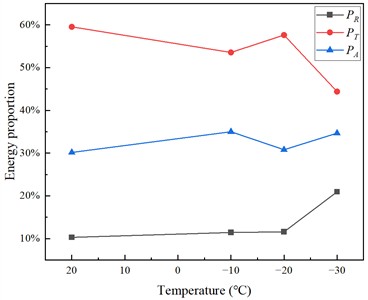
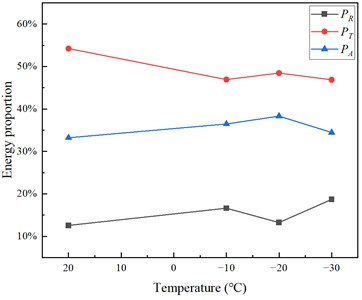
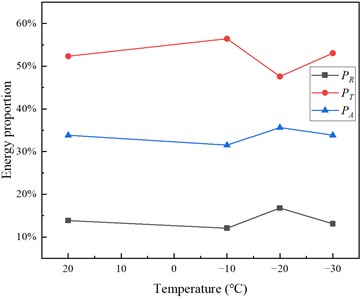
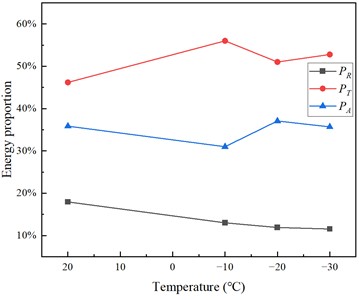
According to Eqs. (8-10), the images of , , and as proportions of the incident energy, denoted as , , and respectively, for yellow sandstone, white sandstone, and granite are plotted.
For yellow sandstone under different impact pressures, the variation of the proportions of the three energies (reflected, dissipated, and transmitted) in the incident energy with temperature is as follows. Overall, accounts for the highest proportion, followed by of the specimen, while accounts for the lowest proportion.
Fig. 13Energy characteristic value relationship diagram of yellow sandstone specimen
a) 0.35 MPa
b) 0.45 MPa
c) 0.55 MPa
d) 0.65 MPa
Under different impact pressures, the energy distribution of yellow sandstone exhibits similar but slightly varying trends with decreasing temperature: generally decreases, generally increases, and increases modestly. At 0.35 MPa, continuously decreases from approximately 60 %, increases from about 6 % to about 10 %, and steadily rises as temperature decreases. At 0.45 MPa, decreases from 64.81 % to 50.72 %, increases from 5.61 % to 13.97 %, and increases from 29.58 % to 35.30 %. At 0.55 MPa, the first decreases from 69.20 % to 53.67 % at –20 °C and then rises to 58.16 % at –30 °C; increases from 4.57 % to 14.35 % and then decreases to 10.52 %; rises to 34.25 % and then remains generally stable at approximately 31.5 %, fluctuating between 26.24 % and 34.25 %. At 0.65 MPa, decreases from 70.79 % to 48.10 %; continuously increases from 4.61 % to 12.88 %; increases from 24.61 % to 39.01 %. As impact pressure increases, the initial value of becomes larger but its decrease becomes more pronounced, and the increase in is more significant. Moreover, at 0.55 MPa, there is a turning point where first decreases and then increases, while first increases and then decreases, indicating the existence of an optimal freezing temperature. At a high impact pressure of 0.65 MPa, continuously decreases, and both transmitted and dissipated energy proportions continuously increase, suggesting that low temperature and high strain rate synergistically enhance energy absorption and internal damage.
Fig. 14Energy characteristic value relationship diagram of white sandstone specimen
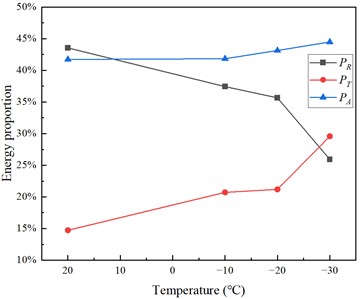
a) 0.35 MPa
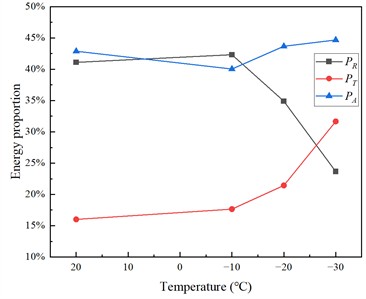
b) 0.45 MPa
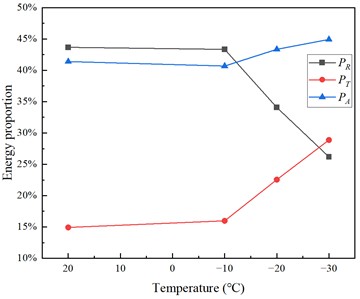
c) 0.55 MPa
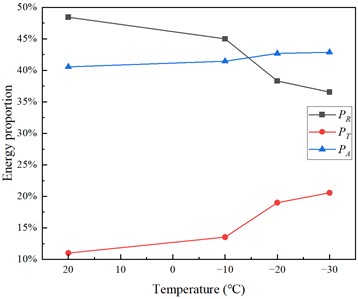
d) 0.65 MPa
The proportion of reflected energy to incident energy in yellow sandstone shows a gradually decreasing trend with increasing impact pressure, and this decreasing trend is more pronounced under freezing conditions. The proportion of transmitted energy is the lowest under all conditions, but it exhibits a slight increasing trend with decreasing temperature, indicating that the low-temperature environment has a certain but limited effect on the energy transmission capacity. The proportion of dissipated energy in the specimen increases with decreasing temperature, suggesting that the freezing environment enhances the brittle failure of yellow sandstone, causing the specimen to absorb more energy for internal damage; this trend is particularly evident under high impact pressures.
Under different impact pressures, the energy distribution of white sandstone exhibits a consistent trend with decreasing temperature: generally decreases, continuously increases, and gradually increases under moderately low temperature conditions. A detailed comparison shows that at 0.35 MPa, PR decreases from 43.55 % to 25.93 %, increases from 14.73 % to 29.59 %, and increases slightly from 41.72 % to 44.48 %. At 0.45 MPa, first increases slightly from 41.11 % at 20 °C to 42.32 % at −10 °C and then decreases to 23.65 %; increases from 16.01 % to 31.66 %; first decreases from 29.58 % at 20 °C to 17.65 % at −10 °C and then rises to 31.66 %. At 0.55 MPa, decreases from 43.68 % to 26.19 %; increases from 14.92 % to 28.88 %; first decreases slightly from 41.40 % at 20 °C to 40.69 % at −10 °C and then increases to 44.94 %. At 0.65 MPa, decreases from 48.43 % to 36.56 %; increases from 11.00 % to 20.57 %; increases from 40.56 % to 42.87 %. With increasing impact pressure, the initial value of becomes larger but its decrease becomes more significant, while the increase in the transmitted energy proportion is relatively smaller. Although the dissipated energy ratio shows only a slight increase under the coupled action of elevated impact pressure and freezing conditions, its absolute value remains relatively high. The interaction between intense dynamic loading and low-temperature effects promotes energy dissipation within the specimen, resulting in enhanced damage accumulation and more severe failure.
Fig. 15Energy characteristic value relationship diagram of granite specimen
a) 0.35 MPa
b) 0.45 MPa
c) 0.55 MPa
d) 0.65 MPa
For white sandstone, decreases gradually with decreasing temperature, indicating that low temperature enhances the energy absorption capacity of white sandstone, allowing more energy to be utilized by the specimen. increases under all working conditions, and the improvement is relatively significant, suggesting that the elastic wave transmission capacity of white sandstone is enhanced at low temperatures, rather than being solely used for fragmentation and energy absorption. The proportion of dissipated energy reaches its maximum at the lowest freezing temperature under all impact pressures, indicating that the brittleness of white sandstone increases at low temperatures and more energy is converted into internal damage.
For granite specimens under different impact pressures, the variation of the proportions of the three energies with temperature is as follows. Unlike the two sandstones, granite exhibits the lowest , followed by of the specimen, and the highest proportion is . This is mainly attributed to the high strength of granite itself and its good wave impedance matching with the bars.
Within the impact pressure range of 0.35-0.65 MPa, the energy distribution of granite shows a clear contrast: transmitted energy always dominates, generally in the range of 45 %-60 %; remains stable at 30 %-35 %; is maintained at a low level of 10 %-20 % overall, but exhibits different temperature responses with varying impact pressure. At 0.35 MPa, PR surges to about 20 % at –30 °C, indicating that extremely low temperature enhances local reflection. At 0.45 MPa, fluctuates between 10 % and 20 %, while first increases and then slightly decreases at –30 °C. At 0.55 MPa, briefly rises to 15 %-20 % at –20 °C, with a corresponding decrease in transmitted energy; remains around 35 % at different temperatures. At 0.65 MPa, continuously decreases with decreasing temperature to about 10 %, and remains stable at 45 %-55 %. Except for slight fluctuations in reflected and transmitted energies at 0.55 MPa, the proportions of each energy vary only slightly under other conditions, indicating that the energy distribution of granite is only slightly affected by temperature, the dominant role of transmission remains unchanged, and the failure mode is relatively stable. Granite has the highest proportion of transmitted energy, indicating that its compact structure allows more wave energy to be transmitted rather than absorbed or reflected. Under the coupled effects of low temperature and high impact pressure, the dissipated energy of granite exhibits certain fluctuations; however, the variation amplitude is much smaller than that observed in sandstone, suggesting a stronger resistance of granite to impact-induced failure. Moreover, under high impact pressure, transmitted energy still dominates, demonstrating that even at extremely low temperatures, granite still exhibits good energy transmission capability rather than entering a complete failure mode.
Comparing the energy variations of the three rock types under low-temperature conditions reveals that the proportion of dissipated energy in yellow sandstone and white sandstone increases significantly, reflecting that low temperature enhances the brittleness characteristics of the two sandstones. This enables them to absorb more incident energy and convert it into the fracture energy required for internal damage and crack propagation. The observed tendency is further amplified at higher impact pressures, indicating the coupled strengthening contribution of strain-rate effects and low-temperature effects. In contrast, owing to its dense structure, extremely low porosity and water absorption, as well as favorable wave impedance matching with the steel bars, the energy partitioning of granite is dominated by transmitted energy. Since most of the incident energy is carried away through elastic wave propagation rather than being converted into fracture-related dissipation, the energy dissipation response of the specimen shows limited sensitivity to temperature variation. By integrating the energy characteristics of the three rock types, it can be concluded that lithology is the key factor determining the energy partitioning pattern – for rocks with lower wave impedance and higher porosity, the increase of at low temperatures is more significant and the brittleness enhancement effect is more pronounced; whereas for dense rocks with high wave impedance, energy propagates primarily through transmission, and the low-temperature influence is weak.
5. Discussions
The three types of frozen rocks exhibit pronounced lithology dependence in their dynamic mechanical response and energy dissipation characteristics. It is difficult to fully explain their nonlinear low-temperature strengthening behavior and differences in strain rate effects solely by macroscopic water absorption and porosity. In the frozen state, rock can be regarded as a multiphase composite material composed of mineral grains, pore ice, residual pore water, and pre-existing microcracks, and its macroscopic mechanical response is governed jointly by the stiffness matching among these phases, the interface bonding state, and the damage evolution path. The macroscopic water absorption mainly reflects the overall water-storage capacity of the rock, but it cannot characterize key microstructural features such as pore size distribution, pore connectivity, and the surface properties of mineral grains, whereas these factors directly affect the distribution of ice, the cementation efficiency, and the deformation and damage behavior of the ice–rock interface. Therefore, it is necessary to provide a microscopic-level explanation for the differences in low-temperature sensitivity among different lithologies based on three interacting mechanisms: pore-ice cementation, thermally induced damage evolution, and dynamic crack propagation.
Pore-ice cementation is a critical controlling mechanism for the low-temperature strengthening effect. Although ice exhibits a relatively lower stiffness compared with common mineral constituents of rocks, the continuous ice phase formed after freezing can restrict the relative sliding between mineral grains and enhance the integrity and shear resistance of the rock skeleton through adhesion within the ice–rock interfacial zone. The degree of this strengthening effect is closely related to the pore structure. In rocks with relatively high porosity and good connectivity, the ice phase tends to form a continuous distribution, effectively reinforcing the intergranular connections and thereby producing a more pronounced low-temperature strengthening effect. In contrast, for dense rocks, the freezable water content is limited, and the ice phase is mainly distributed in a small number of micro-fissures and local pores, with a restricted cementation range and therefore a relatively small strengthening magnitude. In addition, the mineral composition and the surface properties of the pores also affect the bonding state at the ice–rock interface. Sandstones containing clay minerals or carbonate cements usually possess higher surface activity and hydrophilicity, which improves the interfacial bonding between ice and mineral particles, consequently strengthening the cementation effect induced by pore ice.
The mismatch in thermal expansion behavior among different minerals generates internal thermal stresses, which progressively alter the microstructural damage evolution of the rock and counteract the strengthening contribution provided by ice cementation. During cooling, local stress concentrations are generated at grain boundaries due to the differing thermal expansion coefficients of various minerals. In rocks with a more complex mineral composition, such as granite, the differential thermal contraction between minerals such as quartz and feldspars tends to produce stress concentrations at grain-boundary regions and promote the initiation of intergranular microcracks. These thermally induced cracks can weaken the load-transfer paths formed by the ice phase, partially offsetting the strengthening effect. This is especially true under low-temperature and high-strain-rate conditions, where microcracks are more readily activated as damage initiation sites. In contrast, in some sandstones, due to their mineral composition and cementation characteristics, the differential thermal deformation between grains is relatively small, while the higher pore-water content facilitates the filling of microcracks and pores by the ice phase, thereby exhibiting a more stable low-temperature strengthening trend.
During dynamic impact, the progressive changes occurring within the ice-rock interfacial zone govern the macroscopic fracture behavior and energy dissipation response of the rock. Because the ice phase exhibits pronounced strain rate sensitivity, its mechanical behavior varies with the loading rate. At relatively low strain rates, the ice phase can relieve the stress concentration at crack tips through a certain degree of viscous deformation, so that the damage evolution manifests as more distributed microcrack propagation and energy dissipation through ice-phase deformation, and the rock exhibits higher deformability and energy absorption capacity. At high strain rates, however, the ice phase displays a more distinct brittle response, the ice-rock interface is more prone to debonding and local failure, the crack propagation velocity increases, and energy dissipation gradually becomes concentrated in the main fracture zone.
The inherent pore architecture of the rock governs the development trajectory of cracks and determines the corresponding energy dissipation mechanisms. In rocks with connected pores, the continuous ice phase, although capable of enhancing the overall bearing capacity, may also make the ice–rock interface a preferential zone for damage initiation due to differences in interfacial properties; once the ice phase fails, cracks can propagate rapidly along the interface. In rocks dominated by isolated pores, the crack propagation paths are more obstructed by mineral grains and require more frequent crack deflection and transgranular processes, which may generate higher crack propagation resistance and energy dissipation. The mesoscopic behaviors, such as sliding and debonding within the ice–rock interfacial zone and intergranular interactions, link the pore structure, the deformation characteristics of the ice phase, and the fracture resistance of the mineral skeleton, ultimately leading to pronounced nonlinear differences in the macroscopic mechanical response.
Fig. 16Frozen rock micro-mechanism diagram
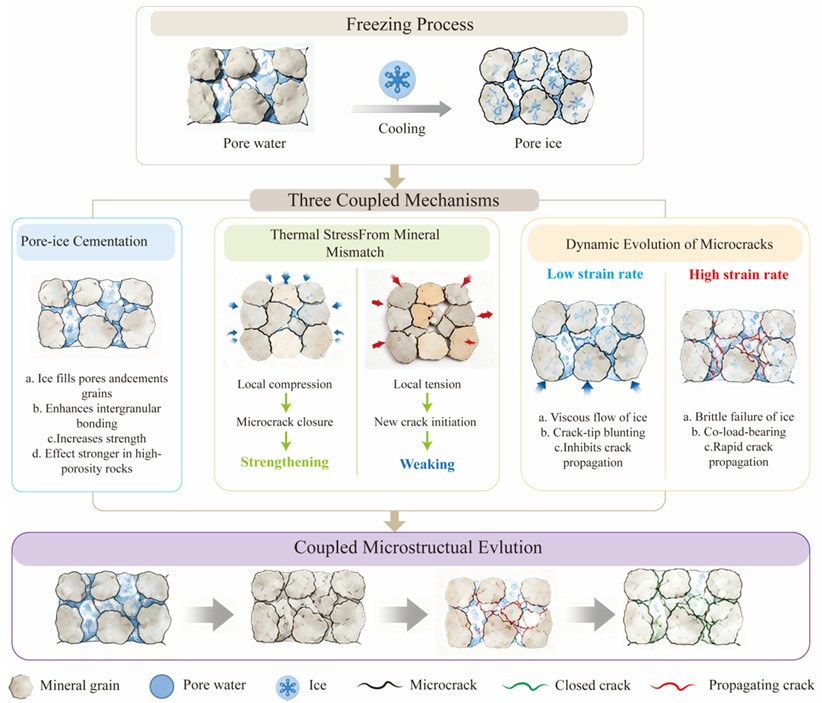
The nonlinear strengthening of rock mechanical properties and the differences in strain rate effects under low-temperature conditions are not determined by a single pore parameter, but are jointly controlled by the competition and coupling of multiple mechanisms, including “pore filling – ice cementation – thermally induced damage – loading rate effect”. Due to differences in mineral composition, pore structure, and interfacial properties among different lithologies, the dominant factors among these mechanisms vary, ultimately leading to significant differences in the degree of strength enhancement, strain rate sensitivity, and energy dissipation patterns. This study reveals the low-temperature dynamic differences among different lithologies based on macroscopic experimental responses [27]. Nevertheless, the underlying mechanisms still need to be further investigated by integrating multiscale approaches such as in situ low-temperature CT, acoustic emission source localization, and ice-rock coupled mesoscopic numerical simulation, so as to quantitatively analyze the relative contributions of each microscopic mechanism. This will facilitate the establishment of a theoretical system of low-temperature rock dynamics that extends from the mineral scale to the rock mass scale. The frozen rock micro-mechanism diagram is shown in Fig. 16.
6. Conclusions
This study investigated yellow sandstone, white sandstone, and granite as the research objects. Based on a modified SHPB test system, dynamic compression tests were carried out under different low temperatures and impact pressures, and the strength and deformation characteristics as well as the energy dissipation patterns of the three frozen rocks under impact loading were systematically analyzed. The principal conclusions can be drawn as follows:
1) Freezing markedly increases the dynamic compressive strength of the rock. This strengthening arises from the transformation of pore water into ice, which fills internal voids and improves grain-to-grain bonding, together with thermally induced compressive stresses that promote microcrack closure. Moreover, rocks with greater water absorption capacity generally exhibit a more pronounced strengthening response. The peak stress of yellow sandstone exhibits a linear relationship with the impact intensity, white sandstone follows a quadratic growth, and granite also shows a linear relationship, indicating that lithology and pore structure control the strength enhancement effect.
2) In terms of the dynamic deformation response, the strain rate effects of the three rock types exhibit significant differences. For yellow sandstone, the strain rate effect is enhanced at temperatures above –20 °C but weakened at –30 °C. The strain rate sensitivity of white sandstone increases significantly in the frozen state. For granite, owing to its low porosity and low water absorption, the strain rate effect remains consistently weak under the influence of temperature.
3) The energy partitioning pattern is governed jointly by wave impedance and pore structure. Yellow sandstone exhibits the highest proportion of reflected energy, and cooling promotes a decrease in reflected energy and an increase in dissipated energy. For white sandstone, both the transmitted energy and the dissipated energy increase with cooling, and both exhibit low-temperature sensitivity. Granite has the highest proportion of transmitted energy, with energy being transferred primarily through transmission, and its energy partitioning ratios are only slightly affected by temperature.
4) The temperature sensitivity of the three rocks is highest for yellow sandstone, followed by white sandstone, and lowest for granite. The differences are attributed to their distinct water absorption capacities, degrees of water-ice phase transition, and wave impedances. Furthermore, it is also related to meso-mechanical mechanisms such as ice cementation and crack closure induced by thermal stress. Yellow sandstone exhibits the highest water absorption, with sufficient phase transition strengthening the rock matrix, resulting in the most pronounced temperature response. In contrast, granite possesses a compact structure and extremely low water absorption, leading to the weakest temperature sensitivity.
References
-
L. Shen et al., “Mechanical characteristics of frozen red sandstone,” Coal Mining Technology, Vol. 19, No. 2, pp. 9–12, 2014.
-
M. Xi, S. Yang, L. Pang, T. Lv, and L. Liu, “Experimental study on basic mechanical behaviors of sandy mudstone under low freezing temperature,” Journal of China Coal Society, Vol. 39, No. 7, pp. 1262–1268, 2014.
-
L. Xi, “Study on deformation characteristics and mechanical behavior of rock under low temperature freezing state,” Journal of Lanzhou University of Technology, Vol. 48, No. 2, pp. 21–27, 2022.
-
M. Xu, S. Liu, W. Pong, and X. Chang, “Experimental study on basic mechanical behaviors of rocks under low temperatures,” Chinese Journal of Rock Mechanics and Engineering, No. 12, pp. 2502–2508, 2006, https://doi.org/10.4028/0-87849-989-x.1479
-
T. Zhao, S. Yang, T. Ren, L. Han, and L. Jia, “Influence of temperatures on the mechanical properties of frozen saturated sandstone,” (in Chinese), Journal of Xi’an University of Science and Technology, Vol. 40, No. 6, pp. 996–1002, 2020, https://doi.org/10.13800/j.cnki.xakjdxxb.2020.0609
-
Y. Xu, Y. Fu, Y. Yang, W. Yao, K. Xia, and J. Peng, “Dynamic compression properties of a saturated white sandstone under ambient sub-zero temperatures,” Acta Geotechnica, Vol. 18, No. 8, pp. 4245–4260, 2023, https://doi.org/10.1007/s11440-023-01836-1
-
B. Ullah, Z. Zhou, D. Lin, and F. Liu, “Investigating the impact of freezing and thawing cycles on the dynamic fracture properties of red sandstone subjected to impact loading,” Theoretical and Applied Fracture Mechanics, Vol. 139, p. 105006, May 2025, https://doi.org/10.1016/j.tafmec.2025.105006
-
S. Yang, “A review on frozen rock mechanics,” Mechanics in Engineering, Vol. 31, No. 6, pp. 9–16, 2009.
-
N. Liu, Y. Yang, N. Li, S. Liang, H. Liu, and C. Li, “The stability issue of fractured rock mass slope under the influences of freeze-thaw cycle,” Scientific Reports, Vol. 14, No. 1, pp. 1–15, 2024, https://doi.org/10.1038/s41598-024-56346-1
-
C. Xu, H. Pu, and H. Sha, “Experimental study on dynamic mechanical behavior of frozen sandstone with different saturations,” (in Chinese), Coal Science and Technology, Vol. 51, No. 9, pp. 88–99, 2023, https://doi.org/10.12438/cst.2022-0989
-
J. Kodama, T. Goto, Y. Fujii, and P. Hagan, “The effects of water content, temperature and loading rate on strength and failure process of frozen rocks,” International Journal of Rock Mechanics and Mining Sciences, Vol. 62, pp. 1–13, Apr. 2013, https://doi.org/10.1016/j.ijrmms.2013.03.006
-
Y. Xi, Y. Wang, J. Yin, M. He, and S. Su, “Experimental study on the dynamic mechanical properties and evolution mechanism of low-temperature frozen sandstone under impact loading,” Cold Regions Science and Technology, Vol. 239, p. 104587, Jun. 2025, https://doi.org/10.1016/j.coldregions.2025.104587
-
M. Kang, J. Gu, and Q. Wei, “Mechanical properties of soft and hard interbedded rock under impact load,” (in Chinese), Journal of Central South University (Science and Technology), Vol. 54, No. 3, pp. 1062–1073, 2023, https://doi.org/10.11817/j.issn.1672-7207.2023.03.023
-
B. Wang, B. Li, B. Yin, D. Ma, Q. Yin, and G. Li, “Split Hopkinson Pressure Bar (SHPB) experiments on dynamic strength of water-saturated sandstone,” Chinese Journal of Rock Mechanics and Engineering, Vol. 29, No. 5, pp. 1003–1009, 2010.
-
Y. Li, Q. Xu, P. Xie, Y. Ju, X. Ma, and C. Han, “Failure experimental study on energy laws of rock under differential dynamic impact velocities,” (in Chinese), Journal of China Coal Society, Vol. 36, No. 12, pp. 2007–2011, 2011, https://doi.org/10.13225/j.cnki.jccs.2011.12.012
-
A. Althubaiti, F. Elasha, and J. A. Teixeira, “Fault diagnosis and health management of bearings in rotating equipment based on vibration analysis – a review,” Journal of Vibroengineering, Vol. 24, No. 1, pp. 46–74, Feb. 2022, https://doi.org/10.21595/jve.2021.22100
-
L. Wang et al., “Study on dynamic characteristics and energy dissipation of frozen rock with ice-containing structural plane,” (in Chinese), Safety in Coal Mines, Vol. 56, No. 4, pp. 127–135, 2025, https://doi.org/10.13347/j.cnki.mkaq.20231560
-
F. Gao, G. Yang, X. Xiong, P. Zhou, Z. Li, and L. Li, “Experimental study on the dynamic mechanical characteristics of slope rock under low-temperature conditions,” Chinese Journal of Engineering, Vol. 45, No. 2, pp. 171–181, 2023, https://doi.org/10.1016/j.tafmec.2022.103609
-
K. Liu and T. Wang, “Dynamic mechanical behaviours of frozen rock under sub-zero temperatures and dynamic loads,” International Journal of Rock Mechanics and Mining Sciences, Vol. 180, p. 105813, Jun. 2024, https://doi.org/10.1016/j.ijrmms.2024.105813
-
Y. Yang, S. Yang, G. Wang, Z. Fang, and L. Zhang, “Experimental study on dynamic mechanical properties of red sandstone under low temperatures,” (in Chinese), Journal of China Coal Society, Vol. 43, No. 4, pp. 967–975, 2018, https://doi.org/10.13225/j.cnki.jccs.2017.0816
-
E. Şafak, “Local site effects and dynamic soil behavior,” Soil Dynamics and Earthquake Engineering, Vol. 21, No. 5, pp. 453–458, Jul. 2002, https://doi.org/10.1016/s0267-7261(01)00021-5
-
P. Song et al., “Experimental investigation on the dynamic deformation behavior of various rocks using the electromagnetic loading split Hopkinson bar,” AIP Advances, Vol. 15, No. 8, p. 085132, Aug. 2025, https://doi.org/10.1063/5.0289700
-
Y. Xu, H. Xie, Q. Zheng, C. Li, and G. Yang, “Dynamic splitting mechanical properties and strength prediction model of freeze-thawed water-saturated sandstone,” Geomechanics and Geophysics for Geo-Energy and Geo-Resources, Vol. 12, No. 1, p. 46, 2026, https://doi.org/10.1007/s40948-026-01128-4
-
T. Budrys, V. Veikutis, S. Lukosevicius, R. Gleizniene, E. Monastyreckiene, and I. Kulakiene, “Artifacts in magnetic resonance imaging: how it can really affect diagnostic image quality and confuse clinical diagnosis,” Journal of Vibroengineering, Vol. 20, No. 2, pp. 1202–1213, 2018, https://doi.org/10.21595/jve.2018.19756
-
D. Xu, C. Mu, W. Zhang, and Z. Li, “Research on energy dissipation laws of coal crushing under the impact loads,” Shock and Vibration, Vol. 2021, No. 1, p. 5563196, Jun. 2021, https://doi.org/10.1155/2021/5563196
-
C. Liu, J. Zhang, H. Deng, Y. Lin, P. Li, and B. Ke, “Energy dissipation characteristics and failure patterns of freeze-thawed granite in dynamic flexural tension,” IEEE Access, Vol. 7, pp. 97793–97802, Jul. 2019, https://doi.org/10.1109/access.2019.2929867
-
J. Wu, H. Wang, Q. Zong, and Y. Xu, “Experimental investigation of dynamic compression mechanical properties of frozen fine sandstone,” Advances in Civil Engineering, Vol. 2020, No. 1, p. 8824914, Sep. 2020, https://doi.org/10.1155/2020/8824914
About this article

This study was financially supported by the projects (Grants Nos: 52574133, 52274071, 52404071) supported by NSFC, the Open Fund of Engineering Research Center of Underground Mine Construction, Ministry of Education (No. JYBGCZX2022107) State Key Laboratory of Mining Response and Disaster Prevention and Control in Deep Coal Mines (No. SKLMRDPC23KF10) State Key Laboratory of Mining Response and Disaster Prevention and Control in Deep Coal Mines (No. SKLMRDPC22KF06).
The datasets generated during and/or analyzed during the current study are available from the corresponding author on reasonable request.
Ying Xu: Methodology, Manuscript writing. Ying Xu, Chengjie Li, Qiangqiang Zheng, Kun Huang : Funding acquisition. Tianxiang Deng: Methodology and Manuscript writing. Ziyi Yang, Wentao Zhang: Draw and Verify experimental data. Qi An: Revise the manuscript and Data analysis.
The authors declare that they have no conflict of interest.

