Abstract
Most technical measuring and technological equipment, instruments and systems, such as having linear and circular scales, measuring transducers or numerically controlled machine tools have information measuring systems (IMS), that provide information on the position of the part of the machine or instrument and other measuring information. The IMS are calibrated against the reference standards of measure comparing their accuracy at some pitch of calibration. It depends on the adopted standards and methodical documentation of these machines or instruments.
1. Introduction
During calibration it is possible to determine only a limited number of values. An example of the results shows that during the accuracy calibration some larger values of the error can be omitted including significant ones. Therefore it is important to determine the information quantity on an object that was assessed thus providing more complete measurement during the calibration processes. It is especially important bearing in mind modern information measuring systems with smart transducers that can combine a wide range of data or measurement values reaching tens of thousands of numerical values. This is also important in view of traceability of the measurement as it can clearly indicate which part of the information was assessed during the measurement. More extensive assessment of the calibrated value is discussed in this paper.
There are three vertical branches covering the main constituents of data assessment evaluation. Two main branches of constituents are systematic and random, according to which most technical measurements are presented. Sampling characteristics are used more widely in chemical, medical and biological measurements. The same efforts are recently being made in the field of technical measuring systems. Considering the sampling evaluation strategy it seems to be quite effective to use information entropy together with systematic and random data evaluation.
Photoelectric, optical and electromechanical transducers are used for control and measurement of the strokes of machines and instruments and can be taken as an example of the information data on displacement generators. However they experience significant systematic errors when being applied in these machine systems with long displacement strokes. A technical solution incorporating the aforementioned advantage of lessening the indeterminacy of the measurement is through the use of multiple indicator heads with a short part of the scale which can be calibrated at very small steps with high accuracy [1]. The indicator heads of a measurement system must be placed in the path of a moving machine part in such a way that the measurement is limited only to the most precise part of the measuring system (scale), and the reading of the information is performed serially by using the heads placed along this path.
The research on the distribution of errors inside the calibration pitch along the measuring length of a linear translational transducer (LTT) has been performed [1, 2]. It is a multivalue measurement as the accuracy of the transducer is required to be known for every output digit. During the calibration it is possible to find out only a restricted number of values. The accuracy of a linear transducer was calibrated by changing the length of the calibration intervals. An example of the results shows that during the calibration of the accuracy with a larger pitch, some values of the error can be omitted, including significant ones (the 1st, 3rd steps of the 2nd measurement) [1, 3]. Therefore there is a need to determine the quantity of information on an object that has been estimated providing more complete measurement information during the calibration process.
2. Results of the measurements
More research has been made on the analysis of the positioning error variations for an LTT [4, 5]. The point at the beginning of the measurements has been changed at every 2 µm performing the calibration of the full length (400 mm) of the LTT with the pitch of calibration being 10 mm. Mean arithmetic values of the systematic error at every change of the beginning were analysed. A mean value at a displacement of the beginning of 2 µm, 4 µm, 6 µm and so on was determined and these values were compared between themselves. Empirical dispersions at these positions have been designated as , , ... . The confidence intervals have been evaluated by means of mathematical statistics. Empirical dispersions and are the largest, so they have been checked by statistical methods. It shows that the evaluations of empirical dispersions at spatial intervals , belong to the same random value entity. The values calculated have been obtained by using expressions:
where 6, 8; 1, 2, ..., 9, and:
where – the mean arithmetic value calculated ( 6, 8); – the estimate of the dispersion in the range of measurement; – the quantity of measurements; – the estimate of the dispersion in the range of measurement consisting of measurements.
The calculation of produces the results of 0.098 and 0.115. At the value of 0.99, the critical value is 0.212. The checking of at 0.99 and the degree of freedom () shows that the values do not exceed 2.807. It confirms the validity of the calculations performed and the fact that the differences received are not significant.
While analyzing two chosen cases with 4×10⁵ and 2×10⁶ messages, 10 values can be determined during measurement in the first case; 50 could be in the second case. The change in message quantity is and . The information uncertainty is expressed as the difference of information before receiving a message and after receiving it. In both cases the information quantity is:
The same applies to the case as well. As the number of values determined during measurement approaches the total number of available values to be measured, any additional informational value from extra measurements becomes less and less valuable; in other words, it approaches zero. If no or few values are determined from the totality of values to be measured, additional measurements carry a lot of weight. The relative change in the information uncertainty of measurement systems can be calculated using formulas (3), (4) by expressing it through [6-8]:
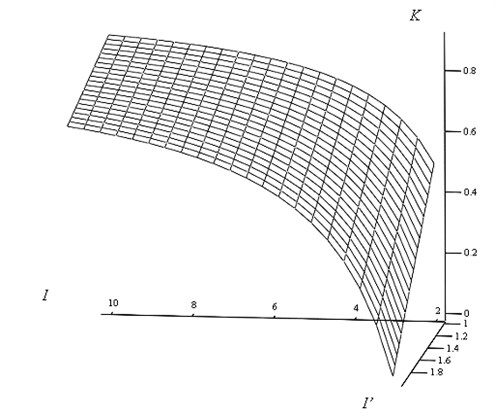
where 1, 2. The same is performed with . Its graphical representation is provided in Fig. 1. Naturally, the ratio decreases as more and more data out of the total available quantity of data is evaluated, and, vice versa, the ratio indicates the increase in uncertainty as the number of calibrated strokes in case of measurement scales decreases in relation to the total number of strokes on the scale.
Fig. 1The illustration of the coefficients K showing the relative quantity of information gained from additional measurements
The coefficients are calculated from the data present:
Calculations are performed to the sixth significant digit, since some results differ only at the sixth digit (Table 1). The relative information change for the same systems after measuring it is vanishingly small; the fact is shown by the coefficients and .
The calculations presented in the Table 1 indicate an insignificant decrease in the information uncertainty in each system. This change is significantly large when comparing both systems with each other (for example, the information entropy of both systems after measurement is 5.60205 and 6.30102). It indicates that in this respect it would be more effective to measure longer travels by using a linear transducer of shorter length.
Table 1Information quantity
Parameter | 400 mm | 2000 mm |
5.60206 | Text | |
1.0 | - | |
5.60205 | - | |
- | 6.30103 | |
- | 1.69897 | |
Text | 6.30102 |
More evident would be a dependence of the parameters in consideration when showing them by diagrams of the type presented in the figure. Fig. 1 shows the dependence of coefficients relative to the quantity of information gained from additional measurements, for example, during the calibration of the scales or machine’s displacement length.
The symbols in Fig. 1 are the same as in the Table 1. The 3D graph shows more sharp changes at low numbers of coefficients , thus enabling to make conclusion on significance of this parameter. This is also important in view of traceability of the measurement and other evaluation processes as it can clearly indicate which part of the information was assessed during the sampling and parameters’ determination operations.
3. Conclusions
A measure of information quantity – entropy – can be used to estimate the portion of the data used out of the total volume of data. It can be successfully applied to the technical measuring systems as accuracy of those systems is determined at some chosen intervals, leaving a great quantity of data unknown.
A technical solution to decrease systematic errors in information measuring systems with great quantity of data – on long displacement strokes, is analyzed by using a restricted part of data from information measuring system. That data can be thoroughly investigated and applied for significant improvement of accuracy of this system – the improved system could be built based on the theorical calculations presented in the paper.
References
-
Giniotis V. Position and displacement measurements. Vilnius, Technika, 2005, 215 p., (in Lithuanian).
-
Giniotis V., Šiaudinytė L., Bručas D. Arrangement for vertical angle calibration of geodetic instruments. Mechanika, Kaunas, Technologija, 2009, Vol. 5(79), p. 59-62.
-
Bernstein J., Wechenmann A. Measurement uncertainty evaluation of optical multi-sensor-measurements. Measurement, Vol. 45, Issue 10, December 2012, p. 2309-2320.
-
BIPM, IEC, IFCC, ISO, IUPAC, OIML. Guide to the Expressions of Uncertainty in Measurement. ISO Publishing, 1995.
-
Giniotis V., Grattan K. T. V., Rybokas M., Kulvietienė R. Uncertainty analysis using information entropy. VDI – Berichte, No. 1860, 2004, p. 505-510.
-
Ash R. B. Information Theory. Dover Publications, New York, 1990.
-
Nanda A. K., Paul P. Some results on generalized residual entropy. Information Sciences, Vol. 176, Issue 1, 2006, p. 27-47.
-
Robert-Nicoud Y., Raphael B., Smith I. F. C. Configuration of measurement systems using Shannon’s entropy function. Computers and Structures, Vol. 83, Issue 8-9, 2005, p. 599-612.
About this article

This research is funded by the European Social Fund under the Project No. VP1-3.1-ŠMM-07-K-01-102.
