Abstract
In this study, a novel application of a wavelet packet energy-weighted support vector machine (WPE-WSVM) is proposed to perform fault classification of helicopter rotor. Because the helicopter rotor fault signal is weak, it is difficult to extract fault feature. The wavelet package is adopted to decompose the vibration signals on the fuselage into different frequency bands, and to eliminate the noise. And then single signal was reconstructed to extract the energy in each frequency band serving as fault feature vectors. And support vector machine was applied for classifying the failure mode of the helicopter rotor. For classification task support vector machine is used due to its good robustness and generalization performances. But the classification accuracy of standard support vector machine is relative slow when the number of samples of different classes is dramatically different. So a fuzzy weighted support vector machine was proposed, which added weight coefficient to samples of different classes. A comparative analysis of standard support vector machine and proposed fuzzy weighted support vector machine is done. The proposed fuzzy weighted support vector machine improved the classification accuracy of class with fewer samples. The proposed method is sufficiently accurate, fast, and robust, which makes it suitable for use in helicopter rotor fault diagnosis applications.
1. Introduction
According to the helicopter rotor failure mechanism, the global failure of the rotor may lead to the increase of fuselage vibration signal at fundamental frequency and doubling frequency, while the other frequency band signal belongs to noise signals [1]. In order to extract fault features effectively, in this paper, wavelet package was used for reducing noise in the fuselage vibration signal firstly, and only signals in the concerned frequency band were retained, and signals in other frequency band were set to zero. Then reconstructed signal and extracted different frequency band energy serving as the feature vectors.
Because the number of helicopter failure samples is extremely insufficient, the traditional Artificial Neural Networks (ANN) fault classifier presents a number of drawbacks, such as poor generalization capability, overfitting and local minima[2]. Support Vector Machine is a relatively new computational supervised learning method based on Statistical Learning Theory and combines fundamental concepts and principles related to learning, well-defined formulation and self- consistent mathematical theory. Unlike to most classification methods, SVM do not require a large number of training samples (Burges, 1998; Gunn, 1998). Moreover, the SVM method can solve the learning problem even when only a small amount of training samples is available. As a statistical learning theory, Support Vector Machine has an ability to get the optimal solution under the existing information rather than obtain the optimal value when the sample size is approaching infinite [2-8]. Due to the fact that it is hard to obtain sufficient helicopter fault samples in practice, in this paper, the support vector machine is applied in helicopter rotor fault diagnosis because of its high accuracy and good generalization for a small number of samples.
In this paper, SVM is used to establish the mapping relationship between the wavelet energy spectrum of the fuselage vibration and the rotor fault type, eventually, and achieve unbalance fault diagnosis of the helicopter rotor.
SVM is an excellent way in solving the small sample classification problems, but there are still theoretical limitations [3-9]. For the purpose of improving the accuracy of fault diagnosis, the standard SVM requires that the number of two types of samples be roughly equal, and that the sample data be accurate and reliable. The misclassified proportion of the small sample size is higher than that of the large sample size. However, in the helicopter fault diagnosis, the sample sizes of two types are unbalance, and usually normal samples are much more than abnormal samples. Therefore, the standard SVM is not suitable for direct application in the helicopter fault diagnosis.
Standard SVM has lower classification accuracy in the case of sample size imbalance, this paper proposed a Fuzzy Weighted Support Vector Machines (FW-SVM) for helicopter rotor fault diagnosis, in which different weight is added to two types of different samples. Based on standard SVM, FW-SVM assigns a fuzzy membership degree to different classes as weight values according to sample sizes and also assign a fuzzy membership degree to each different sample as weight value according to the importance of samples, to dealing with the classification inaccuracy caused by samples imbalance and unimportant samples improving the classification accuracy. This method improves the classification accuracy and diagnostic accuracy, and achieves the fault diagnosis of rotor system with high precision in the case of small samples.
2. Feature extraction based on wavelet packet energy spectrum
The purpose of the feature extraction process is to select and retain relevant information from original signals. Because, the wavelet transform (WT) provides both the frequency and spatial locality. In WT, the families of wavelets such as Daubechies are used. The scaling functions of WT decompose the original signal into various subbands such as lower pass filter and high-pass filter. In WT, the decomposition process is repeat performed to the low-frequency subband to compose the next level of the hierarchy. Wavelet package transform (WPT)is an extension of WT and it turns out that the WT is only one of the much possible decomposition that could be performed on the signal. Instead of just decomposing the low-frequency component, it is therefore possible to subdivide the whole time-frequency plane into different time-frequency pieces.
The wavelet package transform of is as below:
In which, is signal function, is the wavelet function, is scaling function, is the scale of the decomposition, is translation factor, is the signal integration interval. ,, respectively, is the th wavelet coefficient of low-frequency and high-frequency decomposition.
According to Parseval equation:
Eq. (2) shows that the square of the wavelet transform coefficients has the dimension of energy. So the vibration signal is decomposed into different independent frequency band by using wavelet package transform. These signals under different frequency band contain a large number of non-stationary nonlinear diagnosis information relative to FFT spectrum, which is more valuable for fault diagnosis. Thus the signal energy of each frequency band can be used as the feature vector to represent the operation state of equipment [9, 10], and the wavelet packet can be used for energy feature extraction of helicopter rotor fault diagnosis.
3. Fuzzy Weighted Support Vector Machines (FW-SVM)
Taking the linearly inseparable situation as example, the fuzzy membership is introduced into the samples as a weight, set the importance of a sample relative to a certain category as (). From the perspective of fuzzy mathematics, is a fuzzy membership degree to a certain type. Generally, means that the sample is very important for this class, oppositely, means that the sample is not important for this class or even meaningless; in fact, can be regarded as the degree of attachment for to a certain category, and is the meaningless extent.
For example, add the fuzzy membership degree to samples:
is a value greater than zero.
Then the optimal hyperplane problem (3) has evolved into the optimization problem as follows:
In Eq. (4), the fuzzy membership degree is the weight of the sample, indicating the belonging degree of to a certain category, which is the degree of importance. is the weight of the class , , indicating that the sample size of the jth class is relatively small. Parameter is a variable representing the misclassified degree, is the geometric losses of the misclassification. In FW-SVM, is a variable representing the misclassified degree of samples for different significant. The meaning of is the actual loss of the misclassification, which reflects the combination of the structural risk minimization and empirical risk minimization. FW-SVM and standard SVM are identical while and are set to 1. In this way, the classification accuracy is influenced by class weights and sample weights. Set the weights of this type when sample size of a certain class is small; when a sample has a negative impact on the decision-making, set a relatively small fuzzy membership degree for this sample; when a sample is particularly important for decision-making, set a big fuzzy membership degree for the sample. Thus, the misclassification is avoided and the reliability of the classification is improved.
The free variable in the SVM is used to control the classification interval and the number of misclassified samples ( approaches infinite when misclassified samples is not allowed.). In the FW-SVM, we can set as a relatively large value in order to reduce the number of misclassified samples.
In order to solve this optimization problem, construct the Lagrangian equation according to Eq. (15):
Calculate derivatives of each parameter in Eq. (6):
Plug all above equations into the Lagrange equation (5), problem (4) can be converted into the following dual problem:
where the input sample corresponding to is called the support vectors. There are two kinds of support vectors: one is the sample corresponding to , which distributes in the edge of the hyperplane, and the other support vector is the sample corresponding to , which is misclassified samples.
Thus the optimal decision function is:
where is the sign function, is the number of support vectors, and is the classification threshold.
The biggest difference between the standard SVM and the FW-SVM is the existence of and, the support vector corresponding to in SVM may be different from the support vector in the FW-SVM. FW-SVM turns to SVM while and are set to 1. The importance of the sample can be controlled by different, and a small makes the corresponding input sample become relatively unimportant. Moreover, the uneven compensation of samples can be achieved by different class weights . The performance of uneven compensation of the class weight will be discussed in detail below.
4. Diagnostic test results of helicopter rotor fault
In this paper, the vibration data of the mass imbalance fault, the aerodynamic imbalance fault and the normal state was decomposed by wavelet packet to extract the fault feature vector. 113 groups of test data in different flight states are obtained, including: the number of samples of the mass unbalanced fault is 20; the number of samples of the aerodynamic unbalanced fault is 18, the number of samples of initial installation angle fault is 15 and the normal data is 60. In flight, the vibration signal of helicopter rotor spindle was collected. The rotor speed is about 386 r/min, the rotor spindle frequency is 6.4 Hz and the length of the data is = 5120. The wavelet package was used to extract the energy spectrum of each band as the feature vector.
After the signal was de-noised, the wavelet energy was calculated. In order to verify the effectiveness of the fuzzy weighted SVM algorithm, a comparative analysis of standard support vector machine and proposed fuzzy weighted support vector machine is done.
According to the extracted fault feature vectors, the whole samples set can be divided into the training sample and the testing sample. For the convenience of training, all the fault samples were put together as a category and normal samples as another category.
Select quadratic polynomial as the kernel function, and let = 1500. standard SVM classification results are shown in Figure 1. The “*” signs represents the fault sample, the “+” signs represents normal sample and the solid line represents the projection of classification surface. It can be seen that the “red * sample A” belonging to the fault sample was wrongly divided into the normal sample, which is mainly caused by the unbalance number of normal samples and failure samples. It can be seen that the standard SVM algorithm correctly classify four fault samples and two normal sample, but incorrectly classify another minor fault sample as the normal state.
Fig. 1Classification results of SVM
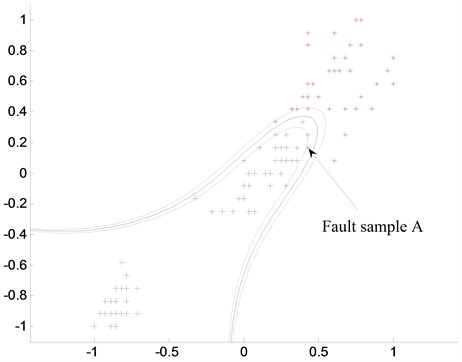
Fig. 2The classification results of FW-SVM
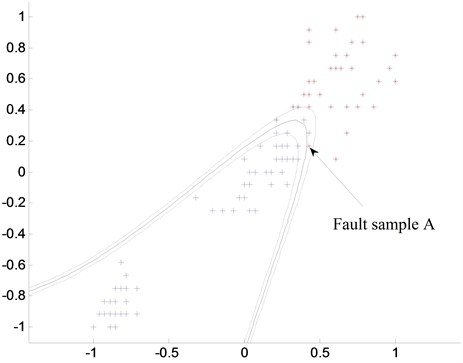
Adopting the FW-SVM algorithm to classify the samples, the proportion of normal class weighting coefficients and fault class weighting coefficients is inversely proportion of the sample size of these two types.In practical applications, the general requirement is that fault samples can be detected out completely while some normal samples can be classified as fault samples. And the other category contains only normal samples without including any failure samples, whose misclassification loss is small. Also it showed that the degree of attention of fault samples is greater than that of normal samples. Therefore, set the fuzzy membership degree of all fault samples as 0.9, the fuzzy membership degree of the normal sample as 0.6. Adopt Quadratic polynomial as the kernel function: , = 1500, classification results of FW-SVM are shown in Figure 2. It can be seen from Figure 2 that when the FW-SVM is used, the classification range of normal samples is narrowed, the fault sample A is correctly assigned to the area of fault samples, and normal samples no longer contain the points of fault samples.
From the classification results, we can see that after adding weights to the fault samples and normal samples, the classification surface is biased in favor of the normal state. At this time, the minor fault test sample is divided into the failure state, of which a normal sample was misclassified into the failure category. This is the embodiment of the basic idea of the FW-SVM algorithm: the relatively small losses caused by misclassification of normal samples and attaching importance to the fault data processing.
5. Conclusions
This paper proposed a fuzzy weighted support vector machine (FW-SVM) combining support vector machine and fuzzy theory, the analysis result of test data showed that:
1) Compared with the standard support vector machines, the fuzzy weighted support vector machine improves anti-jamming capability by adding weighting factor of samples to the fault diagnosis.
2) The fuzzy weighted support vector machine can improve the classification accuracy of class with fewer samples by adding different weights to samples of different fault types.
References
-
Goumas S. K., Zervakis M. E. Classification of washing machines vibration signals using discrete wavelet analysis for feature extraction. IEEE Transactions on Instrumentation and Measurement, Vol. 51, Issue 3, 2002, p. 497-508.
-
Nello Cristianini, John Shawe-Taylor An Introduction to Support Vector Machines and Other Kernel-Based Learning Methods. MA, Cambridge University Press, Cambridge, 2000.
-
Vojislav Kecman Learning and Soft Computing-Support Vector Machines, Neural Networks and Fuzzy Logic Models. MA, The MIT Press, Cambridge, 2001.
-
VapNik V. N. Statistical Learning Theory. J. Wiley, New York, 1998.
-
VapNik V. N. The Nature of Statistical Learning Theory. Springer-Verlag, New York, 1995.
-
Weston J., Watkins C. Multi-Class Support Vector Machines. Department of Computer Science, University of London, London, 1998, p. 1-10.
-
Chih Wei Hsu, Chih Jen Lin A comparison of methods for multi-class support vector machines. IEEE Transactions on Neural Networks, Vol. 13, Issue 2, 2002, p. 415-425.
-
Vapnik V. N. Statistical learning theory. John Viley & Sons, Inc., New York, 1998.
-
Kressel U. Pairwise Classification and Support Vector Machines. Advances in kernel Methods-Support vector learning. MA, MIT Press, Cambridge, 1999, p. 255-268.
-
Platt J., Cristianini N., Shawe-Taylor J. Large Margin Dags for Multiclass Classification. Advances in Neural Information Processing Systems, MIT Press, Massachusetts, 2000.
-
Lin Chunfu, Wang Shengde Fuzzy support vector machines. IEEE Transactions on Networks, Vol. 13, Issue 3, 2002, p.464-471
About this article

This research was supported by the National Natural Science Foundation of China (Grant No. 61074083, 50705005, and 51105019), the Technology Foundation Program of National Defense (Grant No. Z132013B002), and by the Fundamental Research Funds for the Central Universities.
