Abstract
One of the most effective ways for investigating dynamic behaviour of mechanical and civil structures under service conditions is dynamic load testing. The outcomes of dynamic tests are vibration characteristics, and in particular modal parameters such as vibration mode shapes, frequencies, damping ratios. Dynamic diagnosis technique has been already used for many years in mechanical engineering. During the last decades a number of investigations have been performed introducing new dynamic monitoring techniques of civil infrastructures including bridges. Field experimental testing of new steel-concrete composite railway bridge was carried out to determine natural and forced vibration frequencies, corresponding mode shapes and damping ratios. The attention was focused on short-term dynamic monitoring of new innovative structure with the aim to investigate the implementation of sensor technique on real structures, to calibrate a FE model of the bridge that can be used for further simulations and as a result to give feedback to the design of similar structures. Field tests and numerical simulations were conducted using excitations induced by dropping a weight and by ambient traffic excitation loadings. Results of these investigations are presented in this paper.
1. Introduction
Dynamic testing of bridges is relatively recent condition monitoring technique and has been evolved during past few decades from the methods used in mechanical systems [1]. Dynamic monitoring of mechanical and civil structures have a common system demands, but structural system and loading conditions may differ significantly from each other. Especially civil structures have relatively low dynamic response frequencies compared to mechanical systems. Bridge as a system consists of a number of components including bridge super and substructures and their foundations, bearings, ballast, and rails having different stiffness and damping characteristics. The dynamic effects on any railway bridge due to moving traffic depend on the speed of the train, variations in axle loads and spacing, track irregularities. Environmental conditions, such as temperature, humidity, wind, solar radiation that vary with time can affect identification of modal characteristics. Consequently, variation of structural properties and dynamic excitations results in the effects of noise and uncertainties in the structural responses. FE modelling together with in-situ testing of a bridge is an effective tool for its reliable dynamic analysis.
During the last few decades numerous investigations have been performed and dynamic tests and monitoring systems of bridges more and more are employed in order to validate design conceptions, to evaluate condition state and overall performance of structures [1–4]. Variation of vibration modal parameters has received considerable attention in assessment of behaviour of bridges under high–speed trains [5–8] and in vibration based damage detection analysis [9–11].
In recent years, there has been also an increasing interest in the instrumentation systems for dynamic health monitoring of railway bridges. Currently, there are different monitoring techniques that can be used for structural evaluation of bridges [12–14]. In addition to traditional cable-based sensors, the wireless transceivers [15] or GPS (Global Positioning Systems) [16–18] for communication of sensor data can be mentioned.
In the present study new steel-concrete composite bridge was investigated. The attention was focused on short-term dynamic monitoring of new innovative structure with the aim to investigate the implementation of sensor technique on real structures, to calibrate theoretical bridge structure model that can be used for further simulations. Field tests and numerical simulations were conducted using excitations induced by dropping a weight and by passing the freight trains in the natural dynamic environment. Results of these investigations are presented in this paper.
2. Dynamic instrumentation method
Railway bridges as large civil engineering structures operating in complex loading and environmental conditions require of special monitoring systems to be used in field dynamic load testing of full-scale structures. Variation of structural properties and dynamic excitations results in the effects of strong noise and uncertainties in the structural responses that should be detected with today’s vibration measuring systems. In general, these systems consist of bridge instrumentation, signal processing, data transmission, and data analysis and interpretation.
In the present investigation Brüel&Kjær LAN-XI system has been applied for measuring of vibration parameters of real structure. Brüel&Kjær has a complete product portfolio to provide with the whole excitation and measurement chain to establish proof of quality according to most international standards (DIN, ISO, ASTM and etc.). Figure 1 presents the principal scheme of vibration measurement, data acquisition and processing tools. LAN-XI system consists of: I) portable equipment (3660–D) for collecting and processing of measured results; II) personal computer; III) seismic accelerometers (8344). The accelerometers were fixed to the control pads attached to the surface of the bridge superstructure.
Fig. 1Equipment used in the experiment
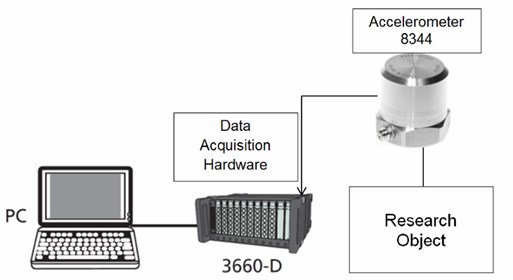
The collected test data has been analysed using Brüel&Kjær software programs to determine the main modal characteristics of the bridge superstructure: accelerations, mode shapes, frequencies of forced and free vibrations, damping ratios. The bridge response to dynamic excitation was measured as acceleration-time records. The measured acceleration response was filtered with a 30 Hz low-pass filter (according to LST EN 1990/A1/AC). Signals were transferred into the PULSE LabShop software.
Frequency contents are obtained for all recordings by Fast Fourier Transform (FFT). Resonant frequencies are directly obtained using pick picking method. The sampling frequency was set at 200 readings per second. The investigated frequency interval was selected based on preliminary FE simulations as 0–20 Hz from which more than three vibration modes could be identified (according to LST EN 1990/A1/AC).
3. Railway bridge and instrumentation program
The bridge was constructed in the railway line Kaunas–Kybartai over Šešupė River in the South-West of Lithuania in 2012. The bridge deck carries two railway tracks built on pre-stressed concrete sleepers and crushed stone ballast. The bridge is 52,40 m long and 11,82 m wide and has a single span with a length of 32 m. General view and main dimensions of the bridge are presented in Figs. 2–4.
Fig. 2General view of the bridge

Fig. 3Side view of the bridge
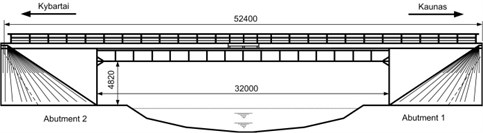
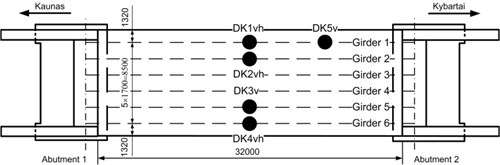
Fig. 4Layout of accelerometers for dynamic testing
The structural system of the bridge consists of composite steel-concrete deck rigidly fixed to the massive reinforced concrete abutments. Six main longitudinal welded plate steel girders are combined with stay-in-place deck panels and cast-in-situ reinforced concrete slab. Height of panels and slab are 150 mm and 380 mm, respectively. The bridge was designed in accordance with the LST EN 1994-2 specifications for composite steel-concrete bridges.
Field tests of the bridge were conducted using excitations induced by dropping a weight and by ambient traffic excitation loadings. During the tests vertical and horizontal lateral accelerations and displacements at mid-span of the girders 1, 2 and 6 have been measured by accelerometers DK1vh, DK2vh and DK4vh, respectively (Fig. 4). Moreover, for girder 5 data of vertical vibrations (accelerometer DK3v) were acquired. For observation of higher-order modes the accelerometer DK5v has been applied for measurement of vertical accelerations and displacement of girder 1 at approximately quarter-span. All dynamic tests were conducted during the same day, when the temperature was around +8–10°C.
4. Dynamic behaviour of the bridge
Impact excitation tests. The purpose of the impact vibration tests was to extract bridge resonant modes and corresponding frequencies to be used for comparison with those obtained from the ambient vibration test and by numerical simulation. During this test the modal parameters of the structure were identified without traffic on the bridge prior to starting the ambient tests under higher excitation levels.
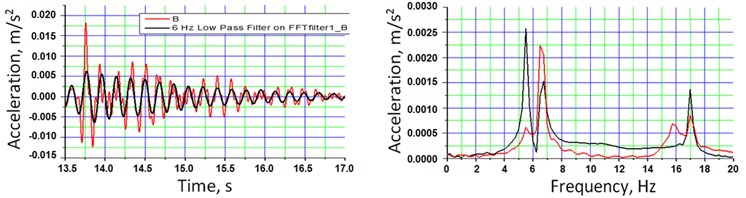
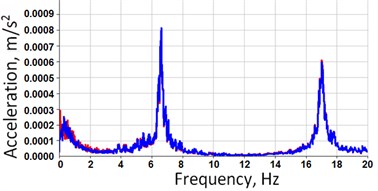
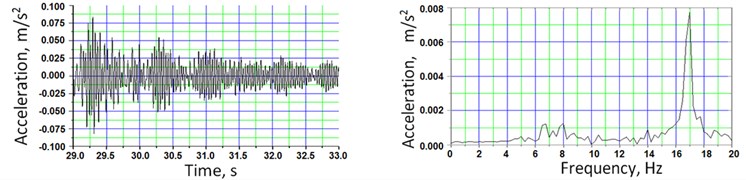
The bridge response to impact excitation was measured as acceleration-time records. During the tests peak acceleration reaches only nearly 0,04 m/s2. Despite this low excitation, distinct peaks in the frequency spectra are produced. Fig. 5 shows a typical acceleration time history along with the low-pass filtered data and corresponding frequency spectrum from an impact excitation. The basic parameters to be used for assessing the dynamic behaviour of the structure are generally the lowest natural modes. The frequency spectrum (Fig. 5a) showed four clear peaks at 5,53, 6,63, 14,65 and 17,03 Hz in the frequency range 0 to 20 Hz corresponding to the natural frequencies of the superstructure. In the lateral direction (Fig. 5b) only two peaks appear (at 6,63 and 17,03 Hz) with the dominant frequency of 17,03 Hz. The frequency component at 14,65 Hz although with low amplitude is present only in few vibrations recorded by accelerometer DK5v located approximately at ¼ of the span length. Observed modes can be classified as both bending and torsional modes of the deck. The repeatability of the frequency measurements was very good, with insignificant variation between successive readings in all 12 impact tests (COV is less than 0,5 %).
Fig. 5a) vertical and b) lateral acceleration time histories and corresponding frequency spectra (accelerometer DK1vh, DK5v) due to impact excitation
a)
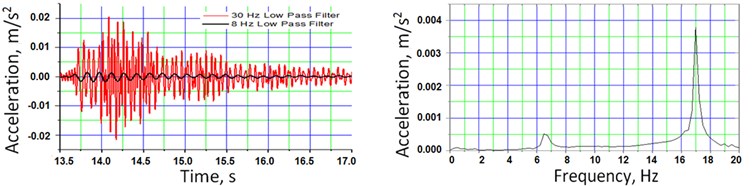
b)
It is recognized that the first fundamental vibration mode usually predominates the structures overall response. The first vertical bending natural frequency of the bridge deck can be predicted using the formula . This formula was obtained using expression for the mid-span deflection of both ends clamped beam. Computed deflection at mid-span due to permanent load 11 mm, then 5,48 Hz. The experimental frequency of the first significant peak agrees well with the first natural frequency determined according to present formula.
Using the logarithmic decrement method the modal damping ratio of the 1st (vertical bending) mode is = 2,287 %; = 0,281 %; = 12,27 % and that of the 1st torsional mode = 2,265 %; = 0,046 %; = 2,02 %. Using a narrow pass band filter around the third (lateral) natural frequency the modal damping ratio was found is = 0,567 %; = 0,024 %; = 4,22 %. As can be seen, the damping ratio depends on frequencies: when the frequency increases, the damping factor decreases. It seems that this is related to the amplitudes of vibration. The higher amplitudes in the lower modes increase internal friction in the ballast more than in the higher modes and as a result increasing the overall stiffness of the structure. The first modes of vibration have quite high damping ratios much more higher than recommended by the design standard LST EN 1991-2/AC (0,5 %).
Ambient traffic vibration tests. Ambient excitation loadings in the natural dynamic conditions by a random train crossing the bridge is widely used as dynamic monitoring technique without suspending the service of an operational bridge. The outcomes of ambient traffic dynamic tests are mode shapes, frequencies, dynamic displacements, and damping ratios.
The analysis of vibrations induced by freight trains was performed using two steps. In the first step, the entire time history during the train’s passage over the bridge (forced response) throughout the approximately 130-second acceleration record was considered. In the second step, only free vibration segment after the train had left the bridge was analysed. As an example Fig. 6 shows the vertical and lateral ambient vibration responses and the FFT (Fast Fourier Transform) of the bridge deck due to passing freight train on the track N2. Throughout the duration of testing, vertical peak accelerations at the mid-span section ranged from approximately 1,5 m/s2 to nearly 5 m/s2. After filtering the data at 30 Hz (according to LST EN 1990/A1/AC) the maximum vertical acceleration drops to 0,824 m/s2.
Fig. 6a) typical vertical and b) lateral acceleration time histories (accelerometers DK2v and DK2h) and c) frequency spectra for vertical vibrations (accelerometers DK1v-DK4v) and d) lateral vibrations (accelerometers DK1h and DK2h) due to ambient traffic excitation
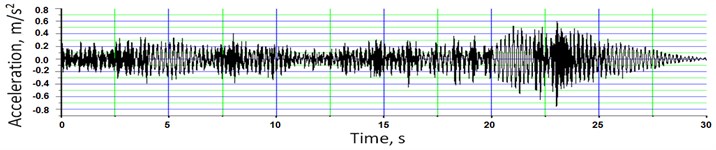
a)
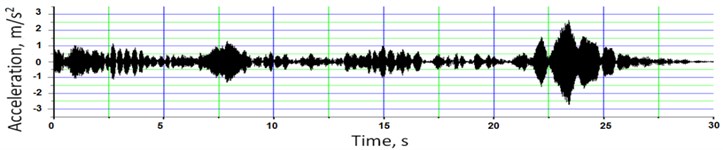
b)
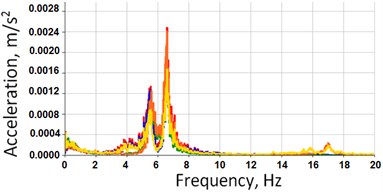
c)
d)
Each accelerometer recorded peak deflections as the freight trains were passing over the bridge (Fig. 7). The peaks coincide with the axle loads of the wagons. The larger magnitude of the peaks reflects the larger load on the axles. Having axle spacing and time between the peaks the trains speed were calculated. In all tests freight trains speeds were equal approximately from 55 to 60 km/h. The highest vertical displacement measured at the mid-span is 0,634 mm which is about 1/50500 of the span. The maximum lateral displacement of the deck is 0,130 mm, which is about 20 % of the maximum vertical displacement.
Fig. 7a) measured vertical and b) lateral dynamic displacement time histories at the middle span due to the passage of a cargo train (accelerometers DK1vh and DK4vh)
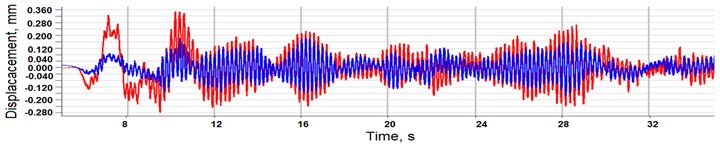
a)
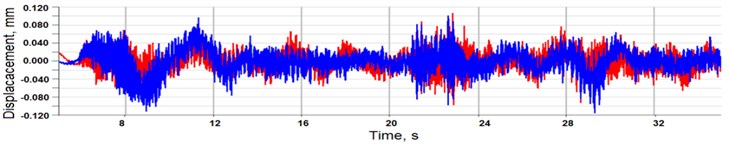
b)
In the frequency domain (Fig. 6c and d) we observed three dominant vertical and two lateral forced vibration frequencies of about 5,12–5,49 Hz, 6,49–6,60 Hz and 15,99–16,99 Hz.
Our experience showed that it is difficult to determine the exact time interval to obtain pure free vibrations of railway bridges due to the noise and influence of vibrations transmitted by rails, ballast and ground when the train had left the span. It is necessary to measure the accelerations at different time segments to get a pure free vibration of the structure. Figure 8 presents an example of vertical and lateral acceleration response for the free vibration phase. In the free vibration phase, three dominant modal response peaks (5,49 Hz, 6,49 Hz, and 16,99 Hz) could be easily identified. We observed that some lateral acceleration signals contains an amplitude beat related probably with a difference between global bridge deck behaviour and steel girder lateral vibration.
Fig. 8a) measured vertical and b) lateral acceleration time histories and corresponding frequency spectra from the response of ambient structural vibration, when the train had left the span
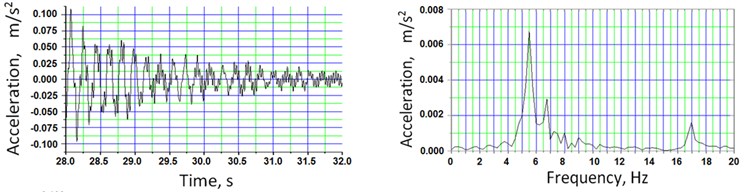
a)
b)
Statistical properties of natural frequencies and mode shapes extracted from train-induced forced and free vibrations are reported in Table 1. As can be seen due to the effect of the train mass the frequencies of loaded superstructure (the train on the bridge deck) are slightly lower but the variance is higher.
Table 1The frequencies of forced and free vibrations from the response of ambient traffic tests
Frequencies of forced vibrations | Frequencies of free vibrations | |||||
1 | 2 | 3 | 1 | 2 | 3 | |
Hz | 5,33 | 6,52 | 16,59 | 5,49 | 6,60 | 16,99 |
Hz | 0,158 | 0,056 | 0,509 | - | 0,132 | - |
, % | 2,96 | 0,86 | 3,07 | - | 2,00 | - |
Reliable estimation of damping ratios is known to be significantly difficult, so the damping ratio is computed only for the first fundamental bending frequency using relatively simple logarithmic decrement method. The modal damping ratio of the first (vertical bending) mode is = 1,916 %; = 0,275 %; = 15,94 %.
5. Finite element modelling
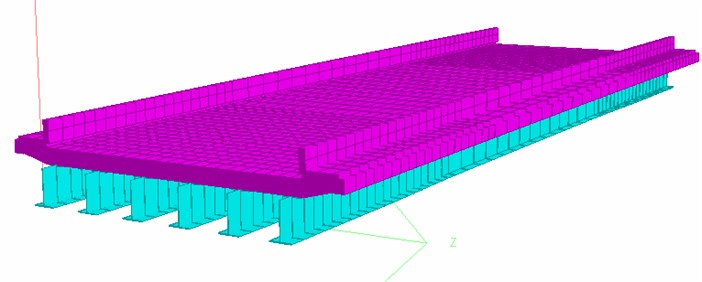
In last decades, the finite element method has emerged as the most powerful general method of structural analysis and has provided engineers with a tool of very wide applicability [18]. In this paper numerical modal analysis of the tested bridge has been performed using commercial finite element (FE) software Staad.Pro. FE model, shown in Fig. 9, was considered in a plane stress state. This model simplifies the three-dimension action of real structure. Present FE analysis has employed linear elastic behaviour for steel and reinforced concrete. To simplify the analysis, only steel-concrete bridge deck with rigid supports at both ends was modelled. Behaviour of the abutments has not been taken into account as they did not undergo any significant displacements during the field test.
Fig. 9Finite element model of bridge deck
Comparison of experimental and theoretical results are summarised in Table 2. Numerical model predicts 5 mode shapes with frequencies below 20 Hz of the bridge deck vibrations. Field tests have approved 4 of them. The results from the dynamic FE model adopted showed good correlation for the first 3 modes obtained experimentally, while higher-order 5th mode exhibits less correlation (Table 2). Relative frequency was obtain equal to 0,99, 0,96 and 0,94 for the 1st bending (Fig. 10a), 1st torsion (Fig. 10(b)) and 2nd bending modes, respectively. Errors in FE analysis are caused by the difference between the overall stiffness of the bridge deck taken in FE model comparing to the real bridge. It is known that the overall stiffness of railway bridges decks and so too does the frequencies of self-vibration modes is increasing due to the influence of ballast, rails, sidewalk blocks and etc. Moreover, influence of these elements may be quite different for different vibration modes. It should be noted that the influence of the factors mentioned above is not fully investigated and further research is needed.
Table 2Comparison between natural frequencies obtained experimentally and by FE modelling
Mode | Frequencies (Hz) | Mode type | |||
Impact excitation | Ambient traffic excitation | FE analysis | |||
1 | 5,53 | 5,49 | 5,45 | 0,99 | Bending (1st) |
2 | 6,63 | 6,60 | 6,32 | 0,96 | Torsion (1st) |
3 | 14,65 | - | 13,81 | 0,94 | Bending (2nd) |
4 | - | - | 14,10 | - | Combined bending-torsion (1st) |
5 | 17,03- | 16,99 | 15,33 | 0,90 | Torsion (2nd) |
Fig. 10First two fundamental modes obtained by FE analysis: a) 1st bending mode (fFE= 5,45 Hz); b) 1st torsion mode (fFE= 6,32 Hz)
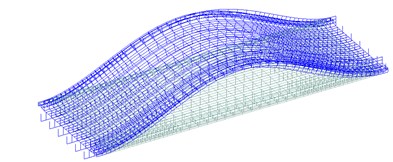
a)
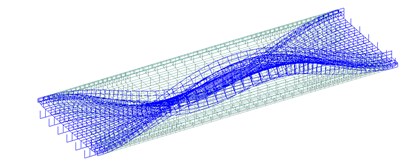
b)
6. Conclusions
1. The dynamic response of new built steel-concrete composite frame railway bridge with the span of 32 m tested in-situ using impact and ambient traffic (freight trains) excitations has been analyzed with the aim to identify the modal shapes, frequencies and damping ratios, to verify the serviceability of the bridge, and calibrate the analytical model of the structure.
2. The first four experimental mode shapes and corresponding natural frequencies below 20 Hz (5,53, 6,63, 14,65 and 17,03 Hz) of the whole bridge under the impulse excitation and ambient service loads were identified. The maximum vertical acceleration is 0,824 m/s2, the modal damping average ratio of the first fundamental bending mode is = 2,287 %. The modal data obtained from impact excitation were more statistically reliable than those obtained by using ambient excitation. Nevertheless, both excitation methods yielded comparable results. The impact excitation by dropping weight on the bridge deck is a convenient alternative due to its simplicity, low cost and speed of execution.
3. In Lithuanian standard LST EN 1991-2/AC the rules and limitations for a dynamic analysis of railway bridges are presented. The first natural frequency of the investigated railway bridge should be within the limits 3,93-9,86 Hz; the maximum peak vertical acceleration of the bridge deck are limited to 3,5 m/s2, the critical lower damping ratio for composite decks to 0,5 %. It is evident that these limitations compared with obtained experimental data are underestimated.
4. Numerical finite element model predicts 5 mode shapes with frequencies below 20 Hz of the bridge deck vibrations. The results from the dynamic finite element model adopted showed good correlation for the first 3 modes obtained experimentally, while higher-order 5th mode exhibits less correlation. Relative frequency was obtained equal to 0,99, 0,96, 0,94 for the 1st bending, 1st torsion and 2nd bending modes, respectively.
5. The combination of both experimental in-situ testing with relatively small number of vibration sensors and numerical simulation has been proven to be reliable and inexpensive methodology for identification of modal vibration properties of the bridge increasing its structural reliability and safety for users. The updated numerical model of the bridge will allow to predict the future condition behaviour of the bridge under increased loading or/and speed of operation.
References
-
James M., Brownjohn W., De Stefano A., Xu Y. L., Wenzel H., Aktan A. E. Vibration-based monitoring of civil infrastructure: challenges and successes. Journal of Civil Structural Health Monitoring, Vol. 1, Issue 3-4, 2011, p. 79-95.
-
Matsuoka K., Kaito K., Watanabe T., Sogabe M. Identification of dynamic properties of open-deck viaducts under passing train loads. Conference Proceedings of the Society for Experimental Mechanics, Series 1, Vol. 7, Civil Engineering Topics, Vol. 4, 2011, p. 155-162.
-
Zwolski J., Bien J. Modal analysis of bridge structures by means of forced vibration tests. Journal of Civil Engineering and Management, Vol. 17, Issue 4, 2011, p. 590-599.
-
Rhee I. Railway bridge using small post-tensioned concrete box girder. The Baltic Journal of Road and Bridge Engineering, Vol. 7, Issue 2, 2012, p. 137-144.
-
Fryba L. A rough assessment of railway bridges for high speed trains. Engineering Structures, Vol. 23, Issue 5, 2001, p. 548-556.
-
Liu K., Reynders E., De Roeck G., Lombaert G. Experimental and numerical analysis of a composite bridge for high-speed trains. Journal of Sound and Vibration, Vol. 320, Issue 1-2, 2009, p. 201-220.
-
Zhan N., Xia H., Guo W. Vehicle-bridge interaction analysis under high-speed trains. Journal of Sound and Vibration, Vol. 309, Issue 3-5, 2008, p. 407-425.
-
Xia H., Zhang N., Gao R. Experimental analysis of railway bridge under high-speed trains. Journal of Sound and Vibration, Vol. 282, Issue 1-2, 2005, p. 517-528.
-
Alvandi A., Bastien J., Cremona C., Jolin M. Bridge condition evaluation by in-situ dynamic data. The Open Acoustics Journal, Vol. 1, Issue 1, 2008, p. 54-65.
-
Brownjohn J. M. W. Structural health monitoring of civil infrastructures. Philosophical Transactions of the Royal Society A, Vol. 365, No. 1851, 2007, p. 589-622.
-
Zhan J. W., Xia H., Chen S. Y., De Roeck G. Structural damage identification for railway bridges based on train-induced bridge responses and sensitivity analysis. Journal of Sound and Vibration, Vol. 330, Issue 4, 2011, p. 757-770.
-
Alahakoon S., Preethichandra D. M. G., Mala Ekanayake E. M. I. Sensor network applications in structures – a survey. Electronic Journal of Structural Engineering, Vol. 9, Special Issue, 2009, p. 1-10.
-
Farrar C. R., Worden K. An introduction to structural health monitoring. Philosophical Transactions of the Royal Society A, Vol. 365, Issue 1851, 2007, p. 303-315.
-
Fujino Y., Siringoringo D. M., Nagayama T., SuD. Control, simulation and monitoring of bridge vibration – Japan’s recent development and practice. IABSE-JSCE Joint Conference on Advances in Bridge Engineering, August 8-10, 2010, Dhaka, Bangladesh, p. 61-74.
-
Whelan M. J., Gangone M. V., Janoyan K. D., Jha R. Real-time wireless vibration monitoring for operational modal analysis of an integral abutment railway bridge. Engineering Structures, Vol. 31, Issue 10, 2009, p. 2224-2235.
-
Kaloop M. R., Li H. Tower bridge movement analysis with GPS and accelerometer technique: case study Yonghe tower bridge. Information Technology Journal, Vol. 8, Issue 8, 2009, p. 1213-1220.
-
Meng X., Dodson A. H., Roberts G. W. Detecting bridge dynamics with GPS and triaxial accelerometers. Engineering Structures, Vol. 29, Issue 11, 2007, p. 3178-3184.
-
Kaklauskas G., Gribniak V., Jakubovskis R., Gudonis E., Salys D., Kupliauskas R. Serviceability analysis of flexural reinforced concrete members. Journal of Civil Engineering and Management, Vol. 18, Issue 1, 2012, p. 24-29.
About this article

The first author wishes to express his gratitude for the financial support provided by the Research Council of Lithuania (Research Project No. MIP–083/2012).
