Abstract
In this research ANFIS method has been used to predict sound pressure levels of MF285 and U650 tractors for following machines: moldboard plow, chisel plow, cultivator, rotary tiller, boom-type sprayer, disk harrow and ditcher. Combination of fuzzy logic with architectural design of neural network leads to creation of neuro-fuzzy systems, which benefit from feed forward calculation of output and back-propagation learning capability of neural networks, while keeping interpret-ability of a fuzzy system. An adaptive neuro-fuzzy inference system architecture based on the Takagi-Sugeno model created to modeling of sound pressure level of MF285 and U650 tractors during agricultural operations. The testing performance of the proposed ANFIS model revealed a good predictive capacity to yield acceptable error measures with, 0.917 and also 1.06, 76.11 and 0.7495. The study recommends that the ANFIS technique can be successfully used in estimation of sound pressure level of MF285 and U650 tractors.
1. Introduction
Parallel to the development in technology, the use of machines in mechanization processes of agricultural production has brought about the factors such as noise, vibration, gas, etc. which affect the working environment of users and inspectors of those machines. In order to increase the work success of the machines and to provide the users with safety and comfort, these machines must be designed with respect to the human characteristics [1]. Otherwise, it causes an increase in occupational diseases and accident, and on the other hand, failure of expected work success. Noise is one of the most important environmental factors, which affects the workers’ health and efficiency. Noise can increase the overall workload of operators during a specific task and can affect the performance. As a result, noise affects workers’ health directly and indirectly [2]. Among these effects are weariness, backache, nervousness, nausea, careless, etc. [3-5].
The topic of noise and its effects in agriculture has received much attention since 1960s [6] and the research is ongoing in various dimensions today. Miyakita and Ueda [7] say that a great amount of information was collected about the nature and source of noise, and its effects in connection with the exposure now-a-days, widespread use of agricultural tractors and machineries for field operations in spite of their valuable advantages have caused some occupational health and safety problems for operators of these machines and farmers, the excessive noise is an example [8-16]. However, research should continue to determine in which media, in which sound pressure levels, and in what scale the noise based hearing loss occurs. According to McBride et al. [17], it is known that the people working in agricultural facilities are exposed to some noise sources, but in recent years the noise problem of agricultural machinery in rural roads has been evaluated [18].
Research works conducted by Solecki [15] showed that average noise dose of farmers in different months of the year was within 1.8 to 5.7. Therefore, it was recommended that noise levels should not be more than 80 dB(A), though some countries are conducting noise reduction and control programs to bring noise levels lower than 75 dB(A) [13].
International Labor Organization (ILO) accepts 85 dB(A) as warning limit and 90 dB(A) as danger limit for continuous work for 8 h. A-weighted equivalent sound pressure level of 85 dB(A) results in temporary hearing losses and 90 dB(A) increases the blood pressure, accelerates the pulse and breathing, decreases brain liquid pressure, causes tension in muscles, and withdrawal of blood in the skin [16].
However, there is not any extended study on sound pressure levels occurring in agricultural machine applications. The purposes of this study are:
– to predict the noise levels surrounding the tractor operator and in open air by using ANFIS method,
– to predict the noise levels at various agricultural operation by MF285 and U650 tractors and to make suitable advice in using of them.
2. Materials and methods
2.1. Data acquisition
This study was conducted in Razi university of Kermanshah, Iran. Medium textured soil is dominant in the region. Personal noise exposures of the agricultural tractor operators were measured during tractor operations with MF285 and U650 tractors. Table 1 shows some information about the tractors, and Table 2 about other agricultural machinery used in this study.
Table 1Characteristics of tractors used for noise measurements during agricultural operations
Brand | Model | Power (hp) | Engine | Rated speed (rpm) | Number of gears |
MF285 | 1984 | 75 | 4-cylinder, 4 stroke | 2000 | 8 forward, 2 reverse |
U650 | 1984 | 65 | 4-cylinder, 4 stroke | 1800 | 10 forward, 2 reverse |
Table 2Agricultural machines used for noise measurements
Machine type | Characteristics |
Moldboard plow | 3 bottom one-way plow, mounted-type |
Cultivator | 8 shanks, hoe type, three point hitch |
Rotary tiller | Rear mounted, 150 cm width and PTO driven |
Boom – type ground sprayer | 8 m width, 400 l tank capacity and rear mounted |
Disk harrow | Rear mounted tandem |
Ditcher | 60 cm width |
Chisel plow | 8 shanks, rear mounted |
In this study noise of MF285 and U650 tractors has been investigated. These tractors are the most commonly used tractors in Iran and they usually are used without cabin. This is the reason of choosing this kind of tractors for this study.
The sources of noise of any vehicle can be separated to 3 categories. First, the aerodynamical noise which comes from the effect of wind on machine. This type of noise is not as important as the other types of noise in the tractors, because the field speed of tractors usually is not so high, which affects on the noise of tractor. Second, the frictional noise which comes from the movement of mechanical part and frictional force between them. The last type of sources of noise of vehicle is noise which comes from combustion in the engine.
Before testing, all the necessary technical visits were carried out on the tractors. Test site was prepared and maintained according to ISO [19, 20] sound measurement standard. The test area consisted of a flat open space free from obstacles and the effect of signboards, buildings and hillsides for at least 15 m from measurement zone. The suggested wind speed and other climate limitations were kept in mind during measurements. The background noise was at least 30 dB(A) lower than that for the tractor. Fig. 2 shows the dimensions of the area in which the tractor noise measurement was carried out.
Fig. 1Dimensions of the test site
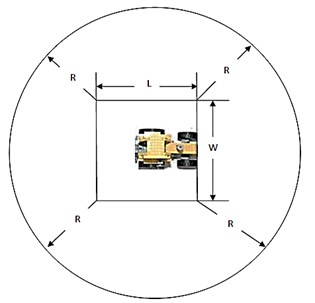
Here R stands for the distance from the obstacles to the measurement zone; and are the length and width of measurement zone, respectively. The minimum values of , and were 40, 20 and 8 m, respectively.
It is important that the measuring equipment be properly selected to monitor and measure sound properties. When we have a basic situation in which we need to assess the severity of environmental noise, we may need to measure only the overall sound pressure level or the A-weighted level, using a simple sound level meter [21].
In this study, a SLM (TES-52 SOUND LEVEL METER) was mounted 1.2 m above the ground surface and 5 m away from the center of the tractor path way in a horizontal position and pointed in the direction of travel. To measure the noise near the operator’s ear, the microphone of dosimeter (Model TES-1354/1355) was attached to the operator clothes.
The SLM and dosimeter calibration was performed by using TES-1356 Sound Level Calibrator before data gathering. Most sound level meters have three “weighting” networks, called the A-, B-, and C-scales. Originally, the A-scale was designed to correspond to the response of the human ear for a sound pressure level of 40 dB at all frequencies. The B-scale was designed to correspond to the response of the human ear for a sound pressure level of 70 dB at all frequencies. The C-scale was approximately flat (constant) for frequencies between 63 Hz and 4000 Hz. The A-scale is widely used as a single measure of possible hearing damage, annoyance caused by noise, and compliance with various noise regulations. The sound levels indicated by the A-scale network are denoted by LA, and the units are designated dB(A) [21].
It was needed to choose the range of variables before trying to perform the tests, i.e., forward speed, gear ratio and the microphone position. The ranges of variables were selected to sustain most of operational condition of MF285 and U650 tractors regard to agriculture operation. After determining the range of variables, table test was developed based on completely randomized split plot factorial test (shown in Table 3). All tests were done with 5 replications.
Table 3Matrix of the experimentation
Parameters | Levels of parameters | |
2 | 1 | |
Engine speed (rpm) | - | 2250 |
Gear ratio | - | 3 |
Position of microphone | SLM | Dosimeter |
The field speed of tractor in different operations had been selected according to Table 4 [22].
The data obtained in this study were analyzed using SPSS 19.0 software. Variance analyses for sound pressure level (dB) at A-weighted equivalent sound pressure level (dB(A)) were done for each working condition. Duncan test was used for multiple comparisons of mean values of sound pressure level.
Table 4Field speed of tractor with different equipment
Equipment | Permissible speed range (km/h) | Test speed (km/h) |
Moldboard plow | 5.0 – 10.0 | 6.0 |
Ditcher | 5.0 – 10.0 | 6.0 |
Chisel plow | 6.5 – 10.5 | 7.0 |
Cultivator | 8.0 – 13.0 | 8.0 |
Rotary tiller | 2.0 – 7.0 | 5.0 |
Disk harrow | 6.5 – 11.0 | 7.0 |
Boom-type ground sprayer | 5.0 – 11.5 | 5.0 |
Centrifugal fertilizer broadcaster | 8.0 – 16.0 | 8.0 |
2.2. Development of ANFIS model
ANFIS is an adaptive network that permits the application of neural network topology and fuzzy logic. It not only includes the characteristics of both methods but also eliminates some disadvantages of their lonely used case. ANFIS uses the learning ability of ANN to define the input–output relationship and construct the fuzzy rules by determining the inputs structure. The system results were obtained by thinking and reasoning capability of the fuzzy logic.
The ANFIS network (Fig. 2) works as follows: let x and y be the two typical input values fed at the two input nodes, which then transforms those values to the membership functions (say bell-shaped) and give the output as follows [note in general, output from a node; membership function; and and fuzzy sets associated with nodes , in Eq. (1)]:
where , and changeable basis parameters. Similar computations are carried out for the input of to obtain . The membership functions are then multiplied in the second layer, e.g.:
Such products or firing strengths are then averaged:
Nodes of the fourth layer use the above ratio as a weighting factor. Furthermore, using fuzzy if-then rules produces the following output (an example of an if-then rule is: if is and is , then ):
where , , and changeable consequent parameters. The final network output is produced by the node of the fifth layer as a summation of all incoming signals, which is exemplified in the Eq. (4). The description of the learning algorithm is given by Jang and Sun [23].
The following scenarios are considered in building the ANFIS model (Fig. 3) with the inputs and output shown in the network. A computer program (MATLAB code) was developed to perform the analysis, and can be obtained from the corresponding author.
Fig. 2ANFIS network architecture
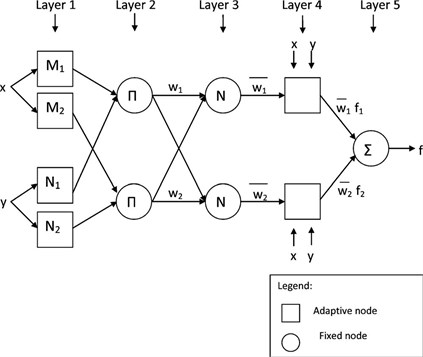
Fig. 3The ANFIS architecture for sound pressure
The performance of ANFIS model in training and testing sets is validated in terms of the common statistical measures; (coefficient of determinationwhich presents the degree of association between predicted and true values), (which is preferred in many iterative prediction and opti-mization schemes), , and (+ or −, which is a parameter commonly understood in engineering applications and which considers algebraic difference between predicted and true values):
where is the estimated data, is the observed data. These statistical measures provide information on the strength of linear relationship between the observed and the estimated values. If the model is “perfect”, is zero and is 1. If the model is a total failure, is zero.
3. Results and discussion
To predict the sound pressure level of MF285 and U650 tractors occurring in agricultural operations, the sound pressure level of them has been measured.
The inputs of the model consisted of three nodes corresponding to three input variables; 1 – position of sound consideration, 2 – tractor type and 3 – equipment type. The output consisted of one node namely the noise pressure level.
ANFIS model predicts the sound pressure level of MF285 and U650 tractors as shown in Figure 3.
The properties of the best ANFIS model were shown in Table 5.
Table 5The properties of the best ANFIS model
Number of membership function for each input | 3 |
Type of membership function | Trapmf (Trap membership function) |
Output membership function | Linear |
Method for optimization | Hybrid |
Number of epochs | 20 |
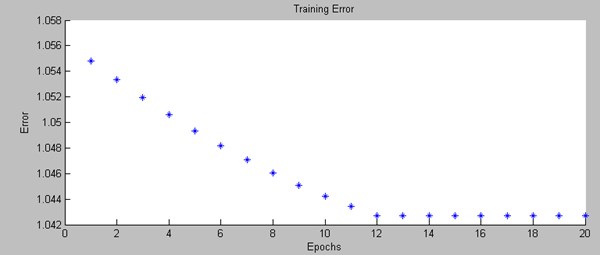
In Figure 4 the replications (epochs) of training are shown. As it can be seen, the error after epoch number 12 is constant and it is not reduced in later epochs.
Fig. 4Training error of the ANFIS
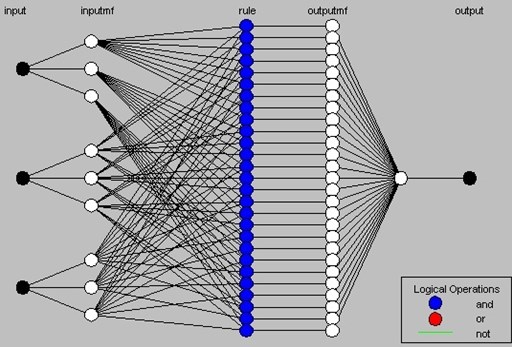
The ANFIS model has been developed and is shown in Figure 5, where : tractor type; : equipment type; : position of sound consideration.
The corresponding rules of the developed ANFIS model are listed in Figure 6.
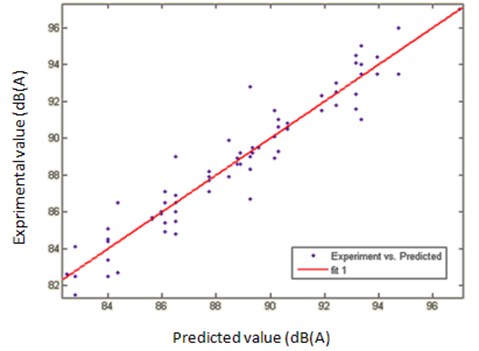
Figure 7 shows the correlation between predicted values and experimental values.
In this study, grouped variables (nondimensional data set) of input data were explored to assess their influence on the sound pressure level of MF285 and U650 tractors modeling. The ANFIS model was developed and tested for predicting the sound pressure level. To assess the performance of the ANFIS model, observed output values were plotted against the predicted ones. Fig. 5 illustrates the results with the performance indices between predicted and observed data for the validating (testing) data sets. The testing performance of the proposed ANFIS model revealed a good predictive capacity to yield acceptable error measures with 0.917 and also 1.06, 76.11 and 0.750. This study is useful in applications of these types of tractors for operation conditions, particularly helping to identify parameters that most likely define sound pressure level of these tractors and ANFIS model is shown to agree well with actual measurements.
Fig. 5ANFIS model (inputs and output)
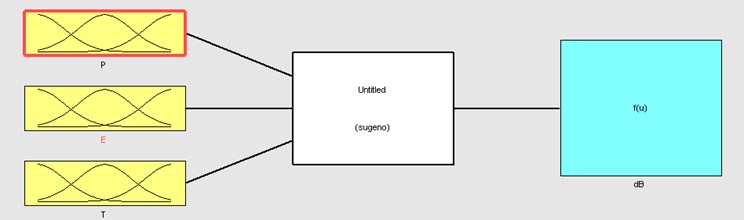
Fig. 6Developed ANFIS model rules
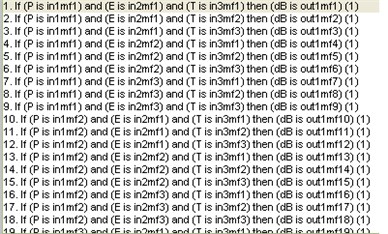
Fig. 7Observed versus predicted output
Timeliness is a crucial factor in agricultural field applications, which refers to ability of starting and finishing a specific task without loss of time. Finding the most appropriate time for soil tillage may be difficult since weather conditions are sometimes unfavorable. It can be commonly observed that a farmer has to finish seedbed preparation in a few days [16].
4. Conclusion
An ANFIS model has been developed to predict the sound pressure of MF285 and U650 tractors during different agricultural operations. 140 experimental data sets were used for the ANFIS simulations. Input parameters used for the ANFIS simulations were 1 – position of sound consideration, 2 – tractor type and 3 – equipment type. Six different membership functions, which were triangular, trapezoid, Gaussian, Generalized bell, -shaped built-in, sigmoidal and sigmoidally shaped built-in were tried for constructing of ANFIS model. The results of ANFIS models using observation data records were compared and evaluated based on their performance in training and testing. The ANFIS model with trapezoid membership function was chosen as the best fit ANFIS model based on performance evaluation criteria, with 0.917, 1.09, 76.11 and 0.750. The study recommends that the ANFIS technique can be successfully used in estimation of noise level of the tractors.
References
-
Liljedahl J. B., Turnquist P. K., Smith D. W., Hoki M. Tractors and Their Powers Units. Fourth Ed., American Society of Agricultural Engineers, ASAE, Textbook No: 801P0196, 1996.
-
Parsons K. C. Environmental ergonomics: a review of principles, methods and models. Applied Ergonomics, Vol. 31, 2000, p. 581-594.
-
Lines J. A., Lee S. R., Stiles M. A. Noise in the countryside. Journal of Agricultural Engineering Research, Silsoe Research Institute, Silsoe, UK, Vol. 57, 1994, p. 251-261.
-
Tezer E., Sabanci A. Agricultural Mechanization I. Cukurova University College of Agriculture, Adana, Publication No. 44, 1997.
-
Ekerbicer H., Saltik A. The health consequences of industrial noise and methods for protection. TAF Preventive Medicine Bulletin, Vol. 7(3), 2008, p. 261-264.
-
Matthews J. Measurements of environmental noise in agriculture. Journal of Agricultural Engineering Research, Vol. 13(2), 1968, p. 157-167.
-
Miyakita T., Ueda A. Estimates of workers with noise-induced hearing loss and population at risk. Journal of Sound and Vibration, Vol. 205(4), 1997, p. 441-449.
-
Sieswerda V., Dekker J. C. Deafness caused by tractor noise. Landbouwmechanisatia, Vol. 29, 1978, p. 1-3.
-
Maring J. Tractor Noise, Field Measurements of Noise at Ear Level, P: 15. Research Report of Wageningen University, Wageningen, the Netherlands, 1979.
-
Talamo J. D. C. Noise problems in the agricultural industry. Proceedings of the Institute of Acoustics, Vol. 9, 1987, p. 399–402.
-
Suggs C. W. Noise Characteristics of Field Equipment. ASAE Paper No. 87-1598, St. Joseph, Mich., ASAE, 1987.
-
Brown R. H. Handbook of Engineering in Agriculture. Vol. 2, 1st Ed., Prentice – Hall, Inc., London, UK, 1988.
-
Crocker M. J., Ivanov I. N. Noise and Vibration Control in Vehicles. 1st Ed., St. Petersburg, Interpub. Ltd., Russia, 1993.
-
Solecki L. Occupational hearing loss among selected farm tractor operators employed on large multi-production farm in Poland. Int. J. Occup. Med. Env. Health, Vol. 11, 1998, p. 69-80.
-
Solecki L. Duration of exposure to noise among farmers as an important factor of occupational risk. Agric. Env. Med., Vol. 7, 2000, p. 89-93.
-
Aybek A., Kamer H., Arslan S. Personal noise exposures of operators of agricultural tractors. Applied Ergonomics, Vol. 41, 2010, p. 274-281.
-
McBride D. I., Firth H. M., Herbison G. P. Noise exposure and hearing loss in agriculture: a survey of farmers and farm workers in the southland region of New Zealand. Journal of Occupational and Environmental Medicine, Vol. 45(12), 2003, p. 1281-1288.
-
Hassan-Beygi S. R., Ghobadian B., Kianmehr M. H., Chayjan R. A. Prediction of a power tiller sound pressure levels in octave frequency bands using artificial neural networks. International Journal of Agriculture & Biology, Vol. 3, 2007, p. 494-498.
-
Acoustics: Agricultural and Forestry Wheeled Tractors and Self-Propelled Machines. Measurement of Noise Emitted when in Motion, ISO 7216, 1992.
-
Acoustics: Tractors and Machinery for Agriculture and Forestry Measurement of Noise at Operator’s Position. ISO 5131, AVI Pub. Co., Inc., Westport, CT 527, 1996.
-
Barron Randall F. Industrial Noise Control and Acoustics. Marcel Dekker, Inc., 2003, 534 p.
-
St. Joseph Mich Agricultural Machinery Management Data. ASAE D497.4 MAR99, 1976.
-
Jang J.-S. R., Sun C.-T. Neuro-fuzzy modeling and control. Proceedings of the IEEE, Special Issue on Fuzzy Logic in Engineering Applications, Vol. 83(3), 1995, p. 378-406.
About this article

