Abstract
The purpose of this paper is designing an optimal controller for vibration suppression of a funnel-shaped smart structure with distributed piezoelectric actuators and sensors applicable in Magnetic Resonance Imaging (MRI) system. This can help sensitive human beings from vibration and acoustic noise syndrome. Also, the vibration suppression in this structure prevents the test results to be damaged, which is an important issue in medical tests. For this aim, the problem of the vibration control for the funnel-shaped inlet structure of the MRI tomography is stated and the structure is described, first. Then the task of the structure modeling is tackled applying the FEM approach. Identification of the dynamic frequency response of the desired funnel is performed using the modal-based identification method and the state space model is obtained. Then, the control design for the structure is considered using LQG control method. Complete design and control development procedure is implemented in order to reduce the vibration magnitude of a funnel-shaped shell. Finally, the performance of the designed controllers in both frequency domain and time domain are compared with the open loop systems and results are discussed.
1. Introduction
Magnetic Resonance Imaging (MRI) is a powerful technique extensively used in medical research and hospital clinics. Ongoing development of magnetic resonance imaging (MRI) technology is resulting in even more powerful scanners, with high static magnetic field strength and high gradient coil current switching speeds. These developments are driven by the desire to obtain higher quality images that reveal more detail of the internal structure of the biological subjects [1].
A serious limiting factor in the development of these machines is the acoustic noise that they generate during scanning [2]. There are some sources for this vibration and acoustic noise, the main source of this noise is the gradient coil, which is used to produce a spatially varying dynamic magnetic field inside the MRI bore [3]. The high acoustic noise results in serious problems for patients and workers such as annoyance to difficulties in verbal communication, heightened anxiety, temporary hearing loss and possible permanent hearing impairment for persons who are exposed to these noisy environments for long periods. The vibration of the gradient will also affect the image quality and resolution [4]. It is therefore important to find ways to reduce the vibration and acoustic noise levels of MRI scanners.
Due to its potential application in reducing interior cabin noise in MRI and other engineering structures, active control of structural vibration and acoustic has been a research area of growing interest for several years. The MRI shell is subjected to the excitation of the consecutive pulse Lorentz force of the coils, the vibration frequency of the shell ranges from 450 Hz to 5000 Hz. In the preliminary experimental and analytical studies, point actuators were used to control vibration of cylindrical shells. Nevertheless, nowadays an important role among active materials used in smart structures belongs to piezoelectric materials (such as thin wafers and patches or fibers) used as actuators and sensors integrated in a structure providing the adaptability of a smart structure, while not considerably affecting its passive behaviors. For instance, piezoelectric sensing and control with distributed piezoelectric transducers have been intensively studied in some literatures [5-8].
A considerable role in the development of smart structures belongs to the controller design. Therefore, it is important to investigate different potentials for the controller design and its implementation, as a part of the overall design procedure of smart structures. Model-based approaches have been widely used in the control of smart structures [9-14]. Using this approach for a specified model a controller with fixed parameters can be designed. Feedback gain controller, PID control and optimal control are some approaches that have been used by some researchers [13-16].
While there are notable studies on the active vibroacoustic control of common shape structures, rigorous vibration modeling and vibration control of the MRI funnel-shaped inlet structure seems to be absent. The investigation of MRI gradient coil associated acoustic noise was first conducted in the late 1980s [17]. Later, extensive studies were performed using various MRI scanners and different pulse sequences [4, 18-21]. Qiu and Tani studied the vibration control of a cylindrical shell used in MRI equipment [22]. Evans designed a vibration control method by using structural detuning and decoupling concept [23]. Yao et al. did a comprehensive investigation of the vibration properties of the coil insert was conducted using FEA and experimental testing [1]. Trajkov et al. used optimal LQ tracking system with additional dynamics for active vibration controller design, testing and implementation were performed on the funnel-shaped shell structure, the inlet part of the magnetic resonance tomography [24, 25]. Jaensch and Lamperth designed a PID controller for a multi-DOF system of MRI model to vibration isolation [26]. Trajkov et al. present control system design based on a non-linear model reference adaptive control law (MRAC) used for the vibration suppression of a smart piezoelectric mechanical structure [27]. Wang and Mechefske investigated the dynamic response of coil cylinder for both analytical and FEM model [28]. Mechefske and Shao considered the acoustic sound radiated from a MRI device under Lorentz forces and validated the results with BEM [29]. Pribil et al. compares spectral properties of an acoustical noise produced by mechanical vibration of the gradient coils during scanning in the open-air MRI equipment working up to 0.2 T [30].
The above review indicates that while there exists notable body of literature on the active vibroacoustic response control of MRI throat and coil, comprehensive simulations regarding 3D model of a practicable MRI funnel-shape throat dynamic response with distributed real size piezoelectric patches seem to be absent. Accordingly, this paper concerns the vibration control of the funnel-shaped inlet structure of the MRI tomograph using distributed piezoelectric actuator/sensor patches. For the structure modeling, FEM approach and modal identification from the measured input-output data have been used. Genetic algorithm has been used in finding the optimal location of actuators sets. The control problem of the funnel shaped structure is considered for two identified systems using LQG approach. Finally, obtained results have been discussed.
2. FEM modeling
From the exited research, we can conclude that the finite element method could analyze the arbitrary geometry models and the anisotropic properties of the piezoelectric materials.
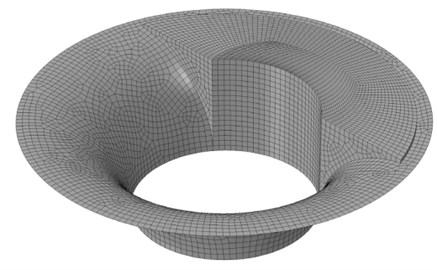
Theoretically, the plate elements (shell or solid) can be used in the modeling of the passive portion of the smart structure. While the shell elements can be used in accordance with the thin plate theory, the solid elements work with the three dimensional elasticity theories. Hence, the utilization of solid type elements in the modeling of the passive portion allows the calculation of the effects of the normal stresses and the transverse shear stresses which may be developed in the passive portion of the smart structures. The most suitable element having piezoelectric capability in three-dimensional coupled field problems is the solid type element SOLID5. Similar to other structural solid elements, this element has three displacement degrees of freedoms per node. In addition to these degrees of freedoms, the element has also potential degrees of freedoms for the analysis of the electromechanical coupling problems. These elements have become available in some commercial finite element software such as ANSYS already. The meshed entrance of a MRI that is presented in Ref. [23] is shown in Fig. 1.
Fig. 1The meshed entrance of the MRI with Solid5
3. System identification
After extracting the frequency response function of the structure, for controlling purposes, a suitable transfer function that can describe the closest response to FEM model should be estimated. Recently a wide series of methods are used in frequency domain. Most of these methods are mathematic based and do not have physical interpretation, however among these methods the modal analysis based system identification has physical explanation. Multi degree of freedom (MDoF) modal analysis will be used to obtain desired transfer function. Suppose a system response is given as:
The identified system in this estimation is considered as:
where must be determined. By defining error as and , the more global formulation consists of weighting factors that is considered as:
For finding these unknown constants, the following equations should be solved:
Note that these equations are nonlinear with respect to parameters , , so, they should solve with iterative numerical methods.
4. Optimal placement
Since the piezoelectric actuators are spatially distributed, the sensitivity of these types of actuators not only depends on the piezoelectric material properties but also on the number and location of them. Here the actuation authority is selected as the optimization function and it will be maximized in the optimal actuators placement. This principle reflects on the amplitude of the frequency response of the actuator around any natural frequencies. In the case of including more than one mode shape, this function considers amplitudes around the natural frequencies of the same mode shapes by weighting coefficients. Before starting the optimization procedure, all possible placements of the piezoelectric actuator should be determined. As shown in the Fig. 1, the structure includes the two flat and curved surfaces. For practical problems such as piezoelectric actuator fragility, it is not possible to locate the actuators on the curved surfaces so, only the flat surfaces are considered. In addition, because of the structure symmetry the search area reduces to the half surface of the structure. Each actuator segment in the search area is considered as the same size of an actual commercial one. This phenomenon describes a classic optimization problem that can readily be treated by employing the genetic algorithm (GA), which is based on an appropriate fitness function. The details of genetic algorithm can be found, for example, in Ref. [31].
Here each of the solutions contains a solo chromosome that contains a solo gene. Furthermore in this case the gene is an m-dimensioned string in which m is the number of the optimal actuators and it has to be chosen by the designer. This string includes a real positive non-recurring number from 1 to the existent actuator positions and each string presents a set of piezoelectric actuators. The resulting genetic algorithm is the combination of the both binary and continues algorithms because each gene can be chosen from a limited real numbers between 1 and the number of existent actuator positions, instead of 0 and 1 in binary algorithms. For the optimization problem, two new objective functions (Minimum Effectiveness and Relative Mean Effectiveness) are added:
As it is obvious, the actuation authority of the sets with larger number of actuators is more than the sets with less number of actuators. However, this increasing saturates as the number of actuators increases as it will be shown in the results.
5. Controller design
In optimal control systems, the feedback control is directly designed through minimization of a performance index proportional to the required measure of the system response and control inputs to attain the best possible closed-loop performance. Before designing the optimal controller, a state-space representation based on the obtained transfer function should be considered. Accordingly, following the standard procedure outlined by Gawronski [32], the state space realization of four obtained transfer functions from each identification method, can be written as:
where is disturbance matrix, is the measurement noise, is associated with the disturbance signals (i.e., it may include actuator noise and/or any external random disturbance), and obtaining the modal state-space representation triple requires some relatively tedious manipulations, which is explained by Maciejowski [33]. Also, the measurement noise, and the process noise, , are generally assumed to be uncorrelated zero-mean Gaussian stochastic processes with constant power spectral density matrices, and , respectively.
The linear-quadratic (LQ) state-feedback regulator with output weighting problem, where all the states are known, is the deterministic initial value problem: given the system with a given non-zero initial state , find the control signal which puts the system back to the zero output in an optimal manner, i.e. by minimizing the cost function , where and are suitably chosen constant weighting matrices, such that and
Note that the linear-quadratic (LQ) state-feedback regulator with output weighting problem is equivalent to Linear-quadratic state-feedback regulator (LQR) with weighting matrices:
The first step in the solution of the LQG problem consists of finding the optimal control to a deterministic linear quadratic regulator (LQR) problem: namely, the above LQG problem without and . The optimal solution to this problem can be written in terms of the simple state feedback law [33]:
where is the estimated state, and in which is the unique positive-semi definite solution of the algebraic Riccati equation:
The next step is to find an optimal estimate of the state , so that is minimized. The optimal state estimate is given by a Kalman filter, which estimates the state of the system in presence of noisy measurements, and is independent of and . The Kalman filter has the structure of an ordinary state estimator or observer with:
where is the optimal choice for observer gain which minimizes the mean square error and is the unique positive-semi definite solution of the estimator algebraic Riccati equation [33]:
Lastly, using the modal state-space realization (7), the state feedback law (9), and the estimated state equations (11), after some straight forward manipulations, one can obtain the closed-loop system dynamic equations in the form:
where This shows that the closed-loop poles are simply the combination of the poles of the deterministic LQR system (eigenvalues of ) and the poles of the Kalman filter (eigenvalues of ), which is exactly as predicted by the separation theorem [34]. This completes the necessary background required for the analysis of the problem. Next, some numerical examples will be considered.
6. Numerical results and discussion
In order to model piezoelectric in ANSYS, one can employ coupled field analysis such as Multiphysics and ANSYS Mechanica and coupled elements such as Solid5 element. For meshing of the media, the Shell181 element has been used. The piezoelectric matrix, elasticity matrix and relative permittivity matrix are given in Table 1.
Table 1Properties of the piezoelectric materials
Name of property | Magnitude | Dimension |
Piezoelectric matrix | (V/m) | |
Elasticity matrix | (MPa) | |
Relative permittivity matrix | (F/m) |
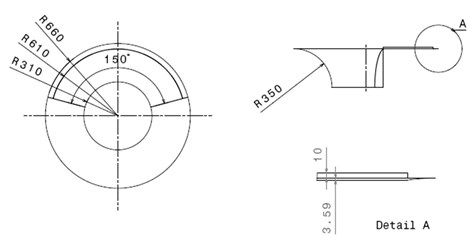
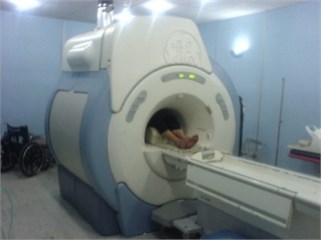
The dimensions of the MRI throat are given in Fig. 2(a) which shows the approximate dimension of the MRI in Imam-Khomeini Hospital, Tehran University of Medical Sciences, Fig. 2(b). The MRI throat is made of aluminum, and its material with the density 2796 kg/m3, Young modulus 73 GPa and Poison’s ratio 0.3. Also, the boundary conditions are set as in Ref. [23], which indicates that the inner edge of the funnel-shaped structure is clamped.
Fig. 2a) considered MRI throat dimensions, b) Imam-Khomeini Hospital MRI
a)
b)
It is clear that the validation of the model is very important for reliability of the model and designed controller. Therefore, the obtained results from the FEM are compared with those given by Evans [17]. Table 2 shows the comparison of the natural frequencies. As one can see, this comparison shows an appropriate accommodation between these two results.
In order to search efficiently and determine the optimal placement of the piezo-actuators, the GA is used with the following values of the relevant parameters: population size = 10; crossover probability = 0.8; migration fraction = 0.2; stopping criteria: fitness function tolerance 1×10⁻⁶.
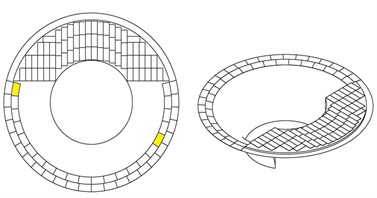
By considering flat surfaces for actuator location candidates, 56 places are available for search purpose (Fig. 3(a)). Moreover, because of symmetric shape of the throat, actuators locations have been chosen as Fig. 3(b). Note that the piezoelectric sensors are located on two fixed location as two yellow patches in Fig. 3(a) without any optimization.
Table 2Comparison of obtained natural frequencies and those given by [23]
No. of mode shape | Natural frequency [23] | Natural frequency (FEM) | Error (%) |
1 | 9.573 | 9.398 | 1.82 |
2 | 23.333 | 22.434 | 3.85 |
3 | 31.439 | 31.806 | 1.16 |
Fig. 3Available places for locating the actuators: a) without and b) with considering symmetric shape of the throat
a)
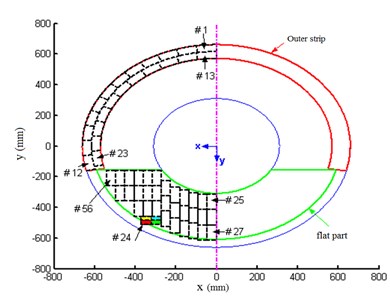
b)
For finding the optimization solutions, the actuation authority of three mode shapes considered as nominal system. Also, the optimization problem solved from one actuator up to five actuators. The best results are gathered in the Tables 3, 4 and 5. In these tables both the best and the worst configurations of the solution are considered for different mode shapes. So, it makes it easy to comprise between the most and the least effectiveness of the actuation locations. In addition, the number of the actuators is selected in a trade-off between the added weight to the host structure and the effectiveness of the vibration suppression.
As one can see in Table 3, Table 4 and Table 5 the RME index for third mode shape decreases more than two other mode shapes. The RME index for the set of 3 actuators in controlling third mode shape is equal to 59 %, however this index for the first and second mode shapes is equal to 70 % and 67 %, respectively.
Table 3The RME and ME index for first mode shape
RME | ME | Actuation authority ×10-2 (mm/V) | Selected set | No. of actuators |
1 | 1 | 2.96 | 55 | 1 |
0.808 | 0.615 | 4.79 | 55, 56 | 2 |
0.699 | 0.481 | 6.21 | 23, 55, 56 | 3 |
0.575 | 0.206 | 6.82 | 23, 46, 55, 56 | 4 |
0.517 | 0.206 | 7.65 | 12, 23, 46, 55, 56 | 5 |
5.22×10⁻⁴ | 3.32×10⁻⁴ | 7.73×10⁻² | 1, 2, 3, 6, 9 | Worst set of 5 actuators |
Table 3, Table 4 and Table 5 show that the optimization problem for third mode shape is more sensitive to actuator placement than the problem for the first and second mode shapes. The optimization results for first three mode shapes are listed in Table 6. As one can see in this table, by increasing the number of actuators the RME index decreases. This index for 5 actuators decreases to 67 %.
The optimal placement of two sets of actuators, each set consist of six actuators, is depicted in Fig. 4. These actuators are divided in two groups, so a MIMO controller should be designed.
Table 4The RME and ME index for second mode shape
RME | ME | Actuation authority ×10-2 (mm/V) | Selected set | No. of actuators |
1 | 1 | 1.11 | 4 | 1 |
0.814 | 0.629 | 1.81 | 4, 8 | 2 |
0.676 | 0.399 | 2.26 | 4, 8, 23 | 3 |
0.521 | 0.056 | 2.32 | 4, 8, 23, 55 | 4 |
0.435 | 0.056 | 2.42 | 4, 6, 8, 23, 55 | 5 |
0.004 | 0.003 | 2.10×10⁻² | 1, 34, 40, 46, 52 | Worst set of 5 actuators |
Table 5The RME and ME index for third mode shape
RME | ME | Actuation authority ×10-2 (mm/V) | Selected set | No. of actuators |
1 | 1 | 4.72 | 42 | 1 |
0.702 | 0.404 | 6.63 | 38, 42 | 2 |
0.594 | 0.378 | 8.41 | 38, 42, 56 | 3 |
0.534 | 0.355 | 10.09 | 29, 38, 42, 56 | 4 |
0.483 | 0.279 | 11.41 | 28, 38, 42, 45, 56 | 5 |
0.005 | 0.003 | 1.11×10⁻¹ | 1, 34, 40, 46, 52 | Worst set of 5 actuators |
Table 6Optimization results for first 3 mode shapes
RME | ME | Actuation authority ×10-2 (mm/V) | Selected set | No. of actuators |
1 | 1 | 4.82 | 42 | 1 |
0.876 | 0.751 | 8.44 | 42, 56 | 2 |
0.834 | 0.75 | 12.06 | 42, 55, 56 | 3 |
0.741 | 0.461 | 14.28 | 23, 42, 55, 56 | 4 |
0.675 | 0.412 | 16.26 | 23, 38, 42 45, 56 | 5 |
0.471 | 0.205 | 22.71 | 4, 12, 23, 29, 32, 38, 42, 45, 55, 56 | 10 |
0.01 | 0.004 | 2.5×10⁻¹ | 1, 2, 9, 14, 17 | Worst set of 5 actuators |
Fig. 4a) first and b) second 6 actuators optimal placements
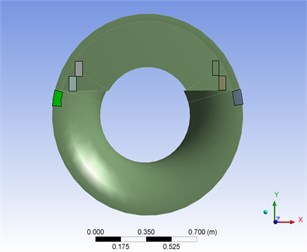
a)
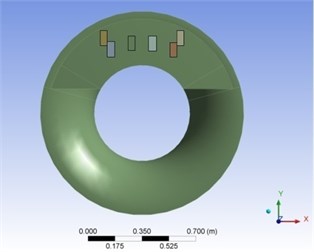
b)
Using MDoF method for both first and second groups of actuators, 4 transfer functions will be found. The dynamic response of FEM model and the identified system using MDoF method are plotted in Fig. 5.
Fig. 5Dynamic response of the FEM solution and the MDoF identified system
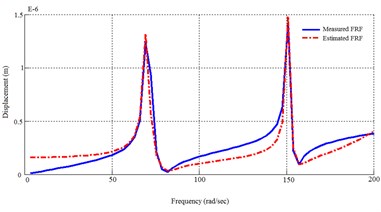
a) From 1st actuator to 1st sensor
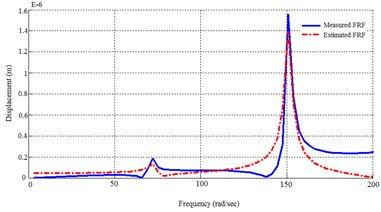
b) From 1st actuator to 2nd sensor
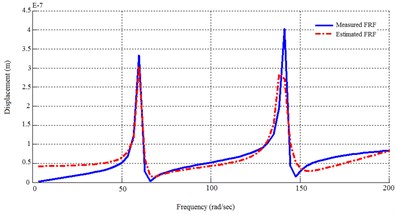
c) From 2nd actuator to 1st sensor
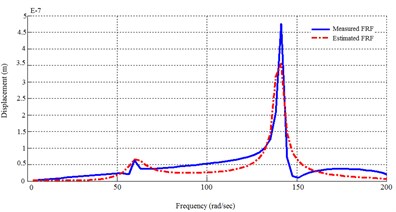
d) From 2nd actuator to 2nd sensor
Fig. 6Frequency responses of the open loop and the closed-loop system
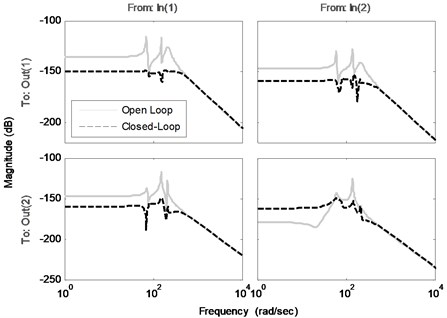
In order to suppress the vibration of the structure an optimal controller is designed with the procedure introduced in the last section. The comparison of the frequency responses of the identified open loop system and the closed-loop system (using designed controller by a specified and ) is shown in Fig. 6. Note that the disturbance and control signals are applied from the same channel. This figure shows the effectiveness of the proposed controller to decrease the amplitude of the sensors voltages, especially near the natural frequencies. Fig. 7(a) compares the impulse responses of the open loop and closed-loop identified systems. As one can see, designed controller has a good performance in damping impulse disturbance in a short time. In addition, Fig. 7(b) shows the actuators voltages as control input during the impulse response of the closed-loop system. Comparison of the open loop system and closed-loop system against a random input disturbance is indicated in Fig. 8(a). This figure shows the appropriate performance of the designed controller to reject the random disturbances. Fig. 8(b) shows the actuators voltages as control input during applying of random disturbance.
Fig. 7a) Impulse responses and b) control inputs of the closed-loop systems
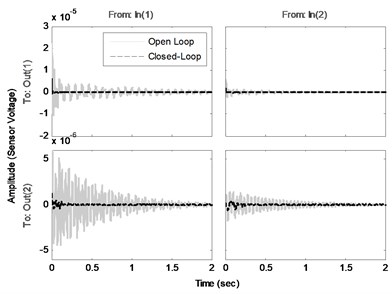
a)
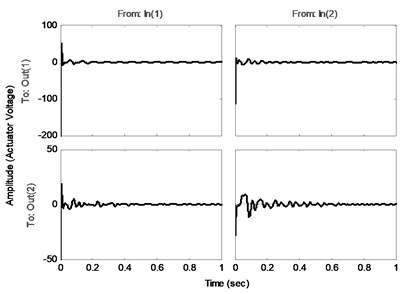
b)
Fig. 8a) Random disturbance responses and b) control inputs of the closed-loop systems
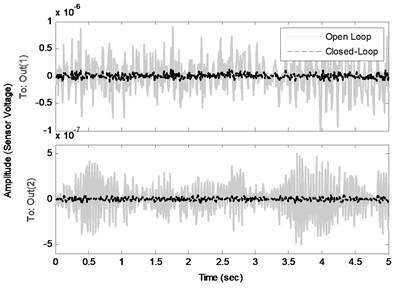
a)
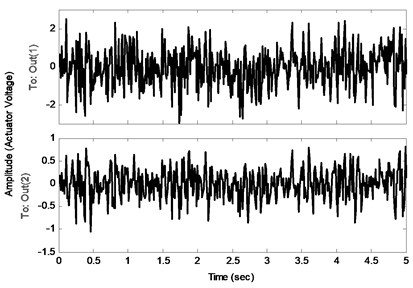
b)
7. Conclusions
In this paper, the optimal LQG method was proposed as a solution for the control of vibrations caused by disturbances, in the sense of the vibration magnitudes suppression. The controller is aimed at active vibration control of funnel shaped structures with distributed piezoelectric actuators and sensors, but it can be widely used for different control tasks. In vibration control, a special class of periodic excitations with particular frequencies is of interest, due to the need for the exclusion of the resonant states. Such excitations or disturbances can be successfully handled using the proposed control strategy that combines optimal LQR and Kalman filter. Since the controller design is model based, the MDoF state space model identification has been considered. Proposed controller is implemented on the funnel shaped model, the inlet part of the MRI tomography, considering optimal placement of the actuators.
Using the state space models obtained by mentioned approach the closed-loop systems were designed and their frequency responses were compared by open loop ones. The results showed considerable reduction of the vibration magnitudes in all frequency range especially in low frequencies where passive methods lose their ability to suppress the vibration. For investigation of the designed controller performance in time domain, closed-loop systems responses due to impulse and random disturbance was compared with the open loop ones. As it is clearly shown in the results, the active vibration attenuation has done great job in trade off between vibration suppression and in appropriate actuators voltages and resultant acoustic noise, which is a crucial problem in applied medical instrumentation.
References
-
Yao G. Z., Mechefske C. K., Rutt B. K. Vibration analysis and measurement of a gradient coil insert in a 4T MRI. Journal of Sound and Vibration, Vol. 285, 2005, p. 743-758.
-
Rutt B. K. Safety issues in MRI. The 11th Scientific Meeting of the International Society for Magnetic Resonance in Medicine, Toronto, Canada, July 2003, Plenary Address.
-
Mechefske C. K., Geris R., Gati J. S., Rutt B. K. Acoustic noise reduction in a 4T MRI scanner. Magnetic Resonance Materials in Physics, Biology and Medicine, Vol. 13, 2002, p. 172-176.
-
Wu Y., Chronik B. A., Bowen C., Mechefske C. K., Rutt B. K. Gradient-induced acoustic and magnetic field fluctuation in a 4T whole-body MR imager. Magnetic Resonance in Medicine, Vol. 44, 2000, p. 532-536.
-
Tzou H. S., Tseng C. I. Distributed piezoelectric sensor/actuator design for dynamic measurement/control of distributed parameter system: a piezoelectric finite element approach. Journal of Sound and Vibration, Vol. 138, 1990, p. 17-34.
-
Tzou H. S., Anderson G. L. Intelligent Structural Systems. Dordrecht, Kluwer-Academic, 1992.
-
Gudarzi M., Oveisi A., Mohammadi M. M. Robust active vibration control of a rectangular piezoelectric laminate flexible thin plate: an LMI-based approach. International Review of Mechanical Engineering, Vol. 6, 2012, p. 1217-1227.
-
Gabbert U., Tzou H. S. Smart Structures and Structronic Systems. Dordrecht, Kluwer-Academic, 2001.
-
Rao S. S., Pan T. S. Modeling, control and design of flexible structures: A survey. Applied Mechanics, Vol. 43, Issue 5, 1990, p. 99-117.
-
Preumont A. Vibration Control of Active Structures: An Introduction. Dordrecht, Boston, London, Kluwer Academic Publishers, 1997.
-
Piefort V. Finite Element Modeling of Piezoelectric Active Structures. Ph. D. Thesis, Universite Libre de Bruxelles, Belgium, 2000.
-
Rao V. S., Sana S. An overview of control design methods for smart structural system. Proceedings of SPIE: Smart Materials, Structures and Integrated Systems, 2001, p. 1-13.
-
Nestorovic T. T., Gabbert U., Koppe H. Vibration control of a plate structure using optimal tracking based on LQ controller and additional dynamics. Proceedings of the 3rd World Conference on Structural Control, Como, Italy, 7–12 April 2002, John Wiley and Sons Ltd., p. 85-90.
-
Nestorovic T. T., Gabbert U., Koppe H. Controller design for a funnel-shaped smart shell structure. Facta Universitatis, Series Mechanics, Automatic Control and Robotics, Special Issue: Nonlinear Mechanic, Nonlinear Sciences and Applications II, Vol. 3, Issue 15, 2003, p. 1033-1038.
-
Nestorovic T. T., Gabbert U. Active control of a piezoelectiric funnel-shaped structure based on the subspace identification. Structural Control and Health Monitoring, John Wiley and Sons, 2005.
-
Nestorovic T. T. Controller design for the vibration suppression of smart structures. Fortschritt-Berichte VDI Reihe 8, 1071, Dusseldorf, VDI Verlag, 2005.
-
Hurwitz R., Lane S. R., Bell R. A., Brant-Zawadzki M. N. Acoustic analysis of gradient-coil noise in MR imaging. Radiology, Vol. 173, 1989, p. 545-548.
-
Price D. L., Dewilde J. P., Papadaki A. M., Curran J. S., Kitney R. I. Investigation of acoustic noise on 15 MRI scanners from 0.2T to 3T. Radiology, Vol. 173, 1989, p. 545-548.
-
Shellock F. G., Morisoli S. M., Ziarati M. Measurement of acoustic noise during MR imaging: evaluation of six “worst-case” pulse sequences. Radiology, Vol. 191, 1994, p. 91-93.
-
Mc Jury M. J. Acoustic noise levels generated during high field MR imaging. Clinical Radiology, Vol. 50, 1995, p. 331-334.
-
Counter S. A., Olofsson A., Grahn G., Borg E. MRI acoustic noise, sound pressure and frequency analysis. Magnetic Resonance Imaging, Vol. 7, 1997, p. 606-611.
-
Qiu Tani. Vibration control of a cylindrical shell used in MRI equipment. Smart Materials and Structures, Vol. 4, 1995, p. 75-81.
-
Evans J. B. Structural floor design for a magnetic resonance imaging (MRI) system. Proceedings of the Tenth International Congress on Sound and Vibration, 2003, p. 493-500.
-
Trajkov T. N., Koppe T. H., Gabbert U. Active vibration control using optimal LQ tracking system with additional dynamics. International Journal of Control, Vol. 78, Issue 15, 2005, p. 1182-1197.
-
Trajkov T. N., Koppe H., Gabbert U. Vibration control of a funnel-shaped shell structure with distributed piezoelectric actuators and sensors. Smart Materials and Structures, Vol. 15, Issue 4, 2006, p. 1119-1132.
-
Jaensch M., Lamperth M. U. Development of a multi-degree-of-freedom micro positioning, vibration isolation and vibration suppression system. Smart Materials and Structures, Vol. 16, 2007, p. 409-417.
-
Trajkov T. N., Koppe H., Gabbert U. Direct model reference adaptive control (MRAC) design and simulation for the vibration suppression of piezoelectric smart structures. Communications in Nonlinear Science and Numerical Simulation, Vol. 13, 2008, p. 1896-1909.
-
Wang F., Mechefske C. K. Analytical modeling of vibration in MRI scanners. Proceedings of the ASME International Design Engineering Technical Conferences and Computers and Information in Engineering Conference, DETC 2007 1 Part A, 2007, p. 313-318.
-
Mechefske C. K., Shao W. Analytical modeling of noise in MRI scanners. Proceedings of the ASME International Design Engineering Technical Conferences and Computers and Information in Engineering Conference, DETC 2007 1 Part A, 2007, p. 307-311.
-
Pribil J., Pribilova A., Frollo I. Analysis of spectral properties of acoustic noise produced during magnetic resonance imaging. Applied Acoustics, Vol. 73, 2012, p. 687-697.
-
Goldberg D. E. Genetic algorithms in search, optimization, and machine learning. Addison-Wesley Professional, First Edition, Boston, USA, 1989.
-
Gawronski W. K. Advanced Structural Dynamics and Active Control of Structures. New York, Springer-Verlag, 2004.
-
Maciejowski J. Multivariable Feedback Design. Addison-Wesley, 1989.
-
Skogestad S.,Postlethwaite I. Multivariable Feedback Control: Analysis and Design. Wiley-Interscience, 2005.
About this article

