Abstract
In this experimental study, it was achieved to detect internal or surface cracks that can occur in the production of ceramic plates by using the method of impulse noise. This method is a test technique which was not used in the applications. In this experimental study, a pulse is applied on the ceramic material. This pulse is produced by pendulum mechanism. With the reflected sound material, the deformation of the material is analyzed. The application of the study was performed on ceramic plates.Ceramic double plates, made from same materials, with same characteristics, but in different models, were used. One of these ceramic double plates, both of which are entirely of the same kind, is un-deformed plate, and the other is cracked plate. Impulse noises, having arisen from the equal impulse power applied on these intact and cracked plates of the same model, were examined by wavelet analysis. By means of the applied method, it was seen to have shown significant results in distinguishing intact and cracked plates. Having the frequency and magnitude dimensions of the deformations on the plates also examined by means of the applied analysis, important distinguishing findings were attained therefrom.
1. Introduction
Nowadays, ceramic and porcelain industry is especially active in kitchen and construction sector [1-3]. Before and after sales, visible or non-visible cracks/deformations that might occur inside the material are some of the most important problems that the manufacturers have to deal with. These defects lead economic losses and losses of time. For this reason it is essentially important to detect and remove the defects in ceramic - porcelain sector [1-4]. In ceramic industry, testing systems were rarely used to detect the presence of defects in ceramic tiles on-line. Defects in the ceramic body [5, 6] commonly feature delaminating, heterogeneous materials or agglomerates decreasing the structural strength. Expensive available inspection systems (such as X-ray methods) that are able to detect information on the internal structure of ceramic or porcelain material, if compared with the low cost of the ceramic products, determine in most cases the choice of an experimental optimization of production parameters or visual inspection techniques (only for defects involving the tile surface). In many technological industries, infrared (IR) inspection is used for damage detection for its resolution, easiness, full-field capability, in-field applicability and continuously decreasing costs of thermo-graphic systems. Thermo-graphic techniques [7] are commonly applied to building inspections, process controls and monitoring, predictive maintenance, evaluation of material features, medical diagnosis [8]. Ceramic materials, corrosion, cracking and breaking as many disorders can be examined using the acoustic method [1, 9]. Acoustic measurements can also be used to observe traction [1, 12, 13]. Different mathematical methods are used for detection of the deformation in ceramic materials and determining the size of deformation [14, 15].
Different methods are used in the crack detection applications of ceramic or porcelain materials. In this experimental study the impact method, which can be included in ultrasonic methods, was used. This mechanical system is set to implement impact on the material, and after examining the sound out of the material after the impulse, the deformation in the ceramic plate was distinguished with Continuous Wavelet Transform (CWT) method.
Impulse noise of the measuring system was provided via the pendulum, which is used at the laboratories for impulse purposes. Pendulums have a quite interesting dynamic system. Pendulums are physical devices, making angular movements and causing the same effects by forming the same movements [14, 16].
One can begin deriving the equation of motion for the pendulum. Equation (1) becomes, by use of:
Let damping and driving forces be parallel to the motion of the pendulum. Let the driving force be a function of time. Let , so the damping force is dependent on velocity, v or . Rearranging and substituting:
Equation (3) is the second order differential equation describing the dynamical system of interest [1, 2, 9].
2. Measurement and data collection system
In this experimental study, a pendulum was used to produce a stable impulse. The Impact Pendulum is a developed pendulum model used for creating equal magnitudes of impacts [1, 2, 17]. By means of a little plastic hammer attached to the end of the Impact Pendulum, without giving any damage to the ceramic plate, equal magnitudes of impacts hit were supported and the sound coming from the plate was analysed. Measurement and Data Acquisition System (DAQ) can be shown in Figure 1.
Fig. 1Data acquisition and measurement system model [1]
![Data acquisition and measurement system model [1]](https://static-01.extrica.com/articles/14560/14560-img1.jpg)
In the experimental study, POE 2000 type Impact Pendulum was used and the effect was achieved via hitting the ceramic plate with the same magnitude. Here using the Impact Pendulum, the sound coming out by applying equal impacts on the same type and model of ceramic plates with or without cracks was transferred into the data acquisition system, then to the computer and data processing stage started. The output audio signal of the amplifier is transmitted to the computer at a sampling rate of 0.0000125 seconds via Advantech 1716L Multifunction PCI card and data analysis is performed using Matlab © software.
The experimental study is based on two basic applications. The first application is examining and comparing time-amplitude of impact noise marks, and the second application is continuous wavelet analysis.
Fig. 2Noise plot of un-damaged and cracked ceramic plate
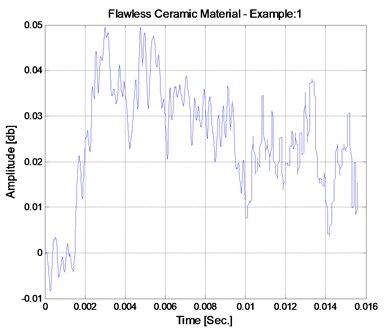
a) Undamaged plate
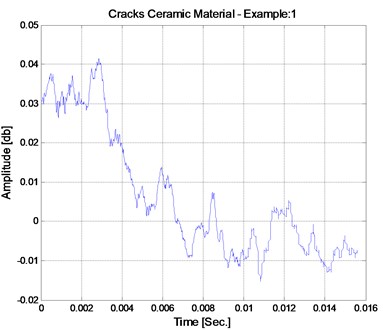
b) Cracked plate
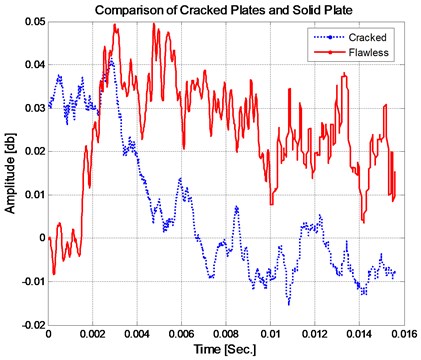
Fig. 3Compare cracked to undamaged plate
Time-amplitude marks on the left section of Figure 2 show the marks that display non-visible cracks under the glaze of the ceramic material. Time-amplitude marks are shown on the right section of the figure, displaying ceramic plates in good condition after the same impact was applied. Ten plates, including those in good condition and those that have different cracks, were determined and these ceramic plates were applied equal magnitude impacts. The differences of the sounds from the plates in the same impact are shown in Figure 2.
The considerations of the time-amplitude graphics of the cracked and un-damaged ceramic plates are shown in Figure 3. According to this graphic, there is a sound absorption entirely at the crack openings in the cracked ceramic plate after the impact, and the vibrations do not continue; conversely, the vibration in the ceramic plate in good condition continues for a longer period on the same plane. Here only one of the five tests was examined. In each experiment study, different graphics are observed for cracked ceramic plates made of different structures. With the suggested continuous wavelet analysis method, the cracked ceramic plates can easily compare the damaged one technique from the un-damaged ones in every experimental study.
3. Continuous wavelet transform
A continuous wavelet transform (CWT) is used to find the detailed coefficients of a continuous signal. CWT is a type of the integral transformation like the Fourier transform (FT). In Fourier transform a time domain signal is converted to the frequency domain. However, in the CWT, it is converting it to the scale in place of the frequency domain. Here the lower scale refers to the amplitudes of the high frequencies. The scale parameters plays role on a microscope. With this method, which is suggested, all details of the data can be analysed at the high resolution. In this manner, the CWT creates a new possibility to get the signatures of the signal.
The use of CWT is especially appropriate as it gives information about the signal both in frequency and time domains. Let be the signal, the continuous wavelet transform of is then defined as:
where (*) indicates the complex equivalents, and:
Here is called as a wave or the mother wavelet and it has two characteristic parameters, namely, dilation () and translation (), which vary continuously. The translation parameter controls the position of the wavelet in time. A “narrow” wavelet can access high-frequency information, while a more dilated wavelet can access low-frequency information. This means that the parameter varies with different frequencies:
And the acceptability condition is provided as below:
Here stands for the FT of . The acceptability condition implies that the FT of disappears at the zero frequency [1, 2, 18, 19, 20].
4. Application of continuous wavelet analysis for the ceramics materials data
With the proposed method, the sounds from ceramic materials were analyzed by CWT. In this method graphics in Figures 4 and 5 were attained upon the CWT analysis of the sounds, which were attained from the impulse, performed on the intact and cracked ceramics plates. By means of this analysis, besides specifying high and low frequency zones, it becomes possible to show time magnitude analysis as well.
Fig. 4Continuous wavelet analysis for undamaged ceramics plate
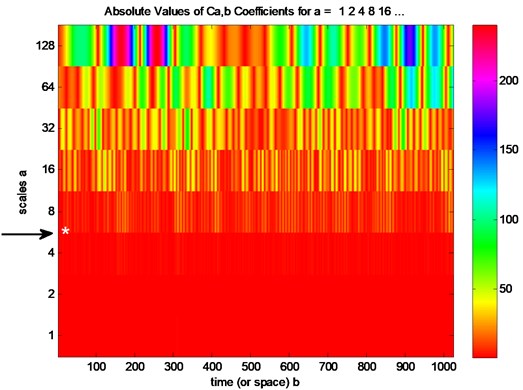
Fig. 5Continuous wavelet analysis for cracked ceramic plate
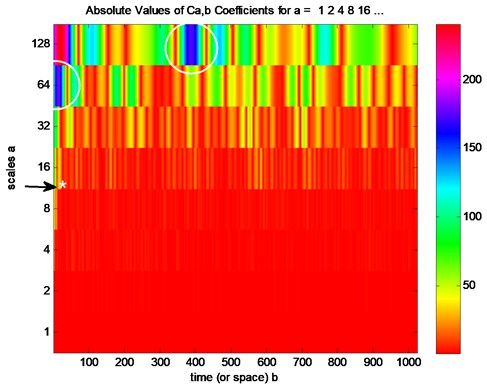
As shown in Fig. 4, for undamaged ceramics plate, low-frequency and high amplitude regions are emerging at 6th level of scale (*). However for it is cracked ceramics plate emerging at 12th level of scale as shown in Fig. 5. Again for cracked ceramics plate, high amplitude regions are emerging at 64th and 128th levels as shown in circles. These regions are specific to cracked ceramics plates. For un-damaged ceramics plates, low frequencies do not happen at these amplitudes.
5. Conclusions
In this experimental study, marking analysis was made on internal or surface cracks in ceramic plates by using the method of impulse noise. Defects such as deformations, wear or cracks under the glazes of ceramic materials produced as kitchenware become deeper or cause breakings after placing hot or cold food inside them. These situations are undesired faults of manufacturers. XR and tests applied by experts are often used in the applications of quality assurances of ceramic materials.
In this experimental study, based on the impact noise obtained in accordance with the impact application on ceramic plates, an approach on finding out whether the ceramic plates were deformed was achieved.
This experimental method may also be presented as a new practical method.
Fig. 63D CWT analysis for undamaged plate
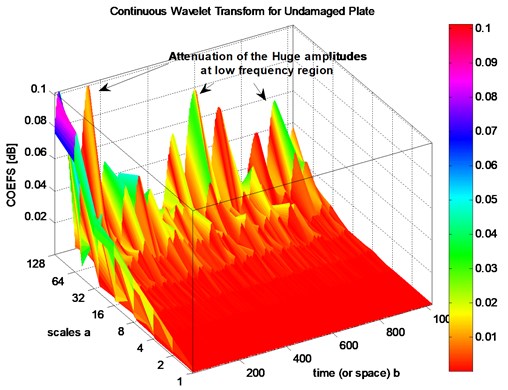
In Figure 6, 3-D wavelet analysis graphic, attained from the impulse applied on the intact plate, is seen. Again in Figure 7, 3-D analysis, attained from the impulse applied on the cracked plate, is given. As seen from the figures, high-amplitude parts are not common at the high-frequency part; in low-frequency sections high-amplitudes become frequent. When the high-frequency parts at the un-damaged and cracked plates are compared, it is seen that while on the un-damaged ceramic plate coefficients (COEFS) are near to zero in between the scales 1-8, the same coefficients (COEFS) are at the level of 0.02 on the cracked plate. Attenuation of the huge amplitudes subtends the low frequency region. The reason of this attenuation is like the heterogenic structure of cracks plates.
Fig. 73D CWT analysis for damaged plate
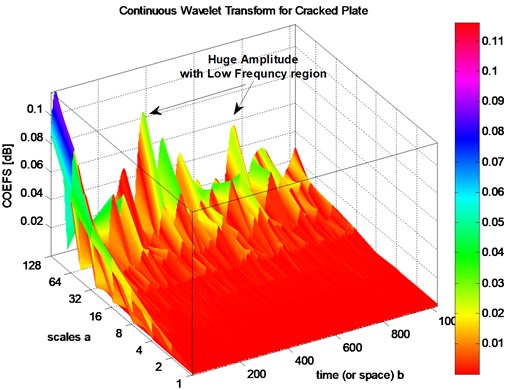
Having both graphics reviewed, it may be seen that cracked ceramic plate may clearly be distinguished from the un-deformed plate at the low-frequency and high-amplitude sections. This distinction is especially prominent within amplitude ranges of 0.008-1, and amplitude sections of 64-128.
In the study conducted, experiments were made on more ceramic plates than the number of those being mentioned in the study. As being seen from the attained results, upon forming a system in which equal impulses are applicable on ceramic materials, wavelet-based analysis of the impulse noises coming from the applied impulses proves quite successful results in distinguishing the damaged ceramic materials from the un-damaged ceramic materials. It is also seen that the analysis of the applied wavelet method is compatible with the attained results.
References
-
Akinci T. C., Yilmaz O., Kaynas T., Ozgiray M., Seker S. Defect detection for ceramic materials by continuous wavelet analysis. Mechanika, Proceedings of the 16th International Conference, Kaunas University of Technology, 7-8 April 2011, Kaunas, Lithuania, p. 9-14.
-
Akinci T. C., Nogay H. S., Yilmaz O. Application of artificial neural networks for defect detection in ceramic materials. Archives of Acoustics, Vol. 37, No. 3, 2012, p. 279-286.
-
Samborski S., Sadowski T.Experimental investigations and modelling of porous ceramics, solid mechanics and its applications. IUTAM Symposium on Multiscale Modelling of Damage and Fracture Processes in Composite Materials, Proceedings of the IUTAM Symposium held in Kazimierz Dolny, Poland, May 23-27, 2005.
-
Kucuk H., Akinci T. C. Roughness of ceramic materials by the method of determining noise impact. Conference for Computer Aided Engineering and System Modelling, Abant Palace Hotel, Bolu, Turkey, Semptember 13-15, 2006.
-
Revel G. M., Rocchi S. Defect detection in ceramic materials by quantitative infrared thermography. 8th Conference on Quantitative Infrared Thermography – QIRT'2006, Padova, Italy.
-
De Andrade R. M., Paone N., Revel G. M. Non destructive thermal detection of delamination in ceramic tile. Proc. ENCIT 98, Rio de Janeiro, 1998, p. 727-731.
-
Maldague X. P. V. Theory and Practice of Infrared Technology for Non-destructive Testing. John Wiley & Sons, New York, NY, 2001.
-
Ranachowski P., Rejmund F. Mechanical-acoustic examination of ceramic material. Proceedings of the 7th Int. Conference EEEIC 2008, Cottbus, 5-11.05.2008, p. 11-13.
-
Kathrina T. Acoustic Emission Analysis of the Internal Friction of Ceramic Powder during Compaction. ISSN 0852-002 X, PPI-KIM, 1996.
-
Lenain J. C. General principles of acoustic emission. Material Evolution, Vol. 39, 1981, p. 1000-1002.
-
Sklarczyk C. The acoustic emission analysis of the crack processes in alumina. Journal of the Ceramic Society, Vol. 9, 1992, p. 427-435.
-
Mechefske C. K., Sun G., Sheasby J. Using acoustic emissions to monitor sliding wear. Insight – Non-Destructive Testing and Condition Monitoring, Vol. 44, No. 8, 2002, p. 490-497.
-
S. Lingard, C. W. Yu, C. F. Yau. Sliding wear studies using acoustic emission. Wear, 1993, Vols. 162-164, p. 597-60.
-
Akinci T. C. The defect detection in ceramic materials based on time-frequency analysis by using the method of impulse noise. Achieves of Acoustics, Vol. 36, No. 1, 2011, p. 77-85.
-
Sanchez L. E. A., Oliveria J. F. G., Coelho R. T. Detection of cracks in scratching tests in ceramic materials through acoustic emission. J. Engineering Manufacture, Vol. 219, Part B, DOI:10.1243/095440505X32616.
-
Bevivino J. The path from the simple pendulum to chaos. Dynamics at the Horsetooth, Vol. 1, Issue. 1, 2009.
-
Kater H. An account of experiments for determining the length of the pendulum vibrating seconds in the latitude of London. Phil. Trans. R. Soc. (London), Retrieved, Vol. 104, No. 33, 2008, p. 11-25.
-
I. Daubechies. Ten Lectures on Wavelets. Philadelphia, SIAM, 1992.
-
Mallat S. A Wavelet Tour of Signal Processing. New York, Academic Press, 1997.
-
Akinci T. C., Ekren N., Seker S., Yildirim S. Continuous wavelet transform for ferroresonance phenomena in electric power systems. International Journal of Electrical Power & Energy Systems, Elsevier, Vol. 441, 2013, p. 403-409.
About this article

