Abstract
Transport, including railways, is one of the main sources of noise, with a particularly strong negative impact on the environment, and on the health of children and adults. Train noise depends on the types of trains, track-type driving, driving speed and driving mode. Noise levels also depends on the rotation of the wheels on the track and on the short track wheel beats connections. The results of measurements showed that urban rail noise analyzed in the residential area is a serious problem, which needs addressing various organizational and technical measures. It was found that the rail transport caused equivalent and maximum noise levels of 20 m from the railway in the residential area were approximately 20 dB above the permissible noise levels. During the day, noise tests exceeded the permissible levels in nearly 80 % of all measurements. At night, the noise levels exceeded allowances on each of all noise level measurements. Statistical analysis of the results showed that the noise level is dependent on the train type and distance to the railway track.
1. Introduction
The transportation sector facilitates important connections and networks across cities and countries. However, various economic benefits are accompanied by the negative environmental transport externalities. Nowadays the rail noise-abatement is considered an important sector for current political agenda. When compared with road transportation, the railway is associated with lower levels of air pollution emissions, lower risks of fatalities, and reduced traffic congestion [1]. On the other hand, rail transportation is also associated with noise pollution and vibration.
Railway transportation has made significant contributions to the flourishing economy of many countries [2]. Rail transport is one of the most advantageous modes of transport used irrespective of seasons and weather conditions. Although this method of cargo transportation takes a little longer than transport by trucks, but neither compromises the security of the cargo. One of the biggest advantages of train transport is the low transportation cost. Cargo rail transport costs are reduced by one third on average, than those being transported by road. Rail is a relatively energy efficient transport mode. Rail transport uses far less energy per passenger kilometre than road transport. However, the environment friendly development of the system has become one of the major challenges. Despite its relative ecological advantages over some other modes, the environmental impacts of the railways should not be underestimated [3].
Road traffic noise is the dominant noise source in many cities [4, 5]. However, as more and more railway lines are built to promote environmentally friendly modes of transport and deal with traffic congestion, rail noise has become increasingly common [6]. Progress of technologies and changes in locomotives design led to increased speed of locomotives, along with an increase in their noise [7].
Rail noise depends on the types of trains, track-type driving, driving speed and driving mode [8]. For every kind of wheel the most important acoustic emission mechanisms are rolling noise, squeal noise and impact noise (due to wheel or local rail defects). Its level depends on the track and wheel type and condition of the brake system and the type of wagon coupling mode, and the axial load [9]. Rail traffic noise is also generated by the drive mechanism for moving parts and auxiliary equipment (air compressors, radiators, cooling fans, heating and air conditioning equipment). With diesel locomotive engines, the noise is caused by moving forward and backward parts. This noise is dominated by the engine at full load – running with acceleration, at maximum speed [10]. Human noise response is shaped by various non-acoustical factors, such as visibility of the noise source [11], personal variables such as sensitivity and mood [12], experience of and knowledge about noise [13], and the attitude towards the noise sources.
Environmental noise, in particular transportation noise, is a growing and well recognized environmental health problem [14-16]. Railways are one of the main sources of noise, with a particularly strong negative impact on the environment and on the health of children and adults [7, 15]. Environmental noise externalities, rail noise and vibration can cause minor and major adverse events. Mainly the noise caused by trains and traffic is associated with general feelings of displeasure, discomfort, and annoyance [1]. Pathological and manifest disorders because of noise pollution refer to the welfare impacts associated with hearing loss, physiological stress reactions, the risk of cardiovascular, neurological, and digestive tract organs diseases [1, 17-19]. Cardiovascular effects of noise rank second in terms of disability-adjusted life year (DALYs) after annoyance [19]. Noise pollution, especially rail and road traffic noise creates an economic burden to society, because of direct and indirect costs for prevention, health care and rehabilitation. Noise accounts for 30 percent of premature ageing. When exposed to loud noise a person cannot concentrate his thoughts, gets tired quickly and consumes more caloric energy. Noise worsens hygienic working conditions and reduces labour efficiency [20, 21].
In Western European and other countries worldwide, special attention is placed on the assessment of vehicles (road, water and air transport), specifically to the technical state of the vehicle with focus on its noise. Reduction of noise at the source can be more attractive than the installation of high trackside barriers, but it requires a thorough understanding of the mechanisms of sound generation [22, 23]. Therefore, more and more attention is paid to the noise generation processes in the investigation, sources of noise detection, noise suppression and isolation, etc. [24].
Lithuania has a relatively well-developed transport system and favourable geopolitical standing. This allows the Lithuanian railways, involved in the rail transport system, not to stay aside from changes in the international freight and passenger traffic system [25, 26]. Currently, Lithuania is mostly carried by rail freight, and the passenger sector recently substantially increased. Klaipeda Seaport is a major transit corridor of international freight. It is famous for intense traffic of goods between East and West. There are a large number of freight trains faced with increased intensity of noise pollution: the case of high noise levels, and the environment located near the railway lines. The residential areas are about 20-30 meters from the railway. It is of importance to know what the noise levels are in the residential area, because noise is an environmental factor harmful to health, causing specific and non-specific pathological changes in various systems of the human organism [27].
In this paper we focused on noise in an urban context. The rail traffic noise is among the main sources of noise in the cities. The aim of this study was to investigate the effects of urban rail noise level in a residential area of Klaipeda city.
2. Methodology
2.1. Study area
The research into noise caused by railway traffic was performed in the measuring places selected not far from the Klaipeda railway station. The area is distinguished by the fact that the railway station is about 1 km from living areas, and the residential neighbourhood homes are about 20-30 meters from the tracks. Diesel passenger and freight trains arrive and depart from this station. The residential area, located near the train station, stands by the passing trains that arrive at the station stops, and leaves as soon as possible to speed up. Railway noise level measurements were made in the home territory of the railway noise impact zone. Noise levels (excluding rail transport) are measured based on four categories: passenger, freight and petroleum products, fertilizer products carry freight trains and diesel locomotives. The railway noise was calculated by the numbering of passing train cars, in order to accurately assess the sound. Each measurement site determined the time during which the train passes through the measuring point, and the number of train cars was used to calculate the speed of the train.
Railway traffic noise level measurements were carried out in two periods – in the daytime (6 am to 6 pm), and at night (10 pm to 6 am). The noise level of 33 passing trains was measured.
2.2. Measurement methods
Railway noise measurements are selectively chosen. The measurement locations are selected according to a railway track near existing residential and other buildings, the speed of passing trains, and the distance from the railway track. In view of the LST EN ISO 3095:2005 standard [28], by measuring the noise level of 1.2 m in height, it is in compliance with 7.5 and 20 meters distance from the track (Fig. 1). About 60 % of trains were measured at daytime and 40 % at night.
Fig. 1Location of microphone at track side
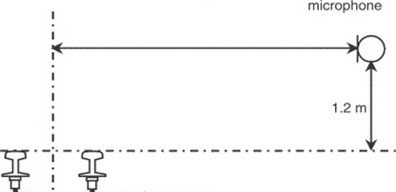
The levels of noise are evaluated by comparing the measuring values with the permissible noise level values set by the Lithuanian public health standard HN 33:2011. In a residential territory during the daytime the maximum noise level cannot be higher than 70 dBA, in the evening – 65 dBA, at night – 60 dBA. In a residential territory the equivalent noise level cannot be higher than 65 dBA, in the evening – 60 dBA, at night – 55 dBA.
Prior to making noise level measurements, the wind speed conditions were determined. According to ISO 1996-2:2008, measurements are not taken when the wind speed is higher than 5 m/s. When the wind speed is 5 m/s, a microphone is covered with a special screen. Prior to and after taking measurements, the device is calibrated according to the instruction manual. If the calibration results differ by more than 2 dB, the noise measurements are repeated (LST EN ISO 1996-1:2005; LST EN ISO 1996-2:2008) [29, 30].
The noise caused by railway traffic is measured when the microphone is in a perpendicular position to the railway line and the measuring is started when the train crosses the line of alignment. The measuring is completed when the last car of a train crosses the line of alignment. The measured values are the equivalent and maximum noise levels (dBA) and noise pressure levels (dB).
The Bruel and Kjaer mediator 2260 noise meter was used for noise measuring. When measuring noise with the Bruel and Kjaer mediator 2260, a relative measuring error is 1.5 %. This is one of the latest instruments of this company. This meter can measure the parameters of equivalent and broadband noise and has a supplementary external device intended for vibration measuring. The device records noise within the frequency range of 6.3 Hz-20 kHz. It can also be used to measure the efficient noise level defined by the characteristics А, В or С or within separate octaves that are separated by standardized filters. When measuring the frequency spectrum of noise, the lowest frequency is recorded first and further measurements are performed for all values of frequencies (31.5-8000 Hz).
2.3. Statistical analysis
Before data comparison, we tested the normality of the data with the Shapiro-Wilk test (Shapiro and Wilk, 1965). Data was considered normally distributed at a 0.05. With the exception of the number of wagons and train speed, even after a neperian logarithmic and Box-cox transformation, all the remaining variables followed the Gaussian distribution. To compare train speeds between day and night we applied the non-parametric Mann-Whitney U test. To measure the equivalent noise and maximum noise between day and night we applied the one-way ANOVA test, since these variables respect normality assumptions. All differences were significant at a 0.05. The differences between speed and train type were observed with the non-parametric Kruskal-Wallis ANOVA test. In order to identify the noise levels according train type and distance, we applied factorial ANOVA, treating as predictors train type and distance (short and medium) to the railway and as dependent variables the equivalent noise and maximum noise. A Spearman coefficient of correlation was calculated between equivalent noise variables and speed, considered significant at a 0.05. All statistical procedures were performed with Statistica 6.0.
3. Results and discussion
Noise surveys exceeded the permissible levels in nearly 80 % of all measurements. At night, the noise levels exceed an acceptable noise level for all measurements. This is further evidence that excessive noise levels close to the railway are a serious issue. Existing houses and residential areas can be protected from the effects of railway noise using walls.
Table 1 summarizes the railway transport and noise levels of 7.5 meters and 20 meters from the railway. This table includes the equivalent noise levels and maximal noise levels for the passing of the passenger, freight trains and locomotives. On average, the maximum equivalent noise levels at 7.5 meters in the passenger passes was 76 dB and for freight trains 74-75 dB. The highest noise level at 7.5 meters from the freight train was 93 dB, and the passenger train was a maximum noise level of 86 dB. Passenger trains’ noise levels in residential area, located 20 meters from the train, were on average 75 dB, and for freight trains and locomotives – 70-72 dB.
Table 1Railway noise levels
a) Noise levels 7.5 m from the railway | b) Noise levels 20 m from the railway | |||||||
Average noise level | Highest noise level | Average noise level | Highest noise level | |||||
Equivalent noise level, dBA | Maximal noise level, dBA | Equivalent noise level, dBA | Maximal noise level, dBA | Equivalent noise level, dBA | Maximal noise level, dBA | Equivalent noise level, dBA | Maximal noise level, dBA | |
Passenger trains | 76 | 79 | 86 | 89 | 75 | 78 | 84 | 86 |
Diesel locomotive | 73 | 78 | 78 | 86 | 72 | 77 | 77 | 81 |
Tank wagons | 75 | 85 | 93 | 103 | 72 | 81 | 81 | 89 |
Sliding wall wagons | 74 | 82 | 88 | 102 | 70 | 78 | 82 | 101 |
Our study shows that passenger trains, which were loudest (by about 5 dB) compared with other types of trains causes the maximum level of noise. Freight trains and locomotives were quieter by 2 dB. The noise tests show that the noise levels are a big problem in the populated areas around the railway tracks, which agrees with other research. For example, rail transport research in France (Cannes) showed that 7.5 meters from the railway, the noise level was 82-97 dB, depending on the type of train. Noise levels deal with different train speeds (60, 100 and 120 km/h). The lowest values obtained at 60 km/h speed of the train were 81 to 86 dBA. When the speed of train was 120 km/h, the equivalent noise levels were 90 to 96 dB [31].
Another study of rail noise has been carried out in Assiut city (Egypt). In this city the railway line is located in the middle of the city and splits it into two parts. The experiments showed that day and night equivalent continuous a-weighted sound pressure levels of 80 dB and higher were recorded [32]. In the Assiut city (Egypt) the railway noise levels measured at 25 m from the track centreline were about 83 dB (when the train speed was 10 km/h), and 85 dB (when the train speed was 30 km/h), and 88 dB (when the train speed was 50 km/h) [32]. The investigated residential area of Klaipeda, where the measurements were conducted, had an equivalent noise level of 84 dB, and the trains reached a maximum speed of 30 km/h. Our study results showed that at 30 km/h train noise levels reached from 84 dB to 86 dB (maximal noise level).
Table 2 provides data on train speed, equivalent noise level, and maximum noise level depending on the time of day. According to a statistical analysis of the results shows that in the area, day and night train speeds were almost the same but the difference was 0.85 km/h. Equivalent noise level during the day was about 0.5 dB and a maximum of 0.8 dB higher than at night.
Table 2Comparisons between speed, equivalent noise level and maximum noise level during day and night periods in Klaipeda railway station. n.s. (differences not significant at a p< 0.05). Data in dB
Day time | Mean ± S.D | ||
Speed km/h | Day | 13.747±1.474 | n.s. |
Night | 14.592±1.717 | ||
Equivalent noise level | Day | 73.439±1.063 | n.s. |
Night | 72.988±1.239 | ||
Maximum noise | Day | 81.145±1.230 | n.s. |
Night | 80.335±1.432 |
These results suggest that in the territory of the passing trains, the noise level does not depend on time of day. In order to reduce the noise levels permitted by the values, special attention must be paid to the night-time noise levels allowed in residential areas at night because the vast majority of people are resting.
The results in Table 3 show that the equivalent noise level depends on the train type and distance to the railway tracks (0.89).
Table 3Summary of factorial ANOVA results for equivalent noise level
SS | Degree of freedom | MS | F | P | |
Intercept | 325901.6 | 1 | 325901.6 | 8192.413 | 0.000 |
Train type | 235.1 | 3 | 78.4 | 1.970 | 0.128 |
Distance | 208.2 | 1 | 208.2 | 5.233 | 0.0258 |
Train type *Distance | 23.7 | 3 | 7.9 | 0.199 | 0.8968 |
Error | 2307.3 | 58 | 39.8 |
The results in Table 4 show that the maximum noise level (similarly as the equivalent noise level) depends on the train type and distance to the railway tracks (0.91).
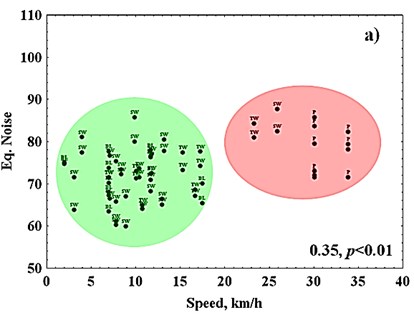
Fig. 2(a) shows the correlation between the equivalent noise level, distance and train type (0.35). This means that if the train speed is higher, equivalent noise level is also higher. Fig. 2(a) shows that the equivalent noise level of the results can be distinguished into two parts. Clearly (separated by different colours), the first part of the train crosses a studied area up to 20 km/h, while the second – more than 20 km/h. Reduced speed locomotives and freight trains cause less noise (left segment). Located on the higher-speed rail, passenger trains dominate the traffic, with noise levels of up to 90 dB. It is also possible to exclude the fact that passenger trains results in much less scatter compared with freight trains.
Table 4Summary of factorial ANOVA results for maximum noise
SS | Degree of freedom | MS | F | P | |
Intercept | 389997.6 | 1 | 389997.6 | 6928.836 | 0.000 |
Train type | 188.8 | 3 | 62.9 | 1.118 | 0.349 |
Distance | 188.9 | 1 | 188.9 | 3.356 | 0.072 |
Train type*Distance | 28.4 | 3 | 9.5 | 0.168 | 0.917 |
Error | 3264.6 | 58 | 56.3 |
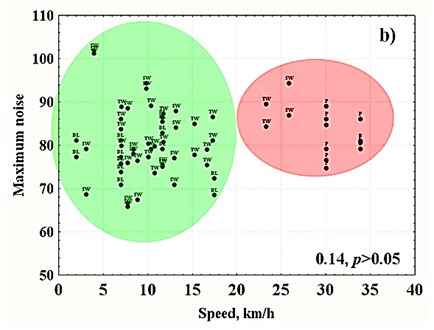
According to Fig. 2(b), we conclude that the maximum noise levels are not always dependent on the speed of the train. At the maximum noise level (102 dB), the train is travelling less than 5 km/h. This may be influenced by the fact that the train driver to see obstacles much activates the warning signals, which directly affects the maximum noise values. The top of the maximum noise levels can be caused by a pass at low speeds, but if the driver uses some warning signals. If these signals are used at night, that can disturb many people who are living near the railway. Fig. 2(b) shows that the dependence of maximum noise level on the speed of passing trains is not clearly visible (0.14).
Fig. 2Scatterplot of speed a) equivalent noise and b) maximum noise. Passenger (P), Sliding wall wagons (SW), Tank-wagon (TW) and Diesel locomotive (DL). Correlations significant at a p< 0.05. Noise levels in dB
a)
b)
The study revealed that the investigated residential area exposed to excessive rail noise levels. The results from the research in Austria concludes that residential areas should be considered as sensitive areas and the noise here must not exceed 55 dBA [19]. Our study confirmed that the rail noise-abatement measures and noise pollution reduction programmes should be implemented.
Different types of measures can achieve the reduction of railway noise. Rail noise-abatement programmes can be based on investments in the rolling stock (in renew of locomotives and wagons, and/or tracks); and on the propagation path of the sound with the construction of noise barriers along the railway [33]. Governments should encourage the development of modern modes of rail transportation, which produce less noise impact on the urban environment.
Another solution (alternative) is an implementation of trackside barriers, screens, planting etc. for the reduction of noise level in the cities and around them. The noise barriers are considered the most reasonable noise mitigation measures available. Acoustical design considerations include barrier material, barrier locations, dimensions and shapes [34]. The studies revealed that T-shape top barrier more effectively reduces noise level when compare with the traditional barrier (~2.5 dBA), if the high of the barrier is the same. The barrier with Y-shape and arrow-shape top are more effective than that of the traditional barrier, but less effective than barrier with T-shape top concerning the abatement of the noise level. The cylinder, pear, and octagonal-shape top of the barrier made from absorbing material can decrease the noise level up to 3 dBA [35]. According to the research in Japan, T-shape barrier reduces the noise level by the 1-2 dB, when compare with the barrier of O-shape, U-shape or Y-shape top, if the high of the screen is the same [36]. In the urban areas, the most popular are the transparent barriers. For instance, in Austria, for the effective rail noise-abatement the C-shape screens are applied, instead of covering the screen by the absorbing material. This way the rail noise is redirected to the rail tracks [37]. The noise modelling and theoretical calculations showed that C-shape screen application could reduce the noise at the almost the same level, as by using the straight, sound absorbing screens. Moreover, these C-shape screens are easy to assemble or dismantle, and their recycling expenses are very low [37]. Depending on the noise barrier material and surface treatment, a portion of the original noise energy is reflected or scattered back towards the source. Other portions are absorbed by the material of the noise barrier, transmitted through the noise barrier, or diffracted at the top edge of the noise barrier. In general, noise barriers could be divided into the following categories [34]:
• Reflective type – transparent and non-transparent;
• Absorptive type – sound absorbent materials and possible finishes of absorptive panels;
• Earth landscaped mound and retaining structures;
• Mixed type – a combination of the above types.
Nowadays the innovative materials and designs for sound protecting screens are used. The engineers designed sound insulation materials from cement, plaster, the waste of cellulose production and polymeric binders [38]. Suitable sound absorbing materials are wood, concrete, and the waste of agricultural production (straw, chaff, boon), along with non-cultural vegetation (reeds, rushes, cattails) [39]. According to the guidelines elaborated by the government of the Hong Kong, for the barriers, the following materials could be used: steel (painted, galvanized, stainless); aluminium; polycarbonate or acrylic sheets; concrete, brick or glass fibre reinforced concrete; proprietary-made acoustic panels; landscaped earth berm. [34]. An acoustic panel is typically made up of a perforated cover sheet enclosing noise absorptive material (mineral wool or fibreglass inside and wrapped up with polyester film) [34]. Rail noise can be reduced using different design of the railway track construction, for instance: the track in the pit, railway in the tunnel, and railway on the embankment [40].
Over the last years, changes in the noise policy were deemed necessary by the European authorities and the European Commission, and some have been implemented [33, 40-43]. In the early 2000s, the EU Commission recommended to enlarge the existing transport noise policy of the EU and to include railways, and to reduce the noise level along railway lines [44]. On 25 June 2002, Directive 2002/49/EC of the European Parliament and the Council relating to the assessment and management of environment noise (Environmental Noise Directive, END) was adopted. This was a step forward in developing the EU noise policy. To achieve this, the Directive requires the Member States to carry out a number of actions, in particular, to determine the exposure to environmental noise through noise mapping; to adopt action plans based upon the noise mapping results and; to ensure that the information on environmental noise is made available to the public. The Member States of the EU are required to use specified noise indicators of and and report the noise exposure of the population of 55 dB and 50 dB or more, respectively [42]. However, according to the latest WHO recommendations, reporting bands of the indicator values of should be lowered to 40 dB [42]. The Commission will consider further actions in relation to implementation improvements and possible measures on noise source reduction.
The strengths of our paper are that there have been applied more accurate and exclusive measurements. The paper used measurement method, when the speed of the train was determined using the length of the locomotive (knowing the dimensions of the one wagon, and the number of wagons) and the duration of time, for which the single measurement of the noise level for every wagon of the train was carried out. The measurements of the noise level have been starting, when the rain was crossing the alignment line; the measurements have been finished, when the last wagon of the train was crossing that line.
The authors used an innovative methodology for the assessment of the train speed, which allows to analyze and to reveal an impact of the speed of the different types of the passing trains on the noise values (on the different type train-induced noise).
All research has its limitations. The possibility of uncertainties still exists in calculation of the train length, and in regards to the fluctuations in the speed of the train (slowing and returning to the station, or accelerating and moving from the station).
4. Conclusions
Nearly 80 % of all measurements during the day were over the acceptable noise levels, and 100 % of measurements at night were over maximum allowed levels. The results of measurements showed that the analyzed rail noise is a serious problem to the residential area, which needs addressing by various organizational and technical measures.
It was found that the rail transport caused equivalent and maximum noise levels 20 m from the railway in the residential area were approximately 20 dB above the permissible noise levels; therefore, such areas need to use noise barriers.
The highest equivalent sound levels near the railway are measured, when the passenger trains were passing (up to 84 dB). Equivalent and maximum noise levels are mainly dependent on the train type and distance to the railway. A low speed pass can cause the biggest maximum noise levels, if the driver uses some warning signals.
References
-
Nunes P. A. L. D., Travisi C. M. Rail noise-abatement programmes: a stated choice experiment to evaluate the impacts on welfare. Transport Reviews: A Transnational Transdisciplinary Journal, Vol. 27, Issue 5, 2007, p. 589-604.
-
Xiaoan G. Railway environmental noise control in China. Journal of Sound and Vibration, Vol. 293, Issue 3-5, 2006, p. 1078-1085.
-
Plakhotnik V. N., Lakhnova J. V. Interaction of railway objects with the environment. Environmental Economics, Vol. 4, 2002, p. 163-169.
-
Baltrenas P., Petraitis E., Janusevicius T. Research and evaluation of noise level in the southern part of Panevezys. Journal of Environmental Engineering and Landscape Management, Vol. 18, Issue 4, 2010, p. 271-280.
-
Vaisis V., Janusevicius T. Modelling of noise level in the northern part of Klaipeda city. Journal of Environmental Engineering and Landscape Management, Vol. 17, Issue 3, 2009, p. 181-188.
-
Chan T., Lam K. The effects of information bias and riding frequency on noise annoyance to a new railway extension in Hong Kong. Transportation Research Part D: Transport and Environment, Vol. 13, Issue 5, 2008, p. 334-339.
-
Ilgakojis P., Jotautiene E., Merkevičius S., Bazaras J. An investigation of infrasonic in traffic flow noise. 11th International Conference on Urban Transport and the Environment in the 21st Century, Algarve, Portugal, Vol. 77, 2005, p. 511-520.
-
Zhang X. The directivity of railway noise at different speeds. Journal of Sound and Vibration, Vol. 329, Issue 25, 2010, p. 5273-5288.
-
Frohner K. D., Li Z. Evaluating improved illumination of railroad yards. Environmental Engineering, Vol. 6, Issue 2, 1998, p. 48-52.
-
Tassi P., Rohmer O., Schimchowitsch S., Eschenlauer A., Bonnefond A., Margiocchi F., Poisson F., Muzet A. Living alongside railway tracks: long-term effects of nocturnal noise on sleep and cardiovascular reactivity as a function of age. Environment International, Vol. 36, Issue 7, 2010, p. 683-689.
-
Zhang B. L., Di G. The influence of the visibility of the source on the subjective annoyance due to its noise. Applied Acoustic, Vol. 64, 2003, p. 1205-1215.
-
Vastfjall D. Influences of current mood and noise sensitivity on judgments of noise annoyance. Journal of Psychology, Vol. 136, 2002, p. 357-370.
-
Job R. S. F., Hatfield J., Carter N. L., Peploe P., Taylor R., Morrell S. Interrelationships between reaction to noise, noise sensitivity, prior knowledge of noise, and residential satisfaction. Proceedings of the 17th International Congress on Acoustics, Rome, 2001.
-
King R. P., Davis J. R. Community noise: health effects and management. International Journal of Hygiene and Environmental Health, Vol. 206, Issue 2, 2003, p. 123-131.
-
Muzet A. Environmental noise, sleep and health. Sleep Medicine Reviews, Vol. 11, Issue 2, 2007, p. 135-142.
-
Yoshida T., Nakamura S. Subjective ratings of health status and railway noise. Journal of Sound and Vibration, Vol. 127, Issue 3, 1988, p. 593-598.
-
Arezes P. A., Miguel A. S. Hearing protection use in industry: the role of risk perception. Safety Science, Vol. 43, Issue 4, 2005, p. 253-267.
-
Virokannas H., Anttonen H., Niskanen J. Health risk assessment of noise, hand-arm vibration and cold in railway track maintenance. International Journal of Industrial Ergonomics, Vol. 13, Issue 3, 1994, p. 247-252.
-
Lercher P., Botteldooren D., Widmann U., Uhrner U., Kammeringer E. Cardiovascular effects of environmental noise: research in Austria. Noise and Health, Vol. 13, 2011, p. 234-250.
-
Ustinaviciene R., PiesineL. Morbidity of textile industry workers in Kaunas. Medicina, Vol. 43, Issue 6, 2007, p. 495-500.
-
UstinavicieneR., Obelenis V., Ereminas D. Occupational health problems in modern work environment. Medicina, Vol. 40, Issue 9, 2004, p. 897-904.
-
Joynt J., Kang J. The influence of preconceptions on perceived sound reduction by environmental noise barriers. Science of the Total Environment, Vol. 408, Issue 20, 2010, p. 4368-4375.
-
Thompson D. J., Jones C. J. C., Waters T. P., Farrington D. A tuned damping device for reducing noise from railway track. Applied Acoustics, Vol. 68, Issue 1, 2007, p. 43-57.
-
Nekrasiene R., Kucinskiene J. Formation of green areas of the Klaipėda city. Urban green formation. Science Jobs, Vol. 1, Issue 8, 2011, p. 147-154.
-
Heutschi K. Sound propagation in railway line cuttings. Applied Acoustics, Vol. 69, Issue 12, 2008, p. 1189-1194.
-
Baltrenas P., Vasarevicius S. Transportation: technology, economics, environment, health. Technika, Vilnius, 2003, (in Lithuanian).
-
Grazuleviciene R., Bendokiene I. Influence of truck traffic on acoustic pollution in Kaunas districts crossed by highways. Journal of Environmental Engineering and Landscape Management, Vol. 17, Issue 4, 2009, p. 198-204.
-
LST EN ISO 3095:2005. Railway applications, Acoustics, measurement of noise emitted by the railbound vehicles.
-
LST ISO 1996-1:2005. Acoustics, Description, measurement and assessment of environmental noise. Part 1: Basic quantities and assessment procedures.
-
LST ISO 1996-2:2008. Acoustics, Description, measurement and assessment of environmental noise. Part 2: Determination of environmental noise levels.
-
Janssens M. H. A., Dittrich M. G., de Beer F. G., Jones C. J. C. Railway noise measurement method for pass-by noise, total effective roughness, transfer functions and track spatial decay. Journal of Sound and Vibration, Vol. 293, Issue 3-5, 2006, p. 1007-1028.
-
Ali S. A. Railway noise levels, annoyance and countermeasures in Assiut, Egypt. Applied Acoustics, Vol. 66, Issue 1, 2004, p. 105-113.
-
CEC, European Commission. CWG Railway Noise of the European Commission. Position Paper on the European Strategies and Priorities for Railway Noise Abatement. Luxembourg, 2003.
-
The Government of the Hong Kong. Guidelines of Noise Barriers. Hong Kong Environmental Protection Department, 2013, http://www.epd.gov.hk/epd/english/environmentinhk/noise/guide_ref/ design_barriers_content2.html.
-
Kotzen B., English C. Environmental noise barriers: a guide to their acoustic and visual design. Taylor & Francis, London, 2002.
-
Ishizuka T., Fujiwara K. Performance of noise barriers with various edge shapes and acoustical conditions. Applied Acoustics, Vol. 65, Issue 2, 2004, p. 125-141.
-
ProHolz Austria. Züge mit Aussicht. 2013, http://proholz-01.modulo.at/forschung_technik/panorama-18schallschutzwand.htm.
-
Kazragis A., Gailius A., Kulinič H., Tamulaitienė B. The utilization of straw and reed, and application in the construction products industry. Environmental Engineering, Vol. 2, 2002, p. 77-83, (in Lithuanian).
-
Kazragis A., Gailius A. Composite materials and products with natural organic fillers. Technika, Vilnius, 2006, (in Lithuanian).
-
The Ministry of Transport, Lithuania Road Authority. Recommendations on environmental measures for the design, installation and maintenance. Road traffic noise reduction APR-10 T, 2010.
-
European Commission. Review of the Implementation of Directive 2002/49/EC on Environmental Noise. Brussels, 2010.
-
European Commission. Report from the Commission to the European Parliament and the Council on the Implementation of the Environmental Noise Directive in accordance with Article 11 of Directive 2002/49/EC. Brussels, 2011.
-
Weber M., Driessen P. P. J., Hens A. C., Runhaar H. A. C. Drivers of and barriers to shifts governance: analysing noise policy in the Netherlands. Journal of Environmental Policy and Planning, Vol. 13, Issue 2, 2011, p. 119-137.
-
Kalivoda M.,Danneskiold-Samsøe U., Krüger F., Barsikow B. EURailNoise: a study of European priorities and strategies for railway noise abatement. Journal of Sound and Vibration, Vol. 267, 2003, p. 387-396.
About this article

