Abstract
This research investigates the difference of seismic ductility reduction factors between flexure-type and shear-type multi-degree-freedom (MDOF) systems. Multi-mass column cantilever systems are employed to simulate flexure-type shear-wall structure, while multi-mass series spring connection systems are used to simulate shear-type frame structure. Four earthquake records in hard soil site are employed to conduct nonlinear dynamic time history analysis. The effects of storey displacement ductility and vibration period on the seismic ductility reduction factors for flexure-type structure are studied, and the ductility reduction factors between flexure-type and shear-type structures are compared. The results show that the ductility reduction factors for flexure-type structure are about 40 % larger than those for flexure-type structure. Meanwhile, storey displacement ductility and storey number are important factors on seismic ductility reduction factors.
1. Introduction
The seismic ductility reduction factor, denoted as , is not only an important indicator in strength-based seismic design, but also a key factor to determine the inelastic response spectra in performance-based seismic design theory. Seismic ductility reduction factors are defined as the ratios of the minimum bearing capacity for structures keeping perfect elastic mechanical behavior to those keeping given ductility. In respect to the development and application in international seismic design codes, Zhai conducted a comprehensive review on seismic ductility reduction factors [1-2]. Previous researches on seismic ductility reduction factors mainly focused on single-degree-of-freedom (SDOF) system, such as classic Newmark rule, Nessar and Miranda models [1-5]. In recent years, investigation aspects have been extended to MDOF systems. For instance, Miranda and Zhai studied those factors based on concrete frame structures, Santa-Ana based on steel frames, and Moghaddamand Zhou based on shear-type MDOF systems [6-8]. All of these researches have gained deep and new insights into the seismic ductility reduction factor [8-10].
However, the current studies on the seismic ductility reduction factor are mainly based on structure models predominated by shear-type deformation. Few researches report on this factor using flexure or flexure-shear-type models. It needs to be further studied regarding whether there are apparent effects on the seismic ductility reduction factor for different flexure-shear stiffness ratios. In order to deeply understand the differences between various models, multi-mass column cantilever systems and multi-mass series spring connection systems are employed to simulate flexure-type shear-wall structure and shear-type frame structure, respectively. The effects of flexure-shear ratio on the seismic response in terms of top displacement, story maximum displacement ductility demand and base shear are studied. In addition, the displacement ductility demand and the seismic ductility reduction factor are compared between flexure-type and shear-type MDOF systems.
2. Ground motion records and MDOF systems
2.1. Ground motion records
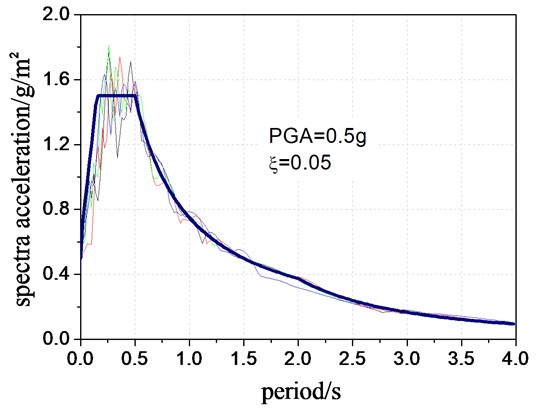
Four sets of earthquake record are selected and matched to moderate hard soil condition (360800 m/s, EC8) employing SeismoMatch software to eliminate the influence of sites [11, 12]. The details are presented in Table 1. The comparisons of the matched acceleration response spectra and the design response spectra are shown in Figure 1. The peak value of the response spectra ranges from 0.2 to 0.5 times period.
Table 1Ground motion records used in analysis
Number | Earthquake event | Date | Station | / g | / s | Duration / s |
Q1 | Kobe | 1995.01 | Nishi-Akashi NIS090 | 0.486 | 0.01 | 40 |
Q2 | Imperial Valley | 1940.04 | El Centro Site Irrigation District N180 | 0.319 | 0.02 | 30 |
Q3 | Loma Prieta | 1989.10 | Saratoga-Aloha Ave N360 | 0.504 | 0.02 | 40 |
Q4 | Northridge | 1994.01 | Newhall-La County Fire Station N360 | 0.589 | 0.02 | 30 |
Fig. 1Comparison of design response spectra and measured response spectra
2.2. MDOF systems
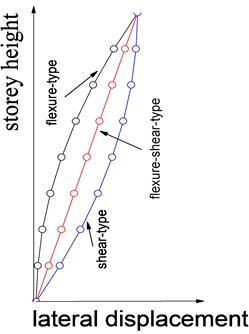
It’s widely acknowledged that the flexure-shear stiffness eigenvalue has great influence on the mechanic and deformation behavior for structures subjected to lateral loads with even or inverse triangle distribution along height. equals to 0 and for pure shear-type frames and pure flexure-type walls, respectively. While the takes value between 0 and , structure is defined as frame shear wall structure predominated by composite flexure-shear deformation.
The design response spectrum is defined by the European specifications using the shear wave velocity to define different types of venues, where 360800 m/s (EC8), and this it is widely considered as a standard method all over the world. The reason of recording is to ensure the consistency of site conditions since different site conditions would lead to a greater variation of seismic response. Figure 1 illustrates the site of this study is similar to site conditions in such a comparison, and in the comparison under conditions other venues.
The simplified column cantilever model, namely Sandwich beam, is widely used to model the shear walls in analyzing the global seismic behavior of tall buildings [13]. Choprahas validated the effectiveness of this simplified model [14]. In this research, multi-mass column cantilever system is employed to simulate the shear walls predominated by parabolic curve flexure deformation under static lateral loads with even distribution along height. The hysteretic curve of this system is based on the modified Clough hysteretic model. The stiffness degradation factor is set to be 0.001, and the shear deformation of the column is not considered. In comparison, a MDOF shear-type spring modelis used to simulate the shear-type frame structures, also employing the modified Clough hysteretic model. The effects of all the systems are not considered, and the first and second damping ratio of the structures is assigned to be 0.05. In this study, systems are modeled by structural static/dynamic analysis program CANNY2010 to conduct dynamic time history analysis, as shown in Figure 2 [15, 16].
3. The influence of flexure-shear stiffness ratio
For simplification, 8-storey models are designed as shown in Figure 2, where the storey height and the mass of each floor are equal in height. Simple harmonic sinusoidal excitations are inputted as presented in Figure 3 to conduct nonlinear dynamic time history analysis. The seismic responses in terms of vibration mode, top displacement and storey displacement ductility have been compared.
Fig. 2Deformation mode for systems and multi-mass model
(a) Lateral distribution model
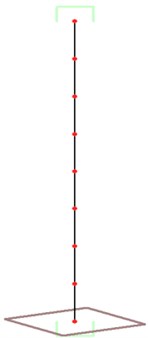
(b) MDOF column system
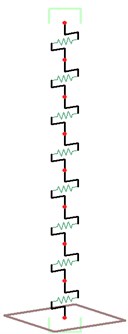
(c) MDOF shear-type system
Fig. 3Sample harmonic sinusoidal excitation
3.1. Comparison results for different initial periods
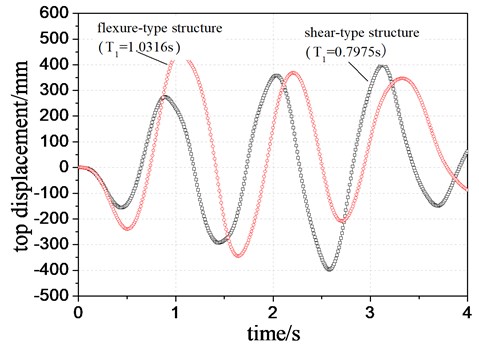
The story lateral strength and stiffness along height are firstly set to be the same both in the column cantilever flexure-type system and shear-type spring system. The 1st to 5th modal periods before and after loading are shown in Table 2, which shows that the modal periods differ greatly from each other between shear-type and flexure-type structure. The differences in mode periods are attributed to different story shear strength and different lateral deformation mechanism. The first vibration period is lager in flexure-type structure than that in shear-type structure. The modal period before and after loading in shear-type structure is smaller than that in flexure-type structure.
Table 2Comparison of mode periods
Mode | Shear-type structure | Flexure-type structure | ||
Before loading | After loading | Before loading | After loading | |
1 | 0.7975 | 1.0850 | 1.0316 | 1.3514 |
2 | 0.2546 | 0.2911 | 0.3478 | 0.3849 |
3 | 0.1519 | 0.1870 | 0.2135 | 0.2356 |
4 | 0.1137 | 0.1382 | 0.1579 | 0.1840 |
5 | 0.0929 | 0.1126 | 0.1288 | 0.1575 |
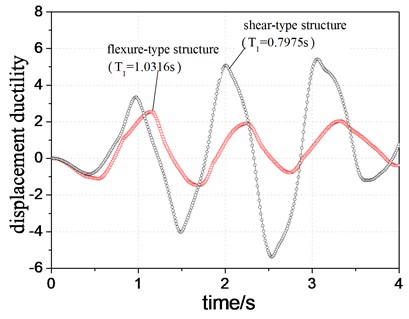
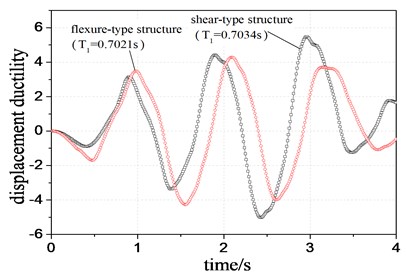
The top displacement demand (TDD) of two different systems with different modal periods, as presented in Table 2, is compared in Figure 4. It is demonstrated that the TDD in flexure-type structure is larger than that in shear-type structure due to different periods and deformation mechanism. In contrast, it is observed from Figure 5 that the maximum story displacement ductility demand (MSDDD) in shear-type structure is greatly larger than that in flexure-type structure. It can be explained that the flexure-type structure deforms lager in upper stories while the shear-type structure deforms lager in lower stories when subjected to external excitations. Thus, two different systems show the contrast variation trends in the displacement and ductility demand.
Fig. 4Comparison of top displacement of two structural systems with different periods
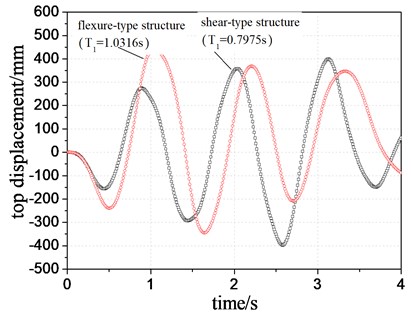
Fig. 5Comparison of maximum inter-story displacement ductility
3.2. Comparison results for same initial periods
The flexure-type systems and shear-type systems with a same initial period of 0.7 seconds are also studied by changing the stiffness of the corresponding system described in section 2.1. In other word, the lateral story stiffness in these two systems is different while their initial periods and the lateral story strength are kept the same with each other.
The TDD and MSDDD of two different systems with same period are shown in Figure 6 and Figure 7, respectively. Figure 6 indicates that the TDD of flexure-type structure is still larger than that of shear-type structure, in which there is a same variation trend with Figure 4. In addition, the TDD of both systems becomes smaller due to relatively small initial vibration periods. As shown in Figure 7, the MSDDD of flexure-type structure increases in comparison to that in Figure 5. This increment reduces the difference in MSDDD between the two systems. However, Figures 7 and 5 indicate the same trend that the MSDDD of flexure-type structure is larger than that of shear-type structure. It also demonstrates that the shear-type structure shows a better displacement ductility behavior.
In order to compare the maximum base shear demand of the two different systems, namely the seismic ductility reduction factors, the storey strength of these two systems are changed to be identical and the target ductility are set to be the same level. The following section will discuss these differences deeply by analyzing various parameters in terms of storey numbers, displacement ductility targets and initial periods.
Fig. 6Comparison of top displacement of two structural systems with same period
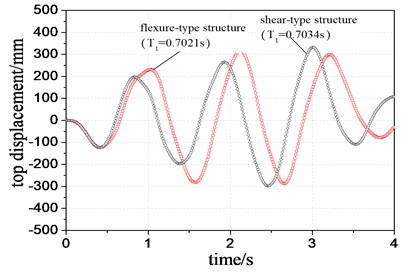
Fig. 7Comparison of maximum inter-story displacement ductility
4. The seismic ductility reduction factor
4.1. Analysis method
For MDOF systems, the seismic ductility reduction factor is defined as:
where is the seismic ductility reduction factor; and are the maximum base shear demand for MDOF systems under same earthquake intensity to keep complete elasticity and that to reach the ductility target of , respectively.
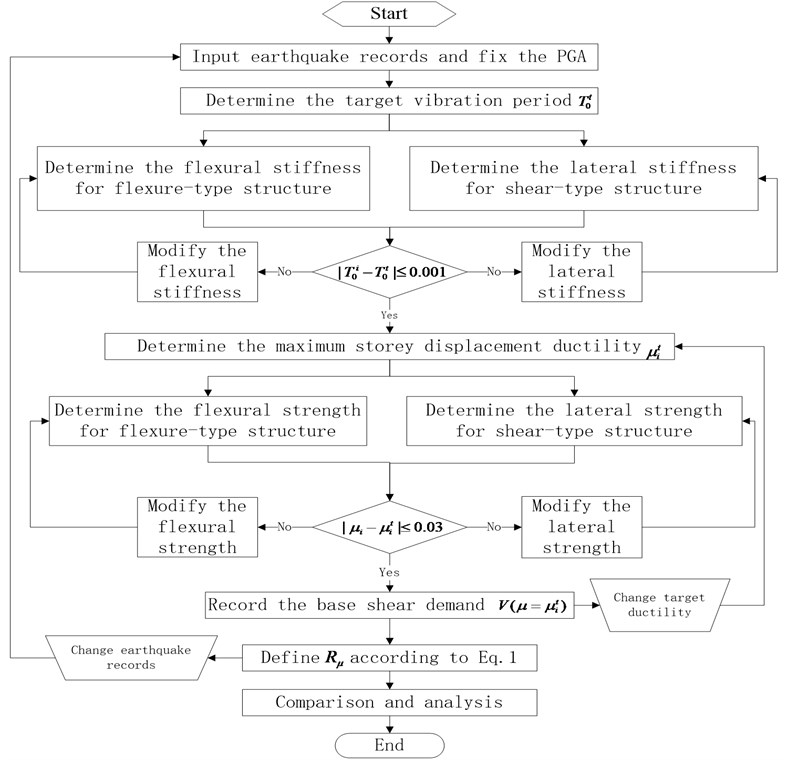
For simplicity, a flowchart is presented in Figure 8 to better understand the method principle and steps. A total of 768 nonlinear time history analysis are conducted accounting for the following permutations: 4 systems for both flexure-type and shear-type structures with 5-, 10-, 15- and 20-stories, respectively; 4 vibration periods ranging from 0.04 to 0.1 times the story number; 6 target ductility levels of 1, 2, 3, 4, 5, 6. It should be noted that the target ductility level in analysis is the maximum story displacement ductility factor rather than the target displacement ductility for global system.
This flowchart not directing structural design process, but rather how to get the ductility demand for computational analysis of the reduction factor, in fact, are reflected in the paper. As for each seismic record, there are mainly three aspects to analysis. First, adjust the model structure of the lateral stiffness of two structures to ensure the fundamental vibration period of the same type; second, adjust the lateral strength of the model structure ensures two types of structure ductility level of the basic the same; third, levels are calculated based on different ductility reduction factor and comparisons between the two types of structural models.
Fig. 8Flowchart for ductility reduction factors calculation
4.2. Influence factor analysis
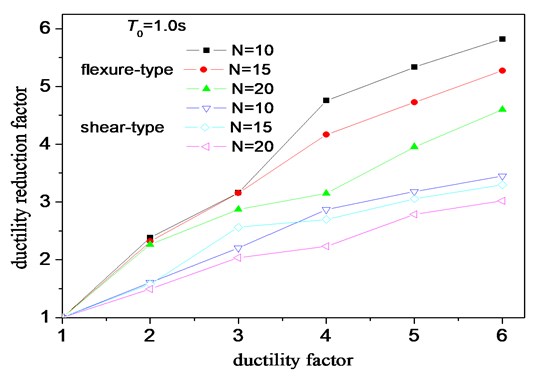
The averaged values of the ductility reduction factor are shown in Table 3 (see Appendix). As can be seen from Figure 9, the for flexure-type structure increases with the increment of target displacement ductility, which has the same trend with SDOF systems and shear-type structures. With the increment of the basic vibration period, there is no regular variation trend in . The shows a decline trends with increasing story numbers (also means increasing vibration periods to some extent). However, for an identical vibration period, the is generally observed to be small for both shear-type and flexure-type structure with higher height or more stories, especially for higher ductility level cases. It indicates that the story number has great influence on the ductility reduction factors, as shown in Figure 10.
4.3. Comparisons between two structural systems
For an identical story number, ductility level or basic vibration period, the for the flexure-type structure is observed to be larger than that for the shear-type structure. As shown in Table 3, the for the flexure-type structure is about 10 % larger than the for the shear-type structure under the conditions of a ductility level ranging from 2 to 6 and different basic vibration periods. There is no regular trend in ratio of shear-type system to flexure-type system with the increment of ductility and vibration period. The mean results of ratio are 1.387, 1.458, 1.372, and 1.392 for 5-, 10-, 15-, and 20-story structures, respectively. The total mean value of ratio for the above four structures is 1.402.
Fig. 9Effect of ductility factors on ductility reduction factors
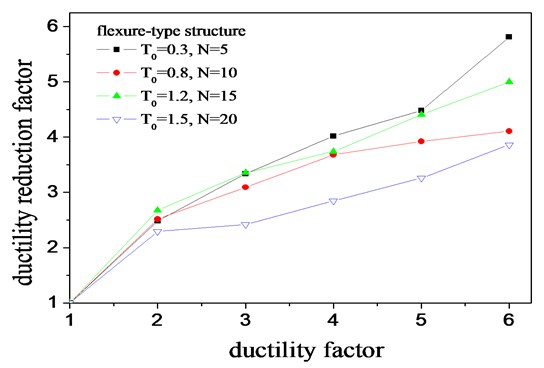
Fig. 10Effect of storey number on ductility reduction factors
According to several international seismic design codes, the seismic ductility reduction factor (namely the response modification factor or behavior factor) of the shear wall structure is generally smaller than those of the frame structures. For instance, EC8 defined the behavior factor for high-ductility concrete frame structure as 4.5, while the behavior factor for high-ductility concrete shear wall structure is 4.0. It seems that the results of this study are contradicted with these definitions. However, through profound analysis, it demonstrates that the two factors are not completely identical indexes, and the reasons include following two points: (1) the studied in this paper are completely based on the ductility dissipation energy mechanism, while the defined in seismic codes is based on composite mechanism of structural ductility, system damping, redundancy, structural over-strength, and etc.; and (2) the comparison on value between flexure-type and shear-type structure is assumed to be an ideal case with same storey number, ductility or vibration periods. In practical engineering, when the number of storey is equal, the ductility level and the basic vibration period of the shear wall structure are normally smaller than those of the frame structure (see Figure 5 and Figure 7). The difference in ductility level will induce great differences in seismic demand. However, the seismic design codes do not define different values accounting for the differences in storey number, ductility level and vibration period, and just adopt several values to consider all the differences together. Therefore, the seismic ductility reduction factor defined in seismic codes for the shear wall structure is generally smaller than those for the frame structure.
5. Conclusions
Seismic ductility reduction factors for flexure-type and shear-type structures are compared based on simplified MDOF systems and nonlinear dynamic time history analysis. The following conclusions can be drawn:
• The seismic response in terms of structural displacement ductility, base shear, and top displacement in flexure-type structure are different from those in shear-type systems, due to different deformation mechanism and lateral deformation modes.
• The structural storey ductility level and storey number have significant influence on ductility reduction factors of MDOF systems, while the basic vibration period of a structure does not show obvious influence on this factor.
• When parameters of structures, such as storey number, displacement ductility level and the basic vibration period, are the same, the ductility reduction factors of flexure-type structure are obviously larger than those of shear-type structure.
• The ratios of ductility reduction factors between the flexure-type and shear-type structures vary with the vibration period and the ductility level, but showing no regular change trends. In the present study, the ductility reduction factors for flexure-type structure are generally about 40 % larger than those for shear-type structures.
References
-
Zhai C. H., Xie L. L. State-of-art of applications of strength reduction factors in seismic design codes. Earthquake Engineering and Engineering Vibration, Vol. 26, Issue 2, 2006, p. 1-7.
-
Zhai C. H., Xie L. L. Progress on strength reduction factors in structural seismic design. Journal of Harbin, Institute of Technology, Vol. 39, Issue 8, 2007, p. 1177-1184.
-
Riddell R., Newmark N. M. Statistical analysis of the response of nonlinear systems subjected to earthquakes. Structural Research Series No. 468, Department of Civil Engineering, Urbana-Champaign, University of Illinois, 1979.
-
Nassar A. A., Krawinkler H. Seismic demands for SDOF and MDOF systems. Report No. 95. The John A Blume Earthquake Engineering Center, Stanford University, 1991, p. 12-45.
-
Miranda E. Site-dependent strength reduction on factors. Journal of Structural Engineering, Vol. 119, Issue 12, 1993, p. 3503-3519.
-
Miranda E. Strength reduction factors in performance design. EERC-CUREe Symposium in Horner of Vitelmo V. Bertero, Berkeley, California, 1997.
-
Zhai C. H., Xie L. L. Estimation of MDOF effects on strength reduction factors. Engineering Mechanics, Vol. 23, Issue 11, 2006, p. 33-37, 69.
-
Santa-Ana P. R., Miranda E. Strength reduction factors for multi-degree-of freedom systems. 12WCEE, Auckland, Newland, Vol. 1446, 2000.
-
Moghaddam H., Mohammadi R. K. Ductility reduction factor of MDOF shear-building structures. Journal of Earthquake Engineering, Vol. 5, Issue 3, 2001, p. 425-440.
-
Zhou J., Cai J., Fang X. D. Seismic ductility reduction factors for MDOF systems. Journal of Vibration Engineering, Vol. 20, Issue 3, 2007, p. 309-316.
-
Eurocode 8: Design of structures for earthquake resistance – general rules, seismic actions and rules for buildings. CEN, Brussels, 1998-1, 2005.
-
Seismomatch, software for adjusting earthquake accelerograms to match a specific target response spectrum. http://www.seismosoft.com/, 2011.
-
Potzta G., Kollar L. P. Analysis of building structures by replacement sandwich beams international. Journal of Solids and Structures, Vol. 40, Issue 3, 2003, p. 535-553.
-
Chopra A. K., Cruz E. F. Evaluation of building code formulas for earthquake forces. Journal of Structural Engineering, Vol. 112, Issue 8, 1986, p. 1881-1899.
-
Xia Y., Nassif H., Hwang E. S., Linzell D. Optimization of design details in orthotropic steel decks subjected to static and fatigue loads. Transportation Research Record: Journal of the Transportation Research Board, Vol. 2331, 2013, p. 14-23.
-
Li K. N. Three-dimensional nonlinear static/dynamic structural analysis computer program-user manual and data-input manual of Canny. Singapore, 2010.
About this article

