Abstract
Seismic isolation systems have been used to retrofit existing buildings. However seldom studies have focused on retrofit existing building groups by isolation system. This study uses base isolation technologies and story isolators to retrofit an existing tube connected building group. Base isolators are designed to protect the frames from strong earthquakes. Story isolators are chosen to provide lateral resistance and dissipate energies from serious earthquakes. Equations of motion are formulated to study the responses of the new building system to strong earthquake motions. Simulation results show the maximum drifts of the tubes and the maximum drifts of frame are very small. Maximum relative displacement between the tube and frame is much less than the seismic joint limit.
1. Introduction
Seismic isolation systems isolate structures from strong ground motions so as to reduce the energies transmitted from the ground to the structures and reduce the structural responses [1]. Seismic isolation technologies have been widely used to retrofit existing buildings [2-4]. For example Los Angeles City Hall, San Francisco City Hall and Oakland City Hall have been strengthened by seismic isolation systems [5-7]. Generally speaking, the retrofit process includes four steps: (1) set up temporary system to support the building to be retrofitted; (2) cut the original support elements (e. g. columns) at isolation level; (3) install the isolation devices; (4) remove the temporary support system [8, 9]. Sometimes it is necessary to construct a new raft to connect all seismic isolators together to form a base isolation layer [8, 9].
Conventional seismic isolation system isolates only one building structures. There are limited studies on strengthening an existing building group. There are two main differences between retrofitting an individual building and retrofitting a building group. The first one is that a building group usually is bigger and heavier. As a result, it is rather difficult to temporarily support a building group. The second difference is since generally speaking a seismic isolated building has large lateral displacements during strong earthquakes, pounding may occur within a building group retrofitted by seismic isolation systems. So it is necessary to take measures (e. g. connection dampers) to avoid pounding within a building group.
This study focuses on retrofitting a special type of building group by base isolators and story isolators. The building group consists of buildings connected by several circular tubes which act as entrance and exit passages. The Hong Kong Polytechnic University building group is similar to this type of building group. Except that there are no base isolators and story isolators, Fig. 1 schematically shows the building group before retrofitting. Corbels of the tubes support the floors of the two frames at connection regions. Such a building group is rather complicated to be temporarily supported and it is dangerous to horizontally cut the tubes to install seismic isolation devices. On the other hand, tube structures are commonly considered as good in resisting lateral forces [10]. Consequently, this study proposes to use base isolation systems to protect the frames and to use story isolators to link the tubes and frames to reduce large seismic responses and prevent poundings between the tubes and frames. The following mainly include three parts: first, the retrofit scheme is stated; then reduced order analysis model is established and numerical simulation results are analyzed at last.
2. Retrofit scheme
The retrofit scheme is schematically shown in Fig. 1. Details of story isolators are shown in Fig. 2. As compared with the original building group, in the new system (a) base isolators are installed at ground level to protect the frames above these seismic isolation devices; (b) the connection between the tubes and ground remains intact; and (c) the fixed-base tubes and the seismic isolated frame are connected at each floor level by story isolators. The story isolators are replaceable and acting as energy dissipation devices when subjected to winds or earthquakes. The story isolators can both absorb energies and transmit the weight of the frames to the tubes.
Fig. 1Tube connected building group
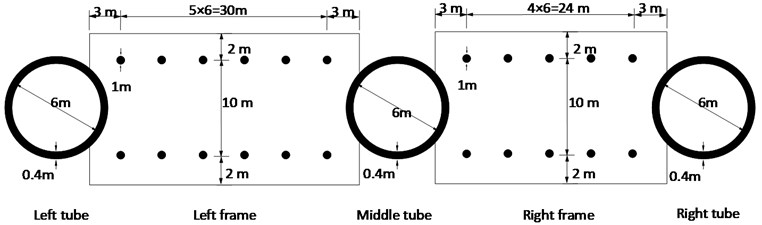
a) Floor plan
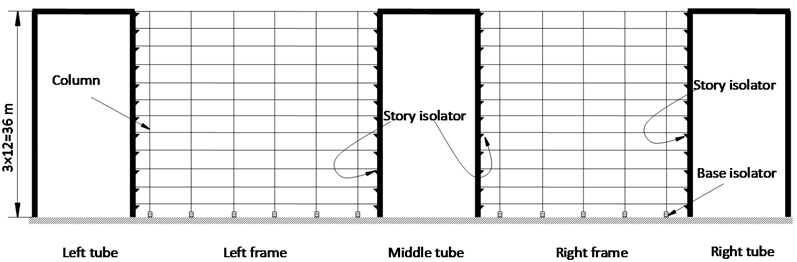
b) Elevation
The load transferring mechanism is as follows:
(1) Both the tubes and the isolated frame transfer the gravity load. The pressure caused by the weight of the frame transmitted to the tubes benefits the tubes by eliminating or reducing the vertical tensile stress in the tubes when the tubes are subjected to lateral forces.
Fig. 2Story isolators connected to tube wall
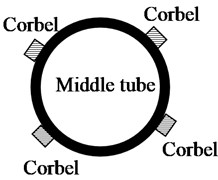
a)
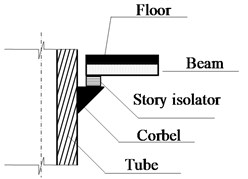
b)
(2) Under wind loading, tubes will provide the necessary lateral stiffness to limit the lateral deflection and to prevent possible wind induced oscillation.
(3) Under earthquake motion, tubes will be the principal lateral load resisting system and the frames will be protected by base isolators. The story isolators can dissipate energy to reduce responses.
3. Analytical model
Assuming the new building system is subjected to one direction ground motion and without considering torsional effects, then the system can be simplified to a two dimensional model. In analysis the tube and the frame are assumed to be linear elastic throughout the loading history.
3.1. Tube model
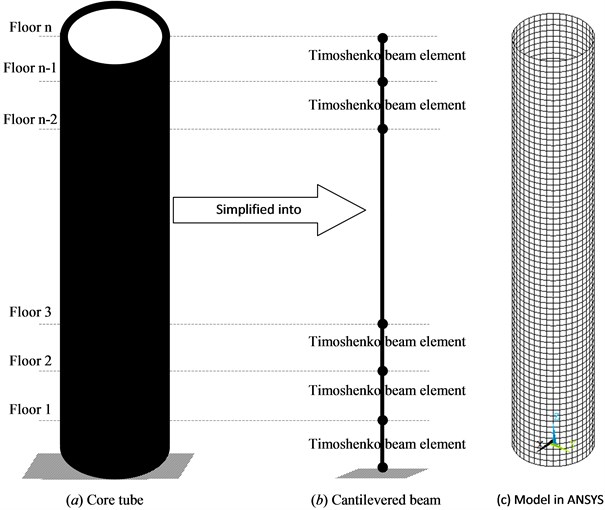
Elastic tube can be modeled by beam elements [11]. The classical beam model can simulate bending moment effects on deformations without transverse shear effect. The Timoshenko model developed the classical beam theory with first-order shear deformation effects with the assumption that cross sections remain plane and rotate about the same neutral axis as in the classical beam model, but do not remain normal to the deformed longitudinal axis [12]. The tube bears both flexural deformation and shear deformation when subjected to lateral forces. The Timoshenko beam elements are therefore chosen to simulate the tube in this study. As shown in Fig. 3, at each floor level the tube is divided into a number of segments which are connected at nodal points.
Fig. 3Tube and simulation model
3.1.1. Timoshenko beam element
Suppose the Timoshenko beam length is , transverse displacement is , bending rotation is at place (as shown in Fig. 4(a)), simple linear shape functions and are used, then the Timoshenko element’s consistent mass matrix [12] is:
where is the density of the tube, is the section area and is the moment of inertia [12, 13]. Element stiffness matrix is:
where is Young’s modulus, is shear modulus and is the shear coefficient of the Timoshenko beam. For the thin walled hollow circular section, the value of shear coefficient is in which is Poisson ratio [12, 13]. The coefficient equals to in which, are section size as shown in Fig. 4(b).
Fig. 4Timoshenko plane beam element
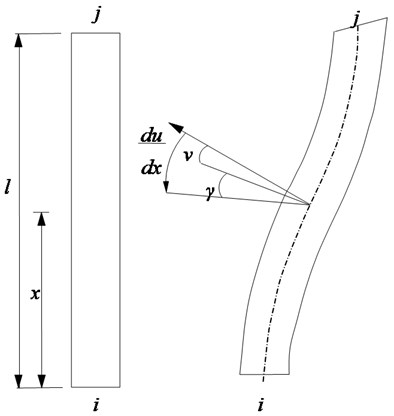
a) Timoshenko beam element
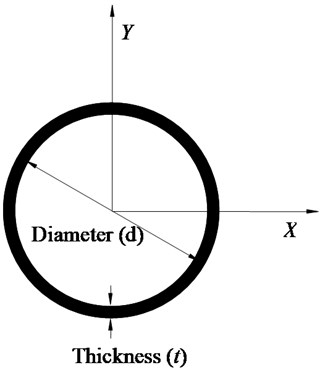
b) Tube section
3.1.2. Equations of motion of the tube
All the vertical Timoshenko beam elements can be assembled to yield the following equations of motion [14]:
where superscript denotes tube. , and are acceleration vector, velocity vector and displacement vector, respectively. , and are mass matrix, damping matrix and stiffness matrix of the tubes, respectively. is the ground acceleration. Position vector .
Rayleigh damping is adopted with the first and second modal damping ratios at 3 %.
Seismic responses of the tube at any time can be obtained by solving the equations of motion numerically using the Newmark- method [14]. The numerical procedure has been programmed using MATLAB software.
3.1.3. Error of the tube model
To verify the reliability of the proposed tube model, dynamic responses of the tubes in Fig. 1 subjected to three earthquakes are computed by solving Eq. (3) with MATLAB. The three earthquakes are shown in Table 1 [15-18]. Peak ground accelerations of the earthquake records are scaled to 4 m/s2 representing rarely occurred earthquakes. The height, diameter and thickness of the tube are respectively 36 m, 6 m and 0.4 m.
Table 1Earthquake records used
Earthquake | Station | Component | Year | Predominant periods (s) |
Imperial Valley | El Centro | 180 direction | 1940 | 0.08~0.54 |
Kern County | Taft Lincoln school | TAF111 | 1952 | 0.16~0.44 |
Kobe | Takarazuka | TAZ090 | 1995 | 0.16~0.48 |
Tube structures can be accurately analyzed by shell elements [19]. To investigate the accuracy of the proposed tube model, responses of the same tube subjected to the above three earthquakes are also analyzed by shell elements in ANSYS. Fig. 3(c) gives the simulation model in ANSYS. The maximum shell element size is 0.5 m×0.5 m. Table 2 compares the periods and the maximum responses of the tube computed by two methods in the same horizontal direction. The maximum difference is less than 6.60 %. The above indicates that Timoshenko beam elements can be used to approximately simulate the tubes.
Table 2Error of the Timoshenko beam model
(A) ANSYS | (B) Timoshenko beam model | Error | |
Fundamental period | 0.3221 s | 0.3204 s | 0.53 % |
Period for the second mode | 0.0626 s | 0.0617 s | 1.44 % |
Maximum displacement under El Centro | 44.50 mm | 44.05 mm | 1.01 % |
Maximum acceleration under El Centro | 19.55 m/s2 | 18.26 m/s2 | 6.60 % |
Maximum base shear under El Centro | 7.32 MN | 7.29 MN | 0.42 % |
Maximum displacement under Taft | 56.47 mm | 58.85 mm | -4.21 % |
Maximum acceleration under Taft | 21.41 m/s2 | 20.93 m/s2 | 2.24 % |
Maximum base shear under Taft | 8.82 MN | 9.12 MN | -3.42 % |
Maximum displacement under Kobe | 34.77 mm | 36.42 mm | -4.73 % |
Maximum acceleration under Kobe | 11.99 m/s2 | 11.80 m/s2 | 1.56 % |
Maximum base shear under Kobe | 6.35 MN | 6.69 MN | -5.39 % |
3.2. Model of connection isolators
Lead rubber bearings are installed in the structural system acting as story isolators. Lead rubber bearings can be modeled by Bouc–Wen models [1, 20]. The properties of the lead rubber bearings are defined by 3 parameters: total lead rubber bearings yield force , total initial shear stiffness and post-yield shear stiffness . Total initial shear stiffness of the lead rubber bearings is supposed to be 10 times the total post-yield stiffness (i. e. ) [1]. At each floor level, two LRB300 isolators are chosen to connect tubes and frames. The lateral post-elastic stiffness of a LRB300 is 0.435 MN/m and its yield force is 25.48 kN.
3.3. Isolated frame model
3.3.1. Base isolator model
1000 mm diameter natural rubber bearings (NRB1000s) are installed between ground and the isolated frames. Typical hysteresis loops of rubber bearings subjected to sinusoidal force are very small. Usually equivalent stiffness and equivalent damping ratio method is used to model natural rubber bearing [20]. In this study the equivalent stiffness and equivalent damping ratio of NRB1000 are assumed to be 1.485 MN/m and 3 %, respectively.
3.3.2. Floor shear model
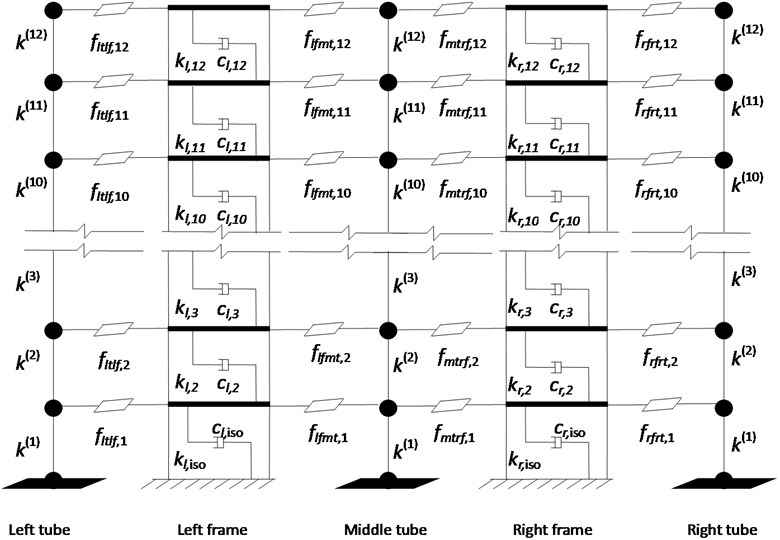
Multi-degree-of-freedom shear models can be used to simulate the isolated frames. The masses are assumed to be lumped at each floor level. Table 3 shows the masses and the lateral stiffnesses of the two frames shown in Fig. 5. The total masses of the left frame and the right frame are respectively 7.667×10³ tons and 6.835×10³ tons. When these frames are fixed to the ground, their fundamental periods are 1.1326 s and 1.1917 s, respectively.
Table 3Masses and lateral stiffnesses at each floor level
Left frame | Right frame | |||
Mass (ton) | Lateral stiffness (MN/m) | Mass (ton) | Lateral stiffness (MN/m) | |
Ground floor | 638.8 | 1.8462×101 | 569.6 | 1.5492×101 |
Other floor | 638.8 | 1.1286×10³ | 569.6 | 9.0694×10² |
The mass matrix of the isolated left frame is , in which are masses at each floor level as shown in Fig. 5.
Fig. 5Simulation model
The stiffness matrix of the isolated left frame is:
where are lateral stiffnesses at each floor level as shown in Fig. 5.
Rayleigh damping is adopted for the frame over isolation layer level with the first and second modal damping ratios at 0.03. The damping of the isolated left frame at isolation layer is:
where is the first modal circular frequency of the left isolated frame. is the damping ratio of base isolation system and is supposed to be 3 %.
The mass matrix, stiffness matrix and damping matrix of the right isolated frame are similar to the above mass matrix, stiffness matrix and damping matrix of the left isolated frame.
3.4. Model of the new building group and equations of motion
Fig. 5 shows the simplified simualtion model of the building group system. Three tubes are simulated by three beams and two floor shear models represent the left frame and right frame. Bouc-Wen models are used to simulate the connection isolators between the tubes and frames. The stiffness of connection isolators equals to the initial stiffness of the connection isolators in elastic region and post-elastic stiffness of the connection isolators in plastic region.
Equations of motion [14] of the structural system shown in Fig. 5 are developed in the form of:
where mass matrix , in which , and are respectively tube mass matrix, left frame mass matrix and right frame mass matrix. Similarly, damping matrix and stiffness matrix . , in which and are unit vectors indicating the position of the seismic forces applied on the left frame and the right frame. is the connection force provided by the story isolators. Subscripts lt, lf, mt, rf and rt respresent left tube, left frame, middle tube, right frame and right tube, respectively. The connection force is related to the relative displacement between the tubes and frames. For example at the first floor the story isolator force [1, 20] between the left tube and the left frame is:
where and are the respective yield stiffness and initial stiffness of LRBs.
, in which and are the displacements of the left tube and the left frame. is stiffness ratio. is hysteretic dimensionless quantity and satisfies the following relation [1]:
where is yield displacement and , and [1].
Eq. (6) may be rewritten in incremental form to be solved by Newmark- in combination with Newton-Raphson method [14] to obtain structural responses (e. g. acceleration, velocity and displacement) at any time . In the analysis tubes and frames are assumed to behave linearly elastic throughout the loading history.
4. Earthquakes input and simulation results
4.1. Site condition and earthquakes input
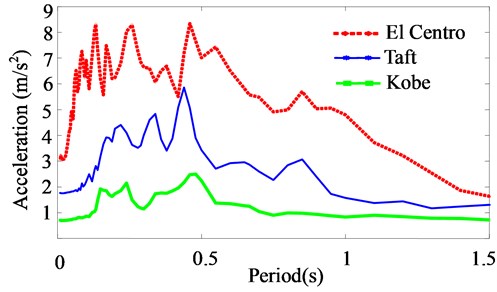
The building group is assumed to be located in a medium soft area with seismic intensity at the VIII degree in accordance with the Chinese code [18]. Fig. 6 shows the acceleration response spectra for the three earthquake records at 3 % damping.
Fig. 6Acceleration response spectra at damping ratio 3 %
4.2. Simulation results
In consideration of the nonlinear properties of the story isolators, small time interval 0.01/100 1×10⁻⁴ s is used. Fig. 7 shows the maximum drift of the tubes at each floor level when the system is under three earthquakes. Like a deformed cantilever beam subjected to transverse force, the maximum drifts of the tubes occure at the top floor level. The maximum drifts of the frame occur around at the second floor level. The maximum drifts of the building group and the corresponding story drift angles are shown in Table 4, which shows that the maximum drift angles are very small.
Table 5 indicates the reduction of maximum acceleration responses of the building group. The maximum accelerations of the tubes and the frames are reduced by at least 19.91 % and 64.66 %.
In addition, the maximum displacement can also be significantly reduced by the base isolators and story isolators. As an example the displacement histories of the left frame are shown in Fig. 8. It is observed that the retrofit strategy is effective in reducing the displacement responses of the left frame. Excited by three earthquakes before retrofit the root mean square displacement responses of the left frame are 37.92 mm, 36.16 mm and 14.60 mm, respectively. When base isolators and story isolators are installed, the root mean square displacement responses of the left frame are 14.78 mm, 19.04 mm and 9.59 mm, respectively. This indicates that the root mean square displacement responses can be reduced by more than 34.30 %. Similarly responses of the right frame can be observed.
Fig. 9 shows the maximum displacement envelopes of the frames. It is observed that the maximum displacement happens at the top floor level and the lateral displacement mainly occures at the isolation layer (the first floor level). These results show the two frames are well isolated from ground motions.
Fig. 7Maximum drifts of the tubes under three earthquakes
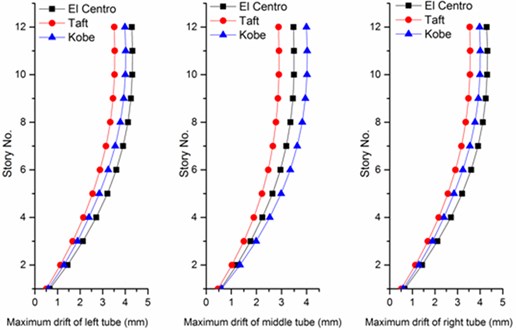
Fig. 8Displacement histories of the left frame under three earthquakes
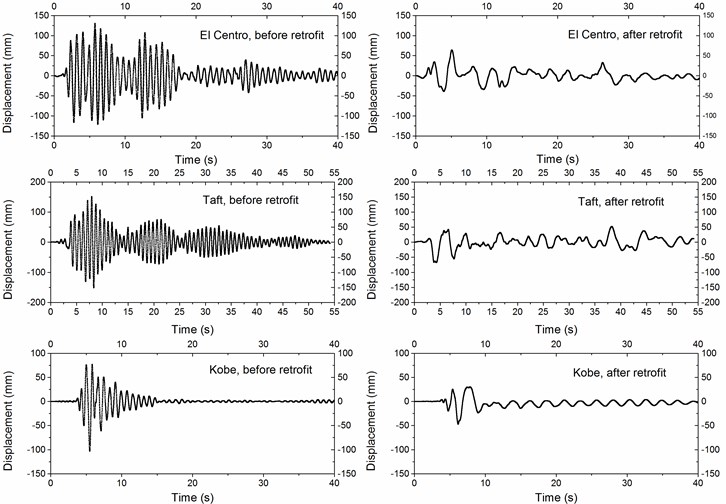
Table 4Maximum drift angles of the building group
Earth- quake | Left tube | Left frame | Middle tube | Right frame | Right tube | |||||
Before retrofit | After retrofit | Before retrofit | After retrofit | Before retrofit | After retrofit | Before retrofit | After retrofit | Before retrofit | After retrofit | |
El Centro | 1/208 | 1/695 | 1/208 | 1/3011 | 1/208 | 1/857 | 1/208 | 1/3011 | 1/208 | 1/694 |
Taft | 1/201 | 1/849 | 1/201 | 1/2977 | 1/201 | 1/1035 | 1/201 | 1/2978 | 1/201 | 1/842 |
Kobe | 1/191 | 1/747 | 1/191 | 1/2830 | 1/191 | 1/746 | 1/191 | 1/2830 | 1/191 | 1/749 |
Table 5Maximum accelerations of the building group (m/s2)
Earth- quake | Left tube | Left frame | Middle tube | Right frame | Right tube | |||||
Before retrofit | After retrofit | Before retrofit | After retrofit | Before retrofit | After retrofit | Before retrofit | After retrofit | Before retrofit | After retrofit | |
El Centro | 17.73 | 6.97 | 17.73 | 2.64 | 17.73 | 5.76 | 17.73 | 2.64 | 17.73 | 6.95 |
Taft | 13.21 | 5.14 | 13.21 | 2.49 | 13.21 | 4.60 | 13.21 | 2.49 | 13.21 | 5.15 |
Kobe | 7.11 | 5.31 | 7.11 | 2.51 | 7.11 | 5.69 | 7.11 | 2.51 | 7.11 | 5.31 |
Fig. 9Displacement envelope of the frames
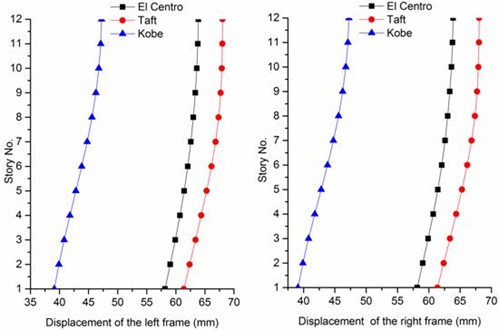
Fig. 10Maximum relative displacement (mm)
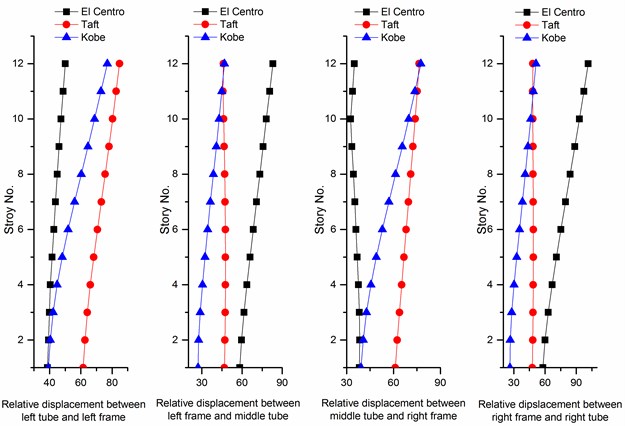
Fig. 10 shows the maximum relative displacement between the tubes and frames at each floor level. The maximum relative displacement response between the tubes and the frames to the El Centro earthquake is larger than corresponding responses to Taft earthquake and Kobe earthquake. The maximum relative displacement responses between the left tube and the left frame, between the left frame and the middle tube, between the middle tube and the right frame, between the right tube and the right frame are 8.5 cm, 8.3 cm, 7.7 cm and 10.1 cm, respectively. These values are much less than the minimum design seismic joint width, which is 21 cm according to the Chinese Code for seismic design of buildings [16].
The aforementioned results show that under three suitable earthquakes the responses of the building group are small. The relative displacements between the tubes and frames comply with the Chinese seismic design code. When proper seismic joint width is designed, pounding within the building group can be prevented.
5. Conclusions
This study explores the feasibility of using base isolation technologies and story isolators to retrofit an existing tube connected building group. Base isolators are designed to protect the frames from strong earthquakes. The equivalent stiffness and equivalent damping ratio of the base isolators (NRB1000) are respectively 1.485 MN/m and 3 %. At each floor two LRB300s are chosen as story isolators to provide lateral resistance and dissipate energy from serious earthquakes. The initial stiffness, post-elastic stiffness and yield force of a LRB300 are 4.35 MN/m, 0.435 MN/m and 25.48 kN respectively. Bouc-Wen model is used to simulate the connection lead rubber bearings. In consideration of Timoshenko model which can simulate shear deformation effects, the tubes are modeled by Timoshenko beam elements. Then the analytical model is established to formulate equations of motion of the building group. The structural responses to strong earthquake motions show that displacements of the frames mainly occure at isolation layer. As a result the frames are well isolated by base isolators. Numerical analysis indicates that the maximum drift angle of the tubes and the maximum drift angle of frame are less than 1/694 and 1/2830, respectively. The retrofit strategy can reduce the maximum acceleration of the tubes and the frames by at least 19.91 % and 64.66 % separately. In addition the maximum displacement can also be significantly reduced by the base isolators and story isolators. At last, the story isolators can control the relative displacement between the tubes and frames. Under three strong earthquakes the maximum relative displacement is 10.1 cm, which is much less than the seismic joint limit.
References
-
Naeim F., Kelly J. M. Design of Seismic Isolated Structures: from Theory to Practice. John Wiley, New York, 1999.
-
Buckle I. B., Mayes R. M. Seismic isolation: history, application, and performance – a world view. Earthquake Spectra, Vol. 6, Issue 2, 1990, p. 161-201.
-
Yin Q., Zhou L., Mu T. F., Yang N. J. System identification of rubber-bearing isolators based on experimental tests. Journal of Vibroengineering, Vol. 14, Issue 1, 2012, p. 315-324.
-
Yan B., Xia Y., Du X. L. Numerical investigation on seismic performance of base-isolation for rigid frame bridges. Journal of Vibroengineering, Vol. 15, Issue 1, 2013, p. 395-405.
-
Taylor A. W., Lin A. N., Martin J. W. Performance of elastomers in isolation bearings: a literature review. Earthquake Spectra, Vol. 8, Issue 2, 1992, p. 279-303.
-
Spencer B. F. Jr., Nagarajaiah S. State of the art of structural control. Journal of Structural Engineering, Vol. 129, Issue 7, 2003, p. 845-856.
-
Ibrahim R. A. Recent advances in nonlinear passive vibration isolators. Journal of Sound and Vibration, Vol. 314, Issue 3, 2008, p. 371-452.
-
Guerreiro L., Craveiro A., Branco M. The use of passive seismic protection in structural rehabilitation. Progress in Structural Engineering and Materials, Vol. 8, Issue 4, 2006, p. 121-132.
-
Matsagar V., Jangid R. Base isolation for seismic retrofitting of structures. Practice Periodical on Structural Design & Construction, Vol. 13, Issue 4, 2008, p. 175-185.
-
Fanella A. D. Reinforced Concrete Structures: Analysis and Design. McGraw-Hill, New York, 2010.
-
Ramamurty G. Applied Finite Element Analysis. Second Edition, I. K. International Publishing House Pvt. Ltd., New Delhi, 2010.
-
Karnovsky A. I., Lebed I. O. Non-Classical Vibration of Arches and Beams: Eigenvalues and Eigenfunctions. McGraw-Hill, New York, 2004.
-
Hutchinson R. J. Shear coefficients for Timoshenko beam theory. Journal of Applied Mechanics, Vol. 68, Issue 1, 2001, p. 87-92.
-
Chopra A. K. Dynamics of Structures: Theory and Applications to Earthquake Engineering. Prentice Hall / Pearson Education, New Jersey, 2011.
-
Ulrich P. F. The Imperial Valley earthquakes of 1940. Bulletin of the Seismological Society of America, Vol. 31, Issue 1, 1941, p. 13-30.
-
Steinbrugge K. V., Moran D. F. An engineering study of the Southern California earthquake of July 21, 1952, and its aftershocks. Bulletin of the Seismological Society of America, Vol. 44, Issue 2B, 1954, p. 201-462.
-
Zhao D. P., Negishi H. The 1995 Kobe earthquake: seismic image of the source zone and its implications for the rupture nucleation. Journal of Geophysical Research: Solid Earth (1978–2012), Vol. 103, Issue B5, 1998, p. 9967-9986.
-
GB50011-2010. Code for Seismic Design of Buildings. Chinese Architecture & Building Press, Beijing, 2010.
-
Hughes T. J., Liu W. K. Nonlinear finite element analysis of shells: Part I. Three-dimensional shells. Computer Methods in Applied Mechanics and Engineering, Vol. 26, Issue 3, 1981, p. 331-362.
-
Kelly J. M., Naeim F. Design of Seismic Isolated Structures. John Wiley & Sons, New York, 2000.
About this article

