Abstract
A dynamic finite element model of a coupled gear-rotor-bearing-housing gear system is developed by combining the gearbox transmission model with the housing structure model of subway gearbox with taking stiffness excitation, error exaction and meshing impact exaction as the dynamic excitation. The intrinsic modes and vibration response are computed in the numerical simulation process. Then an acoustic boundary element model of the gearbox is established by using the result of vibration displacement of the nodes on gearbox surface as acoustic boundary conditions. The surface sound pressure of gearbox and radiation noise of field points are solved by the direct boundary element method. In fact the proposed modeling approach not only provides a more comprehensive understanding of the subway gear system, but also can serve as the basis for dynamic and noise optimization of gear system. Finally a vibration and radiation noise experimental study is performed on the subway gear system. The vibration and radiation noise at some concerned locations are monitored and analysed. The comparison analysis shows that computational results are in good agreement with the data of experiment tests.
1. Introduction
Rail transit, as a solution to urban traffic congestion, has been widely used in major cities around the world. Meanwhile the problems of vibration and noise in the rail transit system have been attached more and more attention and vibration and noise reduction has become an issue which can not be ignored in the construction of rail transit. Subway gear system as one important part and main noise source of power equipment in the rail transit system, its numerical simulation and experimental research of vibration and noise have important theoretic significance and engineering practical value.
In recent years many scholars at home and abroad have obtained more achievements in the field of vibration response of gear system. The finite element analysis model of vibration response and the lumped parameter model of gear system are proposed based on the finite element method [1-2] and lumped parameters method [3-4], and the intrinsic modes and vibration response are analyzed. In terms of radiation noise prediction there has been a lot of research on radiation noise analysis using different methods, such as the Rayleigh integral method [5], near-field acoustical holography method [6-7], finite element method [8], boundary element method [9] and the infinite element method [10], then the sound pressure of gearbox is obtained [11, 12].
Therefore accurate analysis models of vibration response and radiation noise and efficient algorithm are the keys to precisely forecast vibration and radiation noise of complex gear system. However there are very few published works to solve the vibration response of a coupled gear-rotor-bearing-housing gear system based on finite element method and forecast radiation noise though the boundary element method, finally prove the validity of the models combining with experiments. In addition most of the past applications to gearbox problems focused on the dynamic characteristics analysis of internal geared rotor systems, and there are also very few papers dealing with the application of finite element method to model the bearing coupling between the internal geared rotor assembly and housing structure.
The main objective of this paper is to develop a method for predicting gearbox noise generated (i. e. from the vibration response step to radiation noise generation step) in a coupled gear-rotor-bearing-housing gear system by finite element method (FEM) and the direct boundary element method (DBEM), and then the validity of the model is proved by means of testing. The simulation results will provide the basis and reference for performing acoustic optimization of complex gear system.
2. Dynamic finite element model of subway gearbox
The geared transmission parameters of this subway gearbox are as follows: tooth number 16/101, normal module 6 mm, tooth width 97 mm, normal pressure angles 20°, helical angle 12.5°, the elasticity modulus of gear 2.06×10¹¹ Pa, density 7.85×10³ kg/m3, Poisson’s ratio 0.3, the input rotational speed 4160 rev/min (r/min) and the input power 180 kW.
Fig. 13D model of subway gearbox
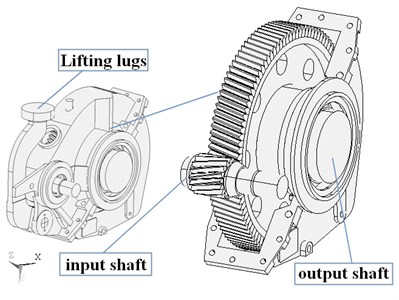
Fig. 2Dynamic finite element model
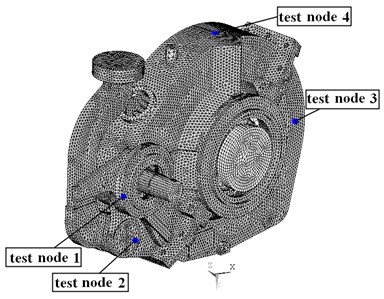
The three-dimensional (3-D) model of subway gearbox as shown in Fig. 1 is constructed basing on the above data. Then the dynamic finite element analysis model of gear system with a total of 279946 elements and 110733 nodes, as shown in Fig. 2, is established with gearbox housing, meshing gears, bearings and transmission shafts, and the support between shafts and bearings, and the relationships of gear meshing are simulated by the spring elements which are used to model the bearing coupling between the internal geared rotor assembly and housing structure. The main purpose of specified four test nodes is to compare computational results and experimental results for verifying the validity of analysis method.
Fig. 3The internal dynamic excitation curve
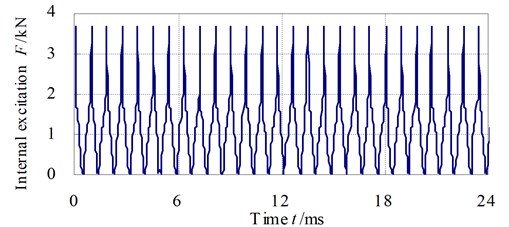
As shown in Fig. 3 the internal dynamic excitation curve can be obtain by the Gbvna software which is developed in our research group. It can be calculated by the following formula:
where is internal dynamic excitation, is variable part of mesh stiffness, is gear transmission error, is meshing impact force.
3. Dynamic characteristic analysis of subway gearbox
The intrinsic modes and vibration response of subway gearbox are analysed in this section, based on the Block Lanczos method and Newmark method. For all the numerical results proposed in this paper a 3 % viscous damping ratio is considered.
The finite element modal analysis of subway gear system is calculated with fully constrained lug and radial constraints imposed on the output shaft by using the commercial finite element analysis software (ANSYS). The first 10 modes of the coupled gear–rotor–bearing–housing structure system are obtained as listed in Table 1.
Table 1The first 10 modes of subway gear system
Mode no. | Frequency / Hz | Description of mode shape |
1 | 12.3 | Gearbox housing translation along the axis |
2 | 18.1 | Output shaft torsion |
3 | 63.3 | Gearbox housing torsion around axis |
4 | 154.2 | Input shaft torsion |
5 | 185.6 | Lateral wobble |
6 | 209.7 | Gearbox housing torsion around axis |
7 | 231.4 | Gearbox housing torsion around axis |
8 | 353.4 | Lug wobble |
9 | 414.3 | Complex deformation |
10 | 428.7 | Complex deformation |
For the subway gearbox example used in this study the input rotational speed is 4160 r/min, and the rotational frequencies of the input shaft and output shaft of the gearbox transmission are respectively 69.3 Hz and 10.9 Hz, and the gear meshing frequency is 1109.3 Hz. A comparison of these frequency values with those frequencies shown in Table 1 clearly illustrates that the rotational frequencies and gear meshing frequency do not overlap much with any of the system frequencies, therefore no resonance response is expected to occur for this gear system.
The 3-D finite element vibration response model is also settled when we make use of the ANSYS software based on the Newmark method. In the simulation the lug is fully constrained and the internal dynamic excitation is applied on the nodes on the engagement line of relative gears along the normal vector direction of the tooth surface. The total response time of interest is chosen to be 24 ms with the time step of 0.045 ms once the simulation results reach steady state. This requires several continuous periods in order to ensure that the effect of transient response is negligible.
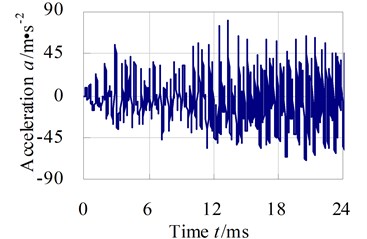
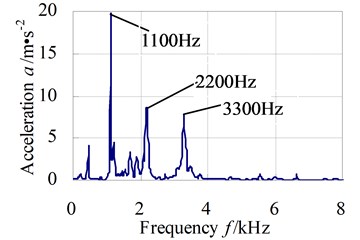
Fig. 4 shows the direction (vertical) vibration acceleration response in both time and frequency domains of test node 1. The acceleration response in frequency domain shows that the structure vibration energy mainly concentrates in the meshing frequency and frequency doubling of the gear system, nonetheless none of the resonances of the gear transmission appear. Additionally it can be observed that the response spectrum contains vibration energy not only at the expected excitation frequencies but also at other frequency points. This is an effect that is likely to be caused by the non-linear dynamic coupling at the gear mesh.
The calculated horizontal (-direction), vertical (-direction) and axial (-direction) RMS values of vibration acceleration response of four test nodes at housing surface are shown in Table 2.
Fig. 4Y direction vibration acceleration response in time and frequency domains of test node 1
a)
b)
Table 2The RMS values of vibration acceleration of the four test nodes (unit: m·s-2)
Node no. | Test node 1 | Test node 2 | Test node 3 | Test node 4 | |
Simulation value | -direction | 29.83 | 20.45 | 27.74 | 12.54 |
-direction | 27.86 | 21.51 | 22.51 | 76.59 | |
-direction | 30.93 | 24.13 | 57.38 | 28.31 | |
From Table 2 vibration acceleration response of test node 3 and test node 4 is larger, mainly because the positions of the two nodes are situated near the output shaft, which are without any constraints. Similar conclusions can be acquired for other nodes near the output shaft in the subway gear system.
A main objective of vibration response of subway gear system is to study the vibration severity which is the amount of vibration intensity. It can be expressed as:
where is vibration severity (unit: mm/s); , , are respectively -direction, -direction and -direction effective values of vibration velocity response (unit: mm/s); , , are respectively amounts of nodes in -direction, -direction and -direction.
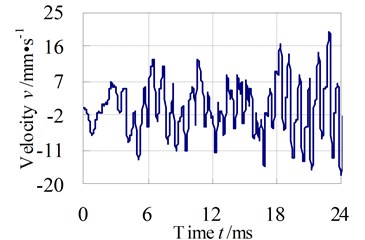
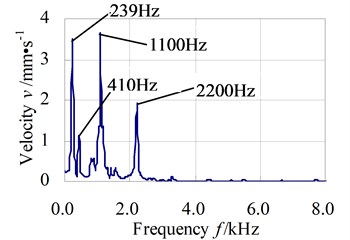
Fig. 5 exhibits the direction vibration velocity response in time and frequency domains of test node 1.
Fig. 5Y direction vibration velocity response in time and frequency domains of test node 1
a)
b)
The calculated -direction, -direction and -direction effective values of vibration velocity response of the four test nodes at the surface of housing are shown in Table 3.
Table 3The effective values of vibration velocity of the four test nodes (unit: mm·s-1)
Node no. | Test node 1 | Test node 2 | Test node 3 | Test node 4 | |
Simulation value | -direction | 10.54 | 6.59 | 8.60 | 10.86 |
-direction | 6.69 | 5.49 | 8.76 | 8.12 | |
-direction | 18.73 | 10.75 | 18.07 | 22.08 | |
Combining the formula (2) and above results in Table 3, the vibration severity of subway gear system can be calculated, 20.96 mm/s. From Table 3 vibration velocity of the top of gearbox is greater than of the other parts.
Forecasting the structural noise which can be represented by acceleration or acceleration level is another objective of vibration response of subway gear system. To compute the acceleration structural noise level, the previous computed structure vibration response data are employed. The vibration results are first condensed into one-third octave bands. Within each band the acceleration noise level in decibels (dB) can be computed from the formulation:
where is the net acceleration value in m/s2 at a given centre frequency; is the reference acceleration, 1×10⁻⁶ m/s2.
Fig. 6 presents the -direction acceleration structural noise levels of test node 1 from 16 Hz~8 kHz, which are simply an indirect representation of the severity of radiated noise.
Fig. 6Y-direction acceleration structural noise levels of test node 1
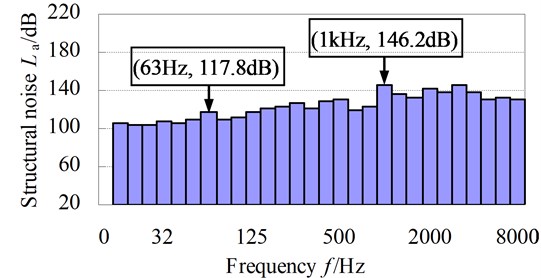
The plot shows that the maximum acceleration structural noise levels of this subway gear system seem to appear near the meshing frequency of 1109.3 Hz. Hence the performances of the gear meshing will be likely to influence the generated vibration and noise levels greatly.
4. Radiation noise prediction of subway gearbox
In this section the radiation noise of subway gearbox will be solved based on the direct boundary element method (DBEM). For the acoustic radiation problem the radiation sound pressure in external fluid medium yields by Helmholtz equations, fluid-solid interface boundary and Sommerfeld radiation conditions [13, 14]:
where is the acoustic pressure, is the wave number , is the circular frequency and is the speed of sound, is the outside normal unit vector on the structure surface , is the density of fluid, is the normal displacement on the structure surface , is the distance between the arbitrary point of outside sound field on the structure surface and the point source location .
Using the Green’s functions, the direct Helmholtz integral equation can be obtained:
where is a coefficient dependent on the position of the point . If is located inside the domain, is equal to 1; otherwise is equal to 0.5 for smooth surface. is Green’s function.
The basic equation of radiation sound field is gained on the basis of boundary element method and it can be represented in the form of matrix:
where and are the influence matrices, is vector of pressures at the nodes, is the vector of nodal normal velocities on BE surface.
Then the radiated sound pressure of any outside field point can be achieved by interpolation:
where and are the vectors of interpolation.
For the subway gear system example used in this study, the boundary element model with boundary elements and nodes totaling 45732 and 22864 is shown as Fig. 7, and the vibration displacements of nodes of gearbox surface would be used as the acoustic boundary conditions in the boundary element model. The exterior radiation noise will be predicted using the software SYSNOISE.
Fig. 7Acoustic boundary element model
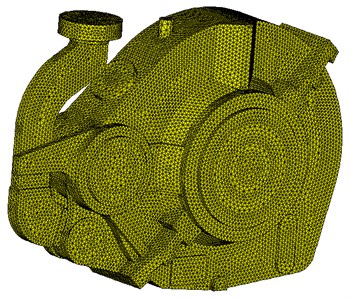
Fig. 8Surface sound pressure contour of gearbox
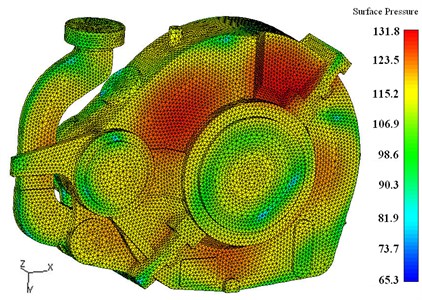
The proprieties of the acoustic field are density 1.225 kg/m3, sound speed 340 m/s and reference sound pressure 2×10⁻⁵ Pa. The calculated frequency range from 31.5 Hz to 16 kHz is set according to octave frequency. From the acoustic analysis the surface sound pressure contour of gearbox is shown in Fig. 8 for the frequency 1000 Hz. The figure gives an overview of the noise pressure distributions on the surface of gearbox. Reviewing the Fig. 8 we can see clearly that the maximum value of surface sound pressure is 131.8 dB(A), it occured at the top of bearing of the output shaft end.
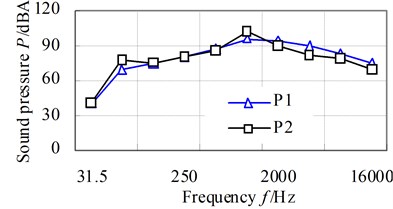
The locations of field points are described in Fig. 9, which is apart from surface around the gearbox 1 m. The noise pressures of field points are shown in Fig. 10, and it shows that the noise pressure peak occures at 1000 Hz for P2 and the maximum values are approximately 100.6 dB(A).
Fig. 9Locations of field points
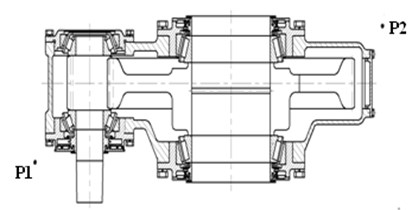
Fig. 10Noise pressure of field points
5. Comparison of predicted structural noise and radiation noise with test results
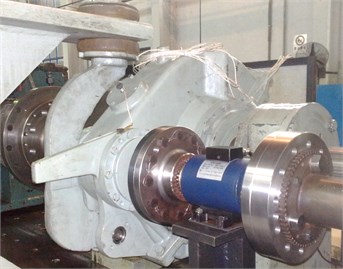
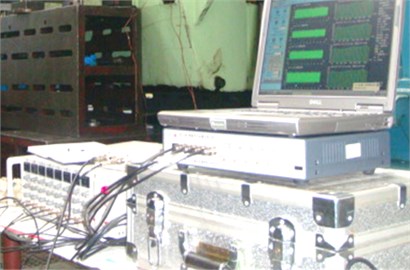
The subway gearbox vibration and noise test rig as shown in Fig. 11 is used to perform structural noise and radiation noise measurements, and to investigate the dynamic characteristics of the subway gear system and to validate the numerical results. Main test equipments include B&K-4382 acceleration sensors, INV306U-5260 intelligent signal acquisition instrument, amplifier and HY104 sound level meter, et al.
Fig. 11Overview of the subway gearbox vibration and noise test rig
a)
b)
Accelerometers 1~4 are respectively mounted to the position of test nodes 1~4, as shown in Fig. 2, to measure the vibration accelerations along -direction, -direction and -direction. The tested -direction, -direction and -direction effective values of vibration velocity response of the four test nodes on housing surface are shown in Table 4.
Table 4The effective values of vibration velocities of the four test nodes (unit: mm·s-1)
Node no. | Test node 1 | Test node 2 | Test node 3 | Test node 4 | |
Test values | -direction | 7.09 | 6.15 | 6.75 | 11.69 |
-direction | 9.33 | 7.27 | 8.78 | 4.56 | |
-direction | 14.39 | 12.52 | 16.30 | 16.12 | |
From the comparison of simulation values listed in Table 3 with the test values shown in the above Table 4 it can be seen that simulation value of vibration severity is 20.96 mm/s whereas test value of vibration severity is 18.65 mm/s. It has an error of 11.02 %.
Fig. 12 shows the comparison curves of simulation values of structural noise with the test values from the acceleration response. It shows that the simulation values of structural noise essentially agree with test values in various frequency bands 16 Hz~8000 Hz and the frequency of structural noise peak occurs at the gear mesh frequency.
Fig. 12The comparison curves of simulation structural noise with test values
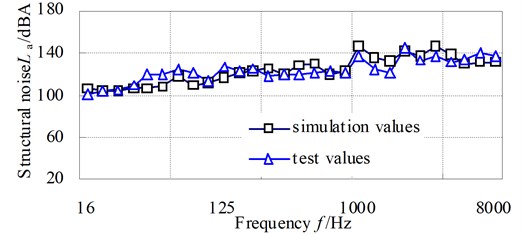
Fig. 13 shows the comparison curves of predicted radiation noise with the test values by A-weighting octave analysis.
Fig. 13The comparison curves of simulation values and test values of radiation noise
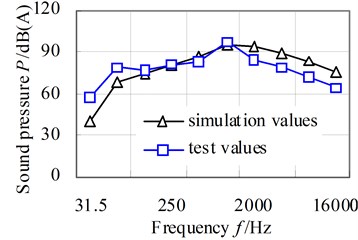
a) Field point 1
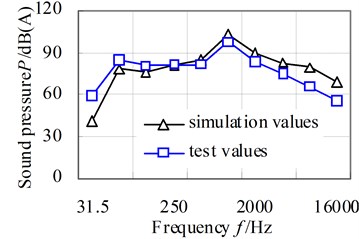
b) Field point 2
It can be apparently seen from results that the rule of both curves is basicly similar. The predicted noise pressure level is slightly lower than that of test results for the frequency range below 63 Hz, i. e. the simulation results tend to be an underprediction for the lower frequencies. The reason is likely to be that the engine mechanical vibration effect, which is dominant at the lower frequencies, has not been taken into account in the subway gear system. For the higher frequencies the simulation results tend to overpredict the noise level. This is due to the higher errors involved when predicting high frequency owing to the inherent limitations in the FEM and DBEM. In the further study more accurate model will be introduced.
6. Conclusions
(1) The results of dynamics characteristics analysis of subway gear system show that any system frequencies do not overlap much with rotational frequency and gear meshing frequency, and the maximum value of vibration response in frequency domain appears near the meshing frequency.
(2) The results of radiation noise pressure for field points show that the noise pressure peak point occures at 1000 Hz and the maximum value is approximately 100.6 dB(A).
(3) Although minute discrepancy of predicting results and test values exists, the difference between predicted and measured radiation noise levels is acceptable. In spite of this, it is possible to confirm that the proposed analysis models for predicting the exterior noise level of subway gear system are a reliable approach and it can provide us a powerful and efficient method for further noise reduction and control of the gear system.
References
-
Lin Teng-Jiao, Liao Yong-Jun,Li Run-Fang, et al. Numerical simulation and experimental study on radiation noise of double-ring gear reducer. Chinese Journal of Vibration and Shock, Vol. 29, Issue 3, 2010, p. 43-47.
-
Abbes M. S., Trigui M., Chaari F., et al. Dynamic behaviour modelling of a flexible gear system by the elastic foundation theory in presence of defects. European Journal of Mechanics – A / Solids, Vol. 29, Issue 5, 2010, p. 887-896.
-
Ambarisha V. K., Parker R. G. Nonlinear dynamics of planetary gears using analytical and finite element models. Journal of Sound and Vibration, Vol. 302, Issue 3, 2010, p. 577-595.
-
Fernandez Del Rincon A., Viadero F., Iglesias M., et al. A model for the study of meshing stiffness in spur gear transmissions. Mechanism and Machine Theory, Vol. 61, 2013, p. 30-58.
-
Abbes M. S., Bouaziz S., Chaari F., et al. An acoustic structural interaction modelling for the evaluation of a gearbox-radiated noise. International Journal of Mechanical Sciences, Vol. 50, Issue 3, 2008, p. 569-577.
-
Barthod M., Hayne B., Tebec J. L., et al. Experimental study of dynamic and noise produced by a gearing excited by a multi-harmonic excitation. Applied Acoustics, Vol. 68, Issue 9, 2007, p. 982-1002.
-
Xiang Chang-Le, Chen Fu-Zhong, Liu Hui. Experimental research on noise source identification and the radiation characteristics of a gearbox based on NAH. Chinese ACTA ARMAMENTARII, Vol. 30, Issue 11, 2009, p. 1424-1429.
-
Liu Z. S., Lu C., Wang Y. Y., et al. Prediction of noise inside tracked vehicles. Applied Acoustics, Vol. 67, Issue 1, 2006, p. 74-91.
-
Jiao Ying-Hou, Kong Xia, Cai Yun-Long, et al. Vibration noise calculation and testing analysis of large vertical planetary transmission gearbox based on FEM and BEM. Chinese Journal of Vibration and Shock, Vol. 31, Issue 4, 2012, p. 123-127.
-
Autrique J. C., Magoules F. Analysis of a conjugated infinite element method for acoustic scattering. Computers and Structures, Vol. 85, Issue 9, 2007, p. 518-525.
-
Zhou Jian-Xing, Liu Geng, Ma Shang-Jun. Vibration and noise analysis of gear transmission system. Chinese Journal of Vibration and Shock, Vol. 30, Issue 6, 2011, p. 234-238.
-
Lin Long, Li Hong-Yun, Chen Da-Yue. Calculation and analysis of vibration and noise of subway gear box. Chinese Noise and Vibration Control, Vol. 27, Issue 2, 2007, p. 37-39.
-
Li Zeng-Gang, Zhan Fu-Liang. Senior Application Examples of Acoustic Simulation Based on Virtual.Lab Acoustics. National Defense Industry Press, Beijing, 2010.
-
D’Amico R., Neher J., Wender B., et al. On the improvement of the solution accuracy for exterior acoustic problems with BEM and FMBEM. Engineering Analysis with Boundary Elements, Vol. 36, Issue 7, 2012, p. 1104-1115.
About this article

The authors are grateful for the financial support provided by the National Natural Science Foundation of China under Contract No. 51175524 and the Central University Basic Scientific Research Business Expenses, No. CDJXS121100-14. The CN Gpower Gearbox Co., Ltd. of China is thanked for providing the test site of subway gear system.
