Abstract
Leg stiffness is an important parameter when performing various motions. Ground reaction force, duration of support, displacement of the body mass center as well as step frequency during running or jumping depend on stiffness of the leg (McMahon, 1990; Farley, 1996; Granata, 2001). It is not clear yet how foot stiffness changes with deformation, how it is related to the deformation speed, to the number of repetitions, what influence do soft tissues have on stiffness of a foot. The aim of this research is to determine whether foot compression-displacement dependency changes when compressing foot repeatedly, does foot stiffness depend on compression speed. The specimen was a right foot with normal longitudinal arch from a Caucasian female. 25 kN force Tinius Olsen H25K-T testing machine was used in the study. The compression rate was 25 mm/min, 50 mm/min, 100 mm/min and 500 mm/min until 1000 N force was reached. The deformation and stiffness of the foot at different compression speeds were analyzed when 400 N and 700 N force was reached. Despite the compression speed differences the values of Intraclass correlation coefficient show data repeatability when compressing the foot repeatedly. The foot stiffness remained stable at 25-100 mm/min foot compression speed. At compression speed higher than 100 mm/min foot stiffness decreased significantly. The regression equation was derived to describe dependence between stiffness and relative deformation of foot with soft tissue.
1. Introduction
Leg stiffness is an important parameter when performing various motions. Ground reaction force, duration of support, displacement of the body mass center as well as step frequency during running or jumping depend on the stiffness of the leg [1-3]. Many scientists who analyze leg stiffness, simulate the leg using a spring mass model [4-6] or use a multi-joint model consisting of 4 segments (foot, shank, thigh, head-arms-trunk) and 3 torsion springs (ankle, knee and hip) [4, 7]. These models do not analyze foot, although its mechanical characteristics are extremely important while absorbing dynamic powers. It is believed that stiffness of a foot determines foot ability to perform the impact damper function.
The foot arch mechanical characteristics were analyzed experimentally compressing cadaveric feet [8-10] and using mathematical foot models [11, 12].
The above mentioned foot compression research did not present any results on foot stiffness, which is highly significant when simulating both foot and the leg itself. It is not clear yet how foot stiffness changes with increasing deformation, how it is related to the deformation speed, the number of repetitions, what influence do soft tissues have on the stiffness of a foot.
The aim of this research is to determine whether foot compression-displacement dependency changes when compressing foot repeatedly, does foot stiffness depend on compression speed.
2. Methods
The specimen was a right foot with normal longitudinal arch [13] from a Caucasian female. The right limb was amputated due to irreparable vascular disease. At the time of surgical procedure the age of the donor was 64 years, body weight and height were 69 kg and 1.68 m respectively. The foot was disarticulated at the ankle with preservation of all soft tissues. The specimen was evaluated for clinical and radiographic normality by orthopedic surgeons prior to testing [14]. The foot was sealed in double plastic bags and stored in a freezer at -20 °C [15]. It was thawed at room temperature for 24 hours before testing [16]. The National Bioethics Committee reviewed and approved the study protocol.
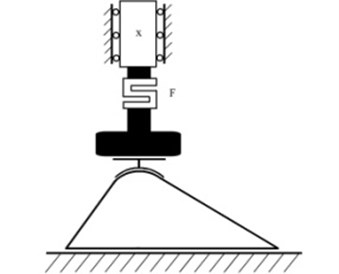
For in vitro analysis of mechanical properties of the foot Kelvin-Voigt viscous elastic model [17] was chosen. A 25 kN force Tinius Olsen H25K-T testing machine was used in the study. The foot was placed on the machine so that talus would be in the pressing centre (Fig. 1). The compression rate was 25 mm/min, 50 mm/min, 100 mm/min and 500 mm/min until 1000 N force was reached. At the speed range from 25 to 100 mm/min the foot with soft tissue was compressed ten times, at the speed of 500 mm/min it was compressed four times. There was an interval of 2 minutes between each compression.
Fig. 1A schematic diagram of the foot compression experiment
During compressions the Tinius Olsen H25K-T testing machine indicated values of displacement (mm) and force (N). Before the test a light reflective marker was attached to the talus body medial surface. The marker’s diameter was 5 mm. The foot sagittal plane was recorded with 25 Hz Panasonic NV – GS330 camera and motion analysis program SIMI Motion was used to analyze the recordings. The recordings were used to calculate the talus height, which indicates the height of the foot before each compression.
Deformations and stiffnesses of the foot at different compression speeds were analyzed when 400 N and 700 N force was reached. Stiffness of the foot was calculated according to displacement change when compression force increased from 350 N to 400 N and also from 650 N to 700 N. The formula used for calculation is stiffness (N/mm) = 50 N/displacement change. Strain (%) was calculated dividing deformation at 400 N and 700 N force compression by primary talus height and multiplying by 100 %.
Statistical analysis was carried out with the Statistical Package for Social Sciences (SPSS 17). In order to evaluate foot compression-displacement dependency, a reliability analysis was applied compressing the foot repeatedly. Also Intraclass correlation coefficient was calculated (Model: Two-Way Mixed, Type: consistency, 95 % confidence interval).
The foot deformations and stiffness variations at different compression speeds were determined using nonparametric Mann-Whitney U test. The level of importance which is equal to 0.05 has been chosen to check the statistical hypothesis.
The regression equation was used to describe dependence between stiffness and relative deformation of foot with soft tissue.
Fig. 2Talus displacement-force graphs when compressing the foot at different speeds
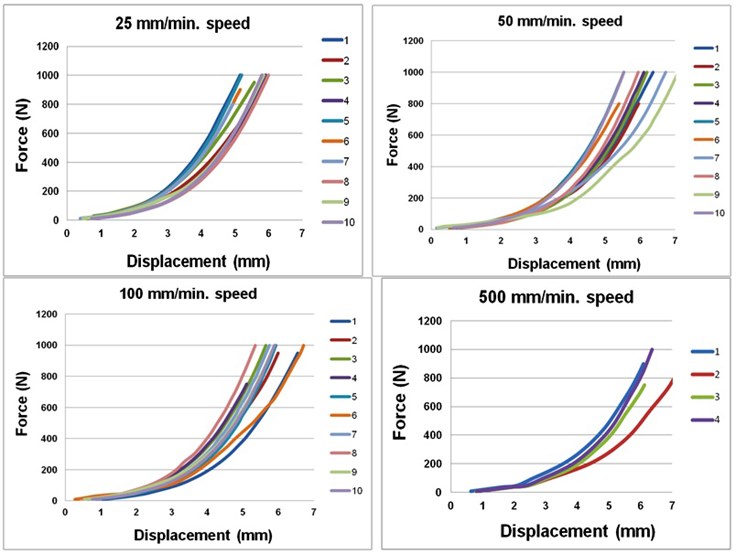
Table 1Foot compression displacement-force graphs Intraclass correlation coefficients
Compression speed (mm/min) | Intraclass correlation coefficient | Reliability level |
25 | 0.995 | 0.000 |
50 | 0.998 | 0.000 |
100 | 0.999 | 0.000 |
500 | 0.996 | 0.000 |
Table 2The average values of foot displacement, strain, stiffness and standard deviations at 400 N and 700 N loads when compressing the foot at different speeds
Speed loads | 25 mm/min | 50 mm/min | 100 mm/min | 500 mm/min | ||||
400 N | 700 N | 400 N | 700 N | 400 N | 700 N | 400 N | 700 N | |
Displacement (mm) | 4.10 ±0.30 | 4.95 ±0.32 | 4.62 ±0.34* | 5.52 ±0.46* | 4.45 ±0.31* | 5.33 ±0.39* | 5.06 ±0.43*& | 6.03 ±0.52*& |
Strain (%) | 6.67 ±0.54 | 8.06 ±0.58 | 7.43 ±0.54* | 8.88 ±0.75* | 7.25 ±0.53* | 8.68 ±0.72 | 8.29 ±0.57*#& | 9.88 ±0.65*#& |
Stiffness (N/mm) | 268.61 ±16.38 | 415.29 ±37.75 | 257.02 ±34.82 | 426.85 ±37.73 | 266.06 ±25.24 | 412.64 ±45.93 | 221.65 ±14.30*& | 336.85 ±46.99*#& |
* Foot displacement, strain and stiffness show statistically reliable difference at 25 mm/min compression speed compared with these indicators at other compression speeds # Foot indexes are significantly different at 50 mm/min compression speed compared with these indexes at other speeds & Foot displacement, strain and stiffness show statistically reliable difference at 100 mm/min compression speed compared with these indicators at other compression speeds | ||||||||
3. Results
Figure 2 shows displacement-force graphs when compressing the foot at different speeds.
Despite the compression speed differences the values of Intraclass correlation coefficient show data repeatability when compressing the foot repeatedly (Table 1).
Table 2 shows average values of talus displacement, foot strain and stiffness at 400 N and 700 N loads compressing the foot at different speeds. It is evident that vertical talus displacement and foot strain are significantly increasing at higher compression speeds.
In the meantime foot stiffness remained stable at 25-100 mm/min foot compression speeds. At compression speed higher than 100 mm/min (between 100-500 mm/min) foot stiffness decreased significantly.
The coefficients of stiffness regression equation of the foot with soft tissues are presented in Table 3.
The second degree regression equation was the most suitable to describe dependence between stiffness and relative deformation of the foot with soft tissues, where – relative deformation, , , – regression equation coefficients, given in Table 3.
Table 3Stiffness regression equation coefficients of foot with the soft tissue
(mm/min) | |||||
25 | 8.923 | -28.503 | 48.108 | 0.998 | 0.000 |
50 | 8.712 | -39.314 | 67.819 | 0.997 | 0.000 |
100 | 8.585 | 33.768 | 57.013 | 0.998 | 0.000 |
500 | 5.677 | -24.21 | 45.441 | 0.984 | 0.000 |
– compression speed; – reliability level | |||||
4. Discussion
In order to achieve the aim of the research, to determine mechanical properties of the foot, a foot frozen after amputation and defrozen before the test was used. With reference to research results of Moon et al. [18], who showed that refreezing of the specimens had little or no effect on the biomechanical properties measured, it was supposed that freezing of the foot had no influence on the obtained foot deformation and stiffness results. This can be confirmed by Bennett and Ker [19] research, which signified that testing feet at room temperature after frozen storage gives the same results as testing fresh and warm feet.
The human lower extremity in locomotive motions is usually modeled as a spring mass system, i. e. it is generally believed that the ratio between foot deformation and the force by which it was loaded can be described by Hooke’s law. Hooke’s law states that the force required to deform a material and the material deformation are linearly proportional, provided that its shape is not permanently changed. The proportionality constant is referred to as the spring constant and it describes the stiffness of an ideal spring. Although such leg model simplification is convenient for mathematical calculations, results provided by a simplified model can create preconditions for false conclusions. Latash and Zatsiorsky [20] suggest that an accurate model requires accounting for all of the components contributing to stiffness (tendons, ligaments, muscles, cartilage and bone). The model must also be able to characterize changes in muscle force as a function of contraction velocity. In addition, such features as viscosity, muscle reflex time delays and central nervous system control need to be under consideration. Finally, the model must be able to characterize more than one degree of freedom at the joints, multiple series and parallel elastic components, control by more than two muscles and bi-articular muscles. Unfortunately, a model accounting for all of the components that influence motion is very complicated and becomes impractical; however, we believe that current leg models ought to include one more element, i. e. the foot as a separate segment. Foot is the only leg segment parallel to the support surface and it namely is the part of the body which leans on it. Foot reaction to compression is extremely important part of leg stiffness analysis. This statement can be supported by Ferris [21] and Farley [4] leg stiffness research, which showed that surface stiffness is a reason of significant leg stiffness changes.
Researchers who have conducted foot compression analysis in vitro determined that in a case of foot compression at 0.04 m/s speed its reaction to compression is nonlinear [10]. Foot deformation after fasciotomy increased from 7.3 mm to 8.4 mm at 690 N load [8]. Niu [9] found that at 700 N force compression, the foot without fascia, spring ligament, long and short plantar ligaments deformed almost 6 mm more than the foot with remaining soft tissues. The above mentioned compression research of amputated feet specimen did not show any results on foot stiffness, which is highly important to model not only in the foot but also in the whole leg. Our research results show that foot stiffness changes significantly along with increasing load. It means that the ratio between foot deformation and the force which caused it cannot be described by Hooke’s law since the ratio is changing. Nonlinear foot reaction to compression was also described by Erdemir et al. [10].
There were no reliable variations between foot stiffness at 25 mm/min, 50 mm/min and 100 mm/min compression speeds. However, foot stiffness decreased significantly at the speed of 500 mm/min and 700 N load. Indirectly our research results confirm the statement that at increasing compression speed the growth of foot stiffness depends on muscle activity [22].
Our results indicate that with increasing compression speed displacement increases as well. Such results oppose to Niu et al. [9]: we have determined that at 400 N and 700 N loads and 25 mm/min, 50 mm/min, 100 mm/min and 500 mm/min compression speeds talus displacement was similar to the results of these authors that were obtained at 2 mm/min compression speed. The displacement in Niu et al. [9] research should have been lower. Such inconsistencies between our results and those of the scientists can be explained by their research object – seven cadaver foot-ankle specimens that showed different reaction to compression. This statement is supported by standard deviation values provided (4.66±1.42 mm under 400 N loading and 5.55±0.74 mm under 700 N loading). Data provided by Niu et al. [9] could have been influenced by different donor age, gender, maybe different foot arch (authors did not mention foot arch values in the publication).
5. Conclusions
Despite the compression speed differences the values of Intraclass correlation coefficient show data repeatability when compressing the foot repeatedly.
The foot stiffness remained stable at 25-100 mm/min foot compression speeds. At compression speed higher than 100 mm/min foot stiffness decreased significantly.
References
-
McMahon T. A., Cheng G. C. The mechanics of running: how goes stiffness couple with speed? Journal of Biomechanics, Vol. 23, Issue 1, 1990, p. 65-78.
-
Farley C. T., Gonzalez O. Leg stiffness and stride frequency in human running. Journal of Biomechanics, Vol. 29, Issue 2, 1996, p. 181-186.
-
Granata K. P., Padua D. A., Wilson S. E. Gender differences in active musculoskeletal stiffness. Part II. Quantification of leg stiffness during functional hopping tasks. Journal of Electromyography and Kinesiology, Vol. 12, Issue 2, 2001, p. 127-135.
-
Farley C. T., Houdijk H. P., Van Strien C., Louie M. Mechanism of leg stiffness adjustment for hopping on surfaces of different stiffnesses. Journal of Applied Physiology, Vol. 85, Issue 3, 1998, p. 1044-1055.
-
Bishop M., Fiolkowski P., Conrad B., Brunt D., Horodyski M. B. Athletic footwear, leg stiffness, and running kinematics. Journal of Athletic Training, Vol. 41, Issue 4, 2006, p. 387-392.
-
Brughelli M., Cronin J. Influence of running velocity on vertical, leg and joint stiffness modelling and recommendations for future research. Sports Medicine, Vol. 38, Issue 8, 2008, p. 647-657.
-
Van Der Krogt M. M., Bregman D. J., Wisse M., Doorenbosch C. A., Harlaar J., Collins S. H. How crouch gait can dynamically induce stiff-knee gait. Annals of Biomedical Engineering, Vol. 38, Issue 4, 2010, p. 1593-1606.
-
Huang C. K., Kitaoka H. B., An K. N., Chao E. Y. Biomechanical evaluation of longitudinal arch stability. Foot & Ankle, Vol. 14, 1993, p. 353-357.
-
Niu W., Yang Y., Fan Y., Ding Z., Yu G. Experimental modeling and biomechanical measurement of flatfoot deformity. IFMBE Proceedings, Vol. 19, 2008, p. 133-138.
-
Erdemir A., Sirimamilla P. A., Halloran J. P., Bogert A. J. An elaborate data set characterizing the mechanical response of the foot. Journal of Biomechanical Engineering, Vol. 131, Issue 9, 2009.
-
Gefen A. Stress analysis of the standing foot following surgical plantar fascia release. Journal of Biomechanics, Vol. 35, 2002, p. 629-637.
-
Gefen A. Plantar soft tissue loading under the medial metatarsals in the standing diabetic foot. Medical Engineering & Physics, Vol. 25, 2003, p. 491-499.
-
Williams D. S., Mc Clay I. S. Measurements used to characterize the foot and the medial longitudinal arch: reliability and validity. Physical Therapy, Vol. 80, Issue 9, 2000, p. 864-871.
-
Kogler G. F., Solomonidis S. E., Paul J. P. Biomechanics of longitudinal arch support mechanisms in foot orthoses and their effect on plantar aponeurosis strain. Clinical Biomechanics, Vol. 11, Issue 5, 1996, p. 243-252.
-
Lakin R. C., De Grone L. T., Pienkowski D. Contact mechanics of normal tarsometatarsal joints. American Journal of Bone and Joint Surgery, Vol. 83, 2001, p. 520-528.
-
Beumer A., Van Hemert W. L., Swierstra B. A., Jasper L. E., Belkoff S. M. A biomechanical evaluation of the tibiofibular and tibiotalar ligaments of the ankle. Foot Ankle International Journal, Vol. 24, Issue 5, 2003, p. 426-429.
-
Kim W., Voloshin A. S. Role of plantar fascia in the load bearing capacity of the human foot. Journal of Biomechanics, Vol. 28, Issue 9, 1995, p. 1025-1033.
-
Moon D. K., Woo S. L.-Y., Takakura Y., Gabriel M. T., Abramowitch S. D. The effects of refreezing on the viscoelastic and tensile properties of ligaments. Journal of Biomechanics, Vol. 39, 2006, p. 1153-1157.
-
Bennett M. B., Ker R. F. The mechanical properties of the human subcalcaneal fat pad in compression. Journal Anatomy, Vol. 171, 1990, p. 131-138.
-
Latash M. L., Zatsiorsky V. M. Joint stiffness: myth or reality? Human Movement Science, Vol. 12, 1993, p. 653-692.
-
Ferris D. P., Farley C. T. Interaction of leg stiffness and surface stiffness during human hopping. Journal of Applied Physiology, Vol. 82, Issue 1, 1997, p. 15-22.
-
Williams D. S., Davis I. M., Scholz J. P., Hamill J., Buchanan T. S. High-arched runners exhibit increased leg stiffness compared to low-arched runners. Gait and Posture, Vol. 19, 2004, p. 263-269.
About this article

