Abstract
This study provides an experimental procedure and a noise immunity method for detecting the vital signs of a person in a vehicle. Velocity sensors that are convenient and accurate at acquiring data are adopted to detect the involuntary body vibrations. Two kinds of algorithms were proposed for detecting the vital signs in different environments with various ground noise level. To reduce the ground noise effect generated from extreme environments, a ground sensor also is used to measure the vibration amplitude of ground surface for calculating the car body response to provide excellent noise cancelling method. Measuring and processing the vibrations are effective methods for detecting people concealed in a vehicle. The complete detecting system was verified through experiment conducted with a passenger car.
1. Introduction
This research developed a non-intrusive method for detecting the presence of people in a passenger vehicle. The proposed method has numerous useful applications such as determining the presence of people and preventing further injury to people trapped in a vehicle [1, 2], and enabling the identification of people hiding in a vehicle [3-5]. Systems of this type have gained importance in recent years because of their ability to reduce the time required for detection.
Several methods can be used to detect the vital signs of people in vehicles. Simple, cheap CO2 sensors detect exhaled CO2 [6], but they are not adequately accurate for determining whether people are present. Heartbeat sensors extract vibrations lower than 2 Hz from the human heartbeat [7], but heartbeat vibrations transmitted through a car body are decayed and difficult to identify. X-ray equipment can be used in such detection [8] but risks exposing the operator to radiation. Placing a piezoceramic sensor between the ground surface and tire surface of a parked vehicle is another proposed method [9]. However, a sensor thus used would be unable to distinguish between ground noise and human vibrations transmitted to the tire through the car body. Therefore, using velocity sensors to measure the vehicle body directly may be a more effective method of detection.
The human body continuously generates involuntary ballistocardiac vibrations in the range of 4 to 8 Hz [10]. People in a vehicle transmit low-frequency vibrations to the vehicle chassis. To detect these weak vibrations in the car body, the detection system must be both highly sensitive and able to distinguish between human vibrations and ground noise under various environments. This study devoted to construct a system that can gather and discriminate the valid vital signs accurately, and used an extra ground sensor with noise cancellation algorithm to assume the robustness of this system in extreme conditions.
2. System and data processing
2.1. System
The measuring system we used was based on four passive velocity sensors (car sensors) and one passive-velocity sensor (ground sensor). The velocity sensors were placed on the vehicle body vertically, enabling the vibrations to be transformed into voltage signals. To enhance the signal intensity, an amplifier was used to intensify signals up to ten times. An NI PCI-6221 DAQ was used to acquire the amplifying data and convert the data from analog to digital signals. The raw digital data were then saved in an industrial computer. Fig. 1 shows a flowchart diagram of the measuring system. Fig. 2(a) and 2(b) show one of the car sensor locations and a diagram of four car sensor locations, respectively.
Fig. 1Measuring system
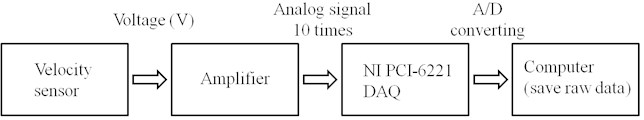
Fig. 2a) One of the sensor locations and b) four car sensor locations
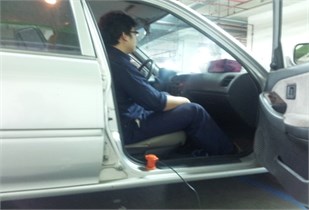
a)
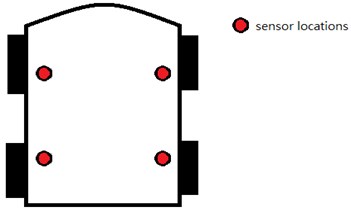
b)
2.2. Data processing
Two data processing algorithms were proposed under various environment conditions. If the ground noise level was lower, only one of the algorithms was needed to detect whether or not a person concealed in a passenger car. If the ground noise level was extremely high, the other algorithm was also activated to cancel the ground noise effect.
2.2.1. Environments with low levels of ground noise
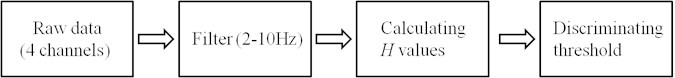
To extract a valid frequency band of biosignal vibrations, we performed signal processing. As shown in Fig. 3, to enhance ballistocardiac vibrations, raw data gathered using the measuring system were processed using a band-pass filter within a frequency range between 2 and 10 Hz. Filtered data from each channel (four in total) were then manipulated using the root-mean-square (RMS) method with 1-second intervals. Calculating the sum of the RMS values from each of the four channels produced 32 vital indices from each 32-seconds measuring procedure. The following equation defines the index as a level of vital sign:
where means the sampling time which was taken as 0.001 second. means the calculating interval which was taken as 1 second in this study, and , , , and are vibration signals from each of the four car sensors.
Fig. 3Flow diagram of data processing procedure
Ten tests without people present and ten tests with people present were conducted. The final, processed indices provided a significant threshold for determining whether people were present in the vehicle.
2.2.2. Environments with high levels of ground noise
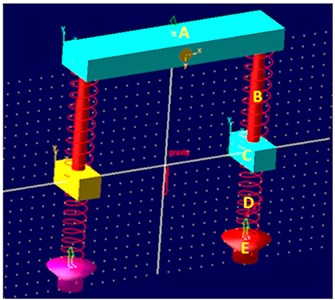
To measure ground noise, a ground sensor was placed near the car tire to gather vibrations from the ground surface, as shown in Fig. 4. The raw data from the ground sensor were input to an equivalent car model for simulating the car response. Fig. 5 shows the equivalent model, and Table 1 lists the corresponding parameters. The car simulation results were also processed calculating the 32 RMS values.
Fig. 4Ground sensor location
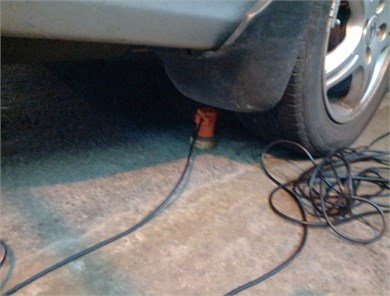
Fig. 5Equivalent car model (A: sprung mass, B: suspension, C: un-sprung mass, D: tire stiffness, E: ground surface)
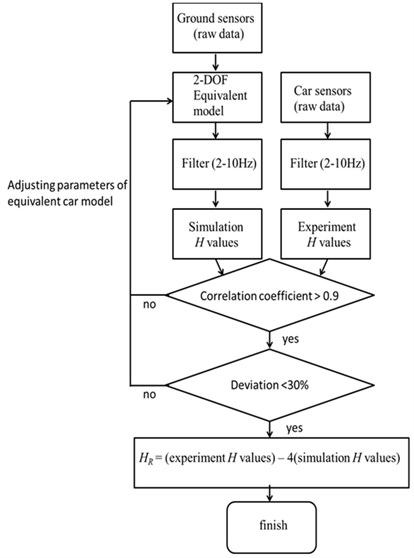
When the simulation values were close to the experiment values through adjusting the equivalent car model parameters, the two values were then subtracted, and the absolute values were adopted to obtain new values for reducing the effect of ground noise. Fig. 6 shows a flowchart of the ground noise cancellation process. The following equation defines :
The definitions of , , , , , and were as the same as those for environments with low levels of ground noise. The was the simulated car result calculated using the model.
In an environment with high levels of ground noise, ten tests without people present and ten tests with people present were conducted. values can be used as a threshold for determining whether person was present after ground noise cancellation.
Table 1The parameters of the equivalent car model
Parameter | Sprung mass (Kg) | Un-sprung mass (Kg) | Suspension stiffness (N/m) | Suspension damping (Ns/m) | Tire stiffness (N/m) |
Value | 300 | 60 | 22000 | 58000 | 235000 |
Fig. 6The flowchart of noise cancelling process
3. Results of the experiment
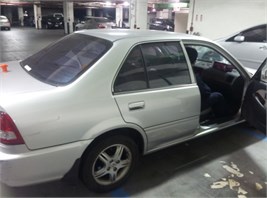
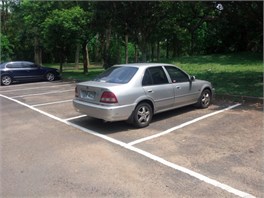
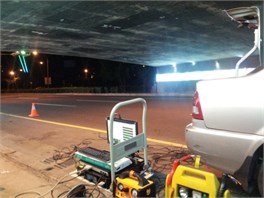
In order to validate the performance of the system, experiments and analysis were carried out in a passenger vehicle (Civic 2001, manufactured by HONDA) in three steps. First, the data were gathered from no-person presence state and a person presence state in three different environments included basement parking lot, outdoor environment with low levels of ground noise, and outdoor environment with high levels of ground noise respectively. Three environments were showed in Fig. 7(a) to 7(c). Second, to demonstrate the noise cancelling capability of the system, a ground sensor was placed near the car to pick up the vibrations transmitted to the car. Consequently, we could identify a threshold for determining whether a person was present in the vehicle.
Fig. 7a) Basement parking lot environment, b) outdoor environment (open parking lot) with low levels of ground noise, c) outdoor environment (under freeway overpass) with high levels of ground noise
a)
b)
c)
3.1. Measurement
3.1.1. Basement parking lot and outdoor environment with low level of ground noise
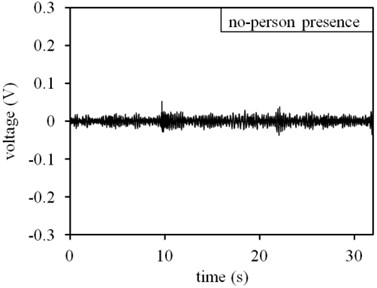
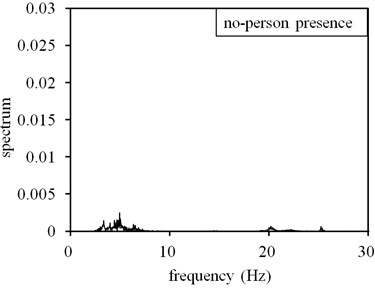
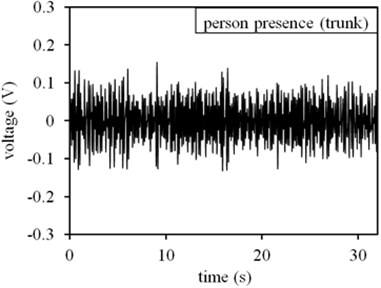
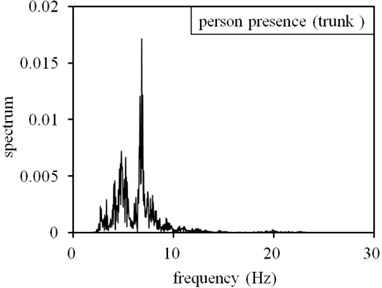
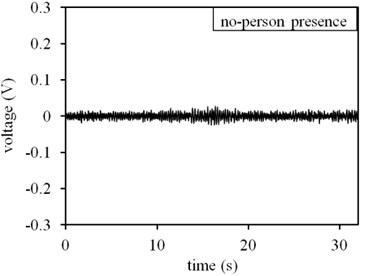
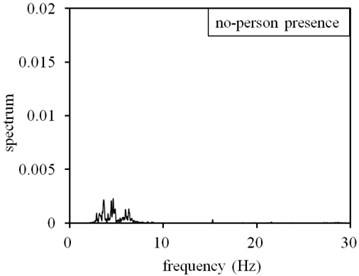
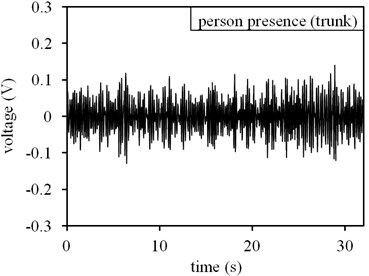
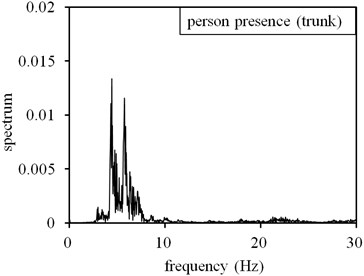
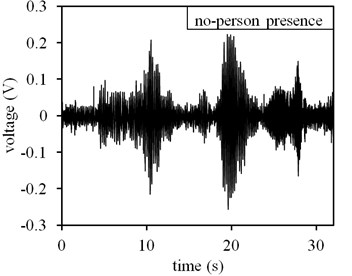
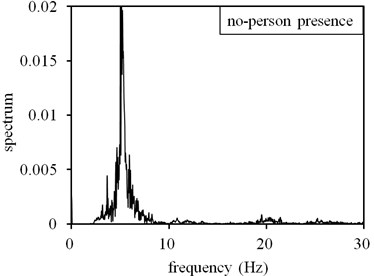
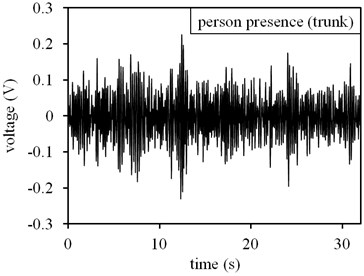
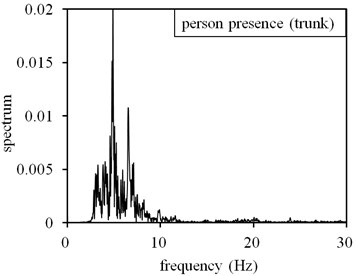
As shown in Fig. 8(a), the velocity sensors measured little voltage when people were not present in the vehicle. Fig. 8(b) shows no pronounced peaks in the fast Fourier transform (FFT) analysis from 4 to 8 Hz. By contrast, when people were present (as shown in Fig. 9), the time-domain signals were stronger (as illustrated in Fig. 8(c)). Fig. 8(d) shows that the magnitude of the corresponding FFT is high and the peak is sharp at 4-8 Hz. The peak values when people were present were approximately six times higher than when people were not present.
Fig. 8Measuring results in basement parking lot environment: a) time domain result at no-person presence state, b) frequency domain result at no-person presence state, c) time domain result at person presence state, d) frequency domain result at person presence state
a)
b)
c)
d)
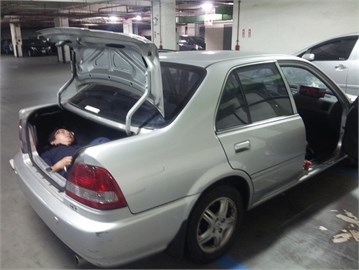
Fig. 9A person hiding in the trunk of the car
When the car was tested in an outdoor environment with low levels of ground noise, the results were similar to those of the previous test performed in the basement parking lot. The results are shown in Fig. 10(a) to 10(d). Fig. 10(d) shows a high magnitude with sharp peaks at 4-8 Hz when people were present.
Fig. 10Measuring results in outdoor environment with low ground noise level: a) time domain result at no-person presence state, b) frequency domain result at no-person presence state, c) time domain result at person presence state, d) frequency domain result at person presence state
a)
b)
c)
d)
3.1.2. Outdoor environment with significant ground noise
The car was parked under a freeway overpass (as shown in Fig. 7(c)) to test the proposed system in an environment with high levels of ground noise. Fig. 11(a) shows that the voltage measured by the velocity car sensors fluctuated widely without people present. Fig. 11(c) shows the time domain results with people present. Both results were disturbed by the significant amount of ground noise. As shown in Fig. 11(b), the FFT analysis without people present demonstrated that the peak was as strong as with people present (Fig. 11(d)). This demonstrates the necessity of noise cancellation in environments with high levels of ground noise.
3.2. Noise cancellation analysis
When ground noise was computed according to a 2-DOF equivalent model, the simulation of the car body response was similar to the experimental results shown in Fig. 12. The FFT results in Fig. 13 show that magnitude and peak are similar in the experimental and simulation results. Both maximum peak magnitudes were near 0.019, and both resonant frequencies were nearly 5 Hz.
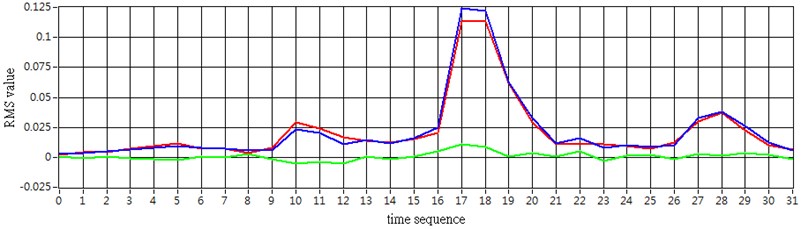
According to the proposed algorithm for calculating values, the experimental and simulation results were manipulated using the RMS method with 1-second intervals, as shown in Fig. 14. To show the relationship between experimental RMS values and simulation RMS values, the experimental and simulation results could be estimated using the correlation coefficient method and average deviation analysis. A typical set showed a correlation coefficient and average deviation of 0.992 and 22.6 %, respectively, as shown in Test 1 of Table 2. To demonstrate reproducibility, ten tests were conducted to calculate the correlation coefficient and average deviation at no-person presence state. All ten tests yielded similar results. Table 2 shows that all of the correlation coefficients are higher than 0.9, and the results demonstrated that the average deviations computed between the experiment and the simulation were consistently less than 30 %.
Fig. 11Measuring results in outdoor environment with significant noise: a) time domain result at no-person presence state, b) frequency domain result at no-person presence state, c) time domain result at person presence state, d) frequency domain result at person presence state
a)
b)
c)
d)
Fig. 12Simulation of car sensor response versus experiment of car sensor response in time domain (Blue line: experiment car sensor, red line: simulation car sensor, yellow line: ground sensor)
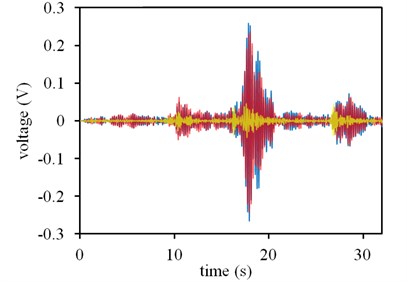
Table 2Ten tests in correlation coefficient and average deviation at no-person presence condition
Test 1 | Test 2 | Test 3 | Test 4 | Test 5 | Test 6 | Test 7 | Test 8 | Test 9 | Test 10 | |
Correlation coefficient | 0.992 | 0.978 | 0.971 | 0.907 | 0.901 | 0.996 | 0.994 | 0.986 | 0.937 | 0.936 |
Average deviation (%) | 22.6 | 19.74 | 19.94 | 22.12 | 28.2 | 20.89 | 20.4 | 20.89 | 20.93 |
Fig. 13Simulation of car sensor FFT versus experiment of car sensor FFT (Blue line: experiment car sensor, red line: simulation car sensor, yellow line: ground sensor)
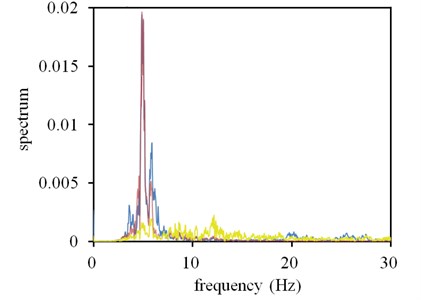
Fig. 14Simulation RMS values versus experiment RMS values (Blue line: experiment car RMS, red line: simulation car RMS, green line: exp RMS – sim RMS)
3.3. Robustness tests
According to proposed method which was used in the environments with low levels of ground noise, ten tests were conducted under no-person presence state and person presence state respectively in a basement parking lot, the calculated values were shown in Fig. 15. The results showed that the values were more stable at no-person presence state, and the values were consistently lower than 0.05. By contrast, when a person presented in the vehicle, the values were more unstable, fluctuating between 0.07 and 0.33.
To test the robustness of the system, experiments were conducted in an outdoor environment with low levels of ground noise under windy conditions. Fig. 16 shows that the majority of red lines (person-presence state) were higher than 0.1, and the majority of blue lines (no-person presence state) were lower than 0.1 when the maximum wind velocity reached 2.5 m/s. This demonstrates that most of the values can be used to determine whether people are present.
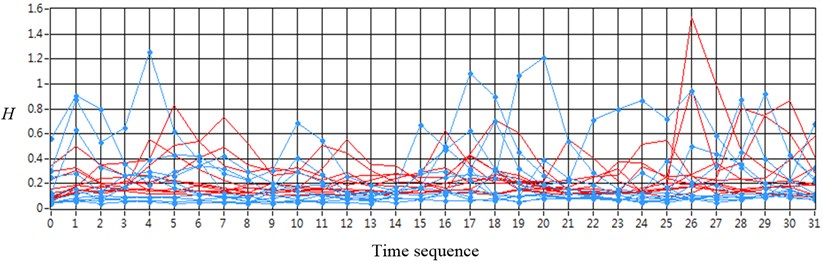
To test the proposed system at high levels of ground noise environments, the vehicle was parked under a freeway overpass. The tests were conducted according to the same procedure, and processed by Eq. (1) ( value) and Eq. (2) ( value). Fig. 17 shows the values of test results under high levels of ground noise environment and the results could not be discriminated at no-person presence state and person presence state. In contrast, to demonstrate the distribution of the processed values, the values were arranged from low to high. Fig. 18 shows most of the processed values were stable and could be used to determine whether people were present under high levels of ground noise environment. The results also showed that most of the values were less than 0.02 at no-person presence state. This demonstrates that the proposed system is sensitive to weak vibration signals and that the algorithm is highly effective in detecting and cancelling the effects of ground noise.
Fig. 15Tests in the basement parking lot environment (Blue lines: no-person presence state, red lines: person presence state)
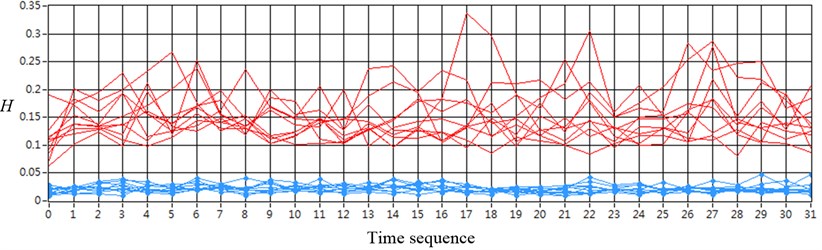
Fig. 16Tests in the outdoor environment with low levels of ground noise (Blue lines: no-person presence state, red lines: person presence state)
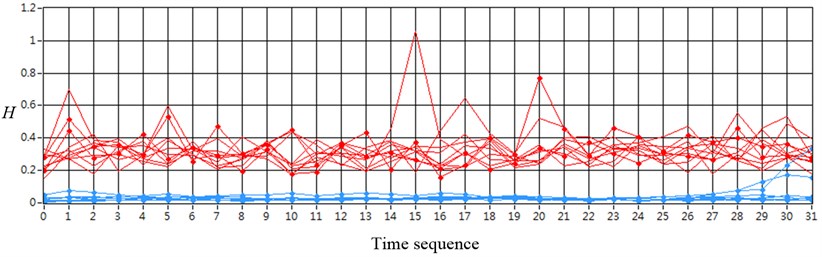
Fig. 17Tests under freeway over pass with high levels of ground noise (Blue lines: no-person presence state, red lines: person presence state)
4. Discussion
According to the results shown in Fig. 8, vibrations were clearly distinguishable in the time and frequency domains. This demonstrates that the proposed method, without noise cancellation, was sufficient for determining the threshold in the basement parking lot. When the threshold was between 0.05 and 0.1, the discriminative rate was nearly 100 %, as shown in Fig. 15.
Fig. 16 shows the robustness of the system in an outdoor environment with low levels of ground noise. When the threshold reached 0.05, the discriminative rate was over 90 %. We were able to increase the discriminative rate by using only certain portions of the indices for determining a practical detection method. For example, by removing the two highest values in each test from Fig. 16, the remaining 30 values were able to provide perfect results for determining whether people were present at outdoor environment with low levels of ground noise. The discriminative rate under these conditions also approaches 100 %.
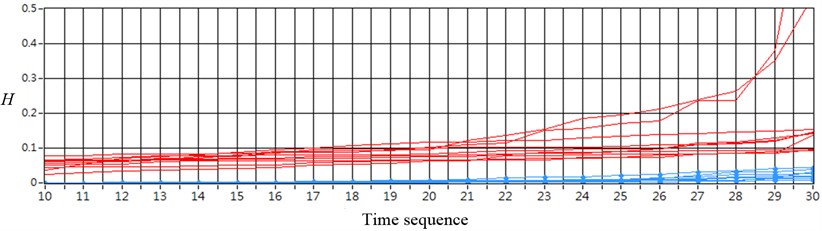
When the tests were conducted at outdoor environment with high levels of ground noise (as shown in Fig. 17), it was necessary to use noise cancellation methods. The processed values became stable and most of the values could be easily used to determinate the threshold (as shown in Fig. 18). As before, using only certain portions of the indices could increase the discriminative rate. As in the case of Fig. 18, when the middle sections of the indices (from the tenth to the thirtieth sequence) were used, the discriminative rate reached nearly 100 % when selecting 0.05 as the threshold. Fig. 19 shows these results.
Fig. 18The processed HR values (sorted) for high levels of ground noise condition (Blue lines: no-person presence state, red lines: person presence state)
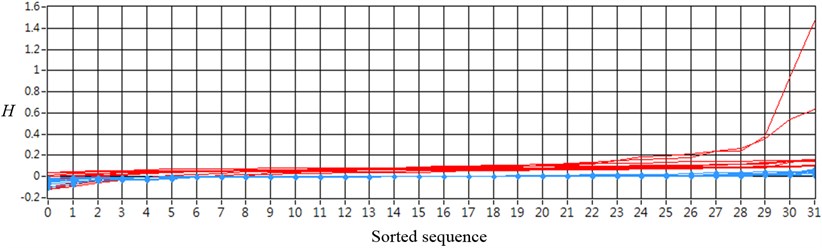
Fig. 19Part of processed HR value in Fig. 18 for practical discrimination (Blue lines: no-person presence state, red lines: person presence state)
5. Conclusions
This study proposes a novel method for detecting ballistocardiac vibrations by using velocity sensors for obtaining the specified frequency band of these vibrations. Two types of algorithm were used to obtain accurate discriminative rates. In environments with high levels of ground noise, the proposed model was successful in predicting the car sensor response results following ground noise cancellation. The analysis results confirmed that the system was effective in detecting the presence of people in passenger vehicles under various conditions. Additional tests are currently in progress to extend the application of the proposed system to other types of vehicles, such as trucks and container vehicles.
References
-
Fischer C., Tibken B., Fischer T. Left behind occupant recognition in parked cars based on acceleration and pressure information using k-nearest-neighbor classification. IEEE Intelligent Vehicles Symposium, San Diego, United States, 2010, p. 1242-1247.
-
Ranta R., Decoster Y., Orlewski P. Detection of human presence in a vehicle by vibration analysis. Intelligent Transport Systems, Vol. 6, Issue 4, 2011, p. 413-420.
-
Yousuke K., Watanabe K. Development of sensing device to detect persons hiding in a car. IEEE Sensor Journal, Vol. 11, Issue 9, 2011, p. 1872-1878.
-
Ascione M., Buonanno A., D’Urso M., Vinetti P., Angrisani L., Schiano Lo Moriello R. A method based on passive acoustic sensor for detection of vital signs in closed structure. IEEE Instrumentation and Measurement Technology Conference, Graz, Austria, 2012, p. 1764-1769.
-
Imamuru K., Watanabe K., Kobayashi K., Yousuke K. Detection of a person hiding in an automobile by using human-generated microvibrations. International Conference on Instrumentation, Control, Information Technology and System Integration, Taipei, Taiwan, 2010, p. 1701-1704.
-
Klock B. A. Selected systems for the detection of human stowaways in air cargo containers. 40th Annual IEEE International Carnahan Conferences Security Technology, Lexington, United States, 2006, p. 26-29.
-
Morita M., Matsushima M., Yamazaki T., Kurihara Y., Watanabe K., Ando H., Okada T. Unconstrained measurement of heartbeat of a vehicle driver by dual pneumatic sensing system. SCIE-ICASE International Joint Conference, Bexco, Korea, 2006, p. 3702-3705.
-
Doyle J., Sorrell L. French ban X-ray scans for illegal immigrants as radiation makes them ‘too dangerous’. Mail Online, 2010.
-
Mamiya D., Watanabe K., Kobayashi K., Yosuke K. Development of sensing device to detect human hiding in a car. International Conference on Instrumentation, Control, Information Technology and System Integration, Tokyo, Japan, 2011, p. 2326-2330.
-
Starr I., Rawson A. J., Schroeder H. A., Joseph N. R. Studies on the estimation of cardiac output in man, and of abnormalities in cardiac function, from the heatbeat’s recoil and blood’s impact; the ballistocardiogram. Journal of Physics, Vol. 127, p. 1-28.
About this article

