Abstract
The fracture of pump valve springs is another typical fault of emulsion pump with high pressure and large discharge, which greatly influences the volumetric efficiency of emulsion pump. The fault diagnosis on pump valve springs of emulsion pump was analyzed based on the singularity analysis of continuous wavelet transform. The improved method for Lipschitz index was presented with better robustness and efficiency based on the Least Square Method. The criterion for the fracture of pump valve was confirmed. Diagnostic results indicate that it is accurate and effective of the improved method to locate the singularity of signals, identify the moment when the valve disc impacts on base or lift limiter and judge the fault diagnosis of pump valve.
1. Introduction
Wavelet analysis was widely applied in machine fault diagnosis. Over the last 20 years, particularly in last 10 years, great progress has been made in the theory and applications of wavelets and many publications have been seen in the field of fault diagnosis.
Wavelet transform was firstly used in detection and processing of singularity signals. The theoretical basis was established for singularity analysis of detected signals [1]. A Support vector machines was presented based multi-class classifier and the results in experiments show that fault types and positions of faulty valves could be identified and diagnosed by this method [2]. A new combined method based on wavelet transformation, fuzzy logic and neuro-networks is proposed for fault diagnosis of a triplex. Tests indicate that the information of wavelet transformation in scale 2 is related to the meshing state of the gear and the information in scales 4 and 5 is related to the running state of fluid-end [3].The polar wavelet amplitude maps was used to improve detection capability of faulted gears, which were operated under non-stationary rotating speed [4]. Wavelet transform was proposed to pre-process the data collected from a single sensor and then the coefficients of the wavelet transforms at different scales were used as input to ICA and PCA. Then this method was applied to both a simulated signal series and a vibration signal series collected from a gearbox [5]. The wavelet coefficients were mapped into a polar diagram to enhance periodic transients caused by gearbox and bearing faults [6]. A new approach was put forward to gear fault diagnosis based on complex Morlet continuous wavelet transform. Gear motion residual signal was analyzed as source data because of its lower sensitiveness to the alternating load condition. A fault growth parameter based on the amplitude of wavelet transform was proposed to evaluate gear fault advancement quantitatively [7]. The Hermitian wavelet was selected as the basis function to perform CWT for detecting singularity characteristic of a signal considering the advantage of abundance of wavelet functions. The simulative and experimental results show that Hermitian wavelet can extract the transients from strong noise signals and can effectively diagnose the localized gear fault [8]. A dynamic windowed wavelet multi-resolution analysis was designed approach to detect and localize gear tooth defects in a noisy environment. The technique is applied on laboratory data corrupted with high noise level, which has shown accurate results in detecting and localizing gear tooth fracture with different damage severity [9]. The Symlet wavelet was used as the wavelet function to perform DWT on the bearing vibration signal for measuring its out race defect width. The ambiguity gets reduced by using Symlet 5 wavelet due to its linear phase nature which maintains sharpness in the signal even when there is a sudden change in signal [10].
The above researches provide the references for this study. It should be taken into consideration that there still exist some challenges in using wavelets for machine fault diagnosis. In this paper, an improved singularity analysis method was conducted to be utilized in fault diagnosis of pump valve spring. And it was expected that a judgment criterion of spring fracture could be obtained through this method.
2. Model establish
2.1. Singularity analysis with wavelets
Given a high attenuation low-pass function and a wavelet , the signal after wavelet transform can be expressed as Eq. (2), when and satisfy Eq. (1):
where, is the scale factor, is the time factor, is the vanishing moment number of the wavelet , contains no more than ranks vanishing moments only if .
From above, the wavelet can be regarded as the th derivative, which is equivalent to a multiple-scale derivative operator.
Supposed that and the Lipschitz index of is at , there exists a constant enabling all the time and scale (0) in the neighborhood of to satisfy Eq. (3):
Vice versa, if there are an index and a constant enabling all the time and scale (0) in the neighborhood of to satisfy Eq. (3), then the index can be regarded as the Lipschitz index of at .
The singularity of signal will not impact the whole scale-time plane but the small-range around called impacting cone. Supposed that the applied wavelet is compactly supported and the supported range is . Then the supported range of is . Thus, for wavelet , the impacting cone is:
Obviously, the wavelet transform of signal mainly depends on the values around in the impacting cone, which also represents the singularity of signal at . By combining Eq. (3) and Eq. (4), the signal after wavelet transform can be expressed as Eq. (5):
where, is a constant, is called as the module of signal after wavelet transform. If it was satisfied that:
should be the local maximum point of Then, if all the times in the neighborhood of satisfy should be the module maximum point of and is the module maximum. All the modules maximum on the scale-time plane constitute the curve of module maximum. Then the slope of straight line by fitting all the modules maximum is the Lipschitz index with as ordinate and as abscissas.
Supposed that for dyadic wavelet transform, Eq. (7) was obtained when logarithm is taken to both sides of Eq. (5):
Eq. (7) represents the relationship among scale Lipschitz index and the modules maximum of discrete dyadic wavelet transform (DDWT). On this condition, dyadic discrete is only processed in scale and the signal time interval is equal to sampling interval on every scale. Thus the calculation of this wavelet analysis is greatly reduced. But the dyadic segmentation in scale will lead to rough quantitative singularity. Specially it is difficult to detect the singularity of signal in low scale zone, which results in miss and inaccuracy. It can be seen that an improved algorithm should be represented to solve that problem and calculate Lipschitz index .
2.2. Improvement
In order to improve the accuracy of detecting the singularity of signal, continuous wavelet transform (CWT) was used in calculating Lipschitz index . Though the parameter should also be discrete in CWT, the discrete degree can be controlled according to actual demand [12-14]. Similarly, Eq. (8) was obtained when logarithm is taken to both sides of Eq. (5):
Given that Eq. (8) can be simplified as follow:
Due to the wide application in analysis of classical linear regression model, the Least Square Method (LSM) has been generally adopted to solve this problem that proper and are sought to enable minimum of residual sum of squares between estimations and observations:
But there are obvious deviations in results obtained from Least Square Method when the residual of model does not follow normal distribution or there are singularities resulting from varies reasons, which means the poor stability of Least Square Method. If the objective function of Eq. (10) is changed from residual sum of squares to residual median of squares, shown in Eq. (11), proper and are sought to enable minimum of residual median of squares between estimations and observations:
Eq. (11) shows the method of Least Median of Squares (LMS). It seems better stability of this method that there is hardly impact of singularities on the result. However, the asymptotic efficiency of this method is 0. Given that there is no singularity and measurement error in a set of data following normal distribution, the asymptotic efficiency means the ratio of mean square obtained from robust estimation to the one estimated by the Least Square Method. The closer the ratio is to 1, the more efficient the robust estimation method is. Thus the method LMS requires further improvement [15-18] given by Eq. (12):
where, is the weight function constructed by the results of method LMS, which is according to the standard robust residual calculated by Eq. (13):
where, is the robust scale estimation calculated by Eq. (14):
This improved Least Square Method estimation with weight used, the singularities in data are firstly removed and then the data without singularities is estimated by Least Square Method. This method enhances the stability and efficiency of estimation.
3. Experiment
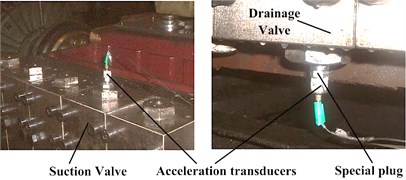
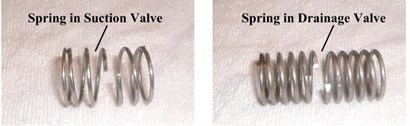
The experiment system consisted of emulsion pump with high pressure and large discharge (BRWZ400/31.5) and data acquisition system. Data acquisition system included Hall switch (HBB10-2K), acceleration transducers (KD1010), PC with software ADCRAS and prefix multifunctional double integration charge amplifier (KD5008). Thereinto, the Hall switch was applied to identify the starting position of plunger in the process of suction and drainage.
Fig. 1Sensors layout and fractured springs
a)
b)
In order to avoid the signal losing, being disturbed and distorted, a special plug was produced to fix the acceleration transducers on the end of the pump, shown in Fig. 1(a), (b). In this way, the detected signal can ultimately reflect the working condition of pump valve.
For the spring in pump valve, the fracture is mainly in the middle part. Thus the springs in suction valve and drainage valve were cut across the middle to simulate the fault, shown in Fig. 1(c), (d).
With pump valve under normal condition, the vibration signals of suction valve and drainage valve are shown in Fig. 2(a) and Fig. 2(b) respectively. With pump valve under spring fracture condition, the vibration signals of suction valve and drainage valve are shown in Fig. 2(c) and Fig. 2(d) respectively.
Fig. 2Vibration signals
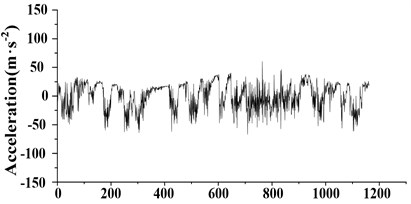
a) Vibration signal of suction valve under normal condition
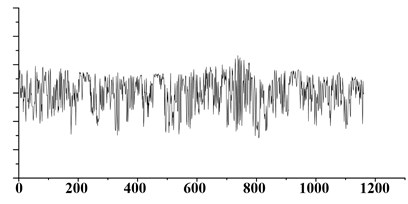
b) Vibration signal of discharge valve under normal condition
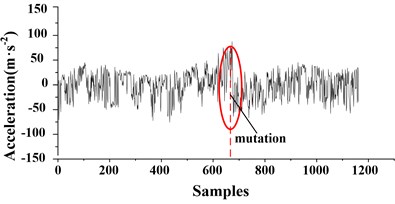
c) Vibration signal of suction valve under spring fractured condition
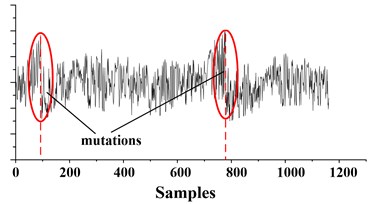
d) Vibration signal of discharge valve under spring fractured condition
4. Singularity analysis
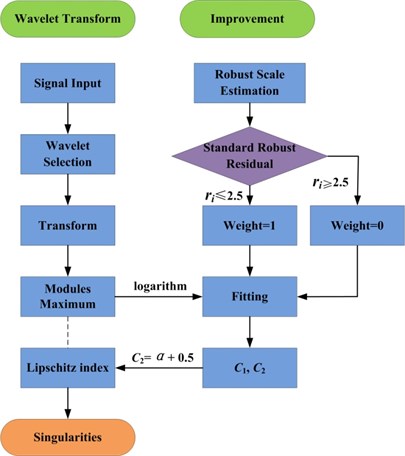
The analysis process of pump valve vibration signal based on singularity analysis is shown in Fig. 3.
Fig. 3Analysis process of pump valve vibration signal based on singularity analysis
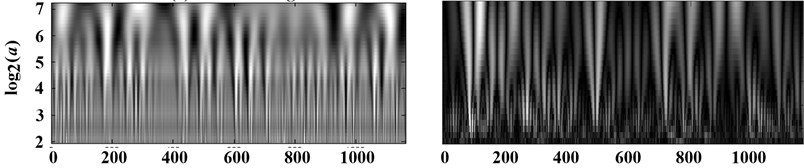
Firstly the vibration signals were analyzed using improved method and MATLAB Wavelet Toolbox. The coefficients on Scale-Time plane of different signals were shown in Fig. 4(a)-(d) respectively. The value of coefficients in Fig. 4 are shown as the gray level. To the results from improved method, the lighter the color is, the greater the coefficients are. However, it is contrary to the results from MATLAB Wavelet Toolbox. According to Fig. 2, the mutation in the vibration signal of suction valve under spring fractured condition is nearby sample 670. And there are two mutations in the vibration signal of discharge valve under spring fractured condition, which are nearby sample 100 and 800 respectively. From Fig. 4, the number and the position of mutations from improved singularity analysis agree well with that in Fig. 2. However, the results from Wavelet Toolbox are not corresponding, not only the number but also theposition. It indicates that the results from improved method are more accurate.
Fig. 4Coefficients on scale-time plane
a) Vibration signal of suction valve under normal condition
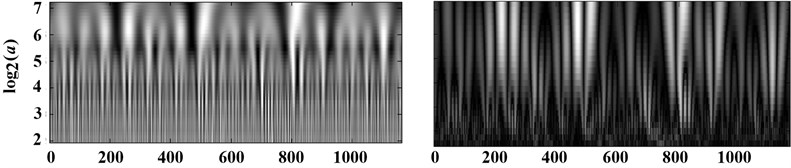
b) Vibration signal of discharge valve under normal condition
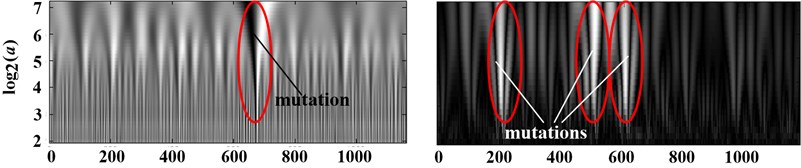
c) Vibration signal of suction valve under spring fractured condition
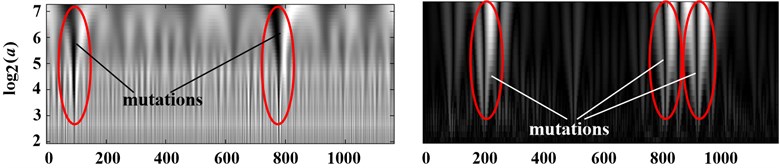
d) Vibration signal of discharge valve under spring fractured condition
Fig. 4(a) and (b) show that the coefficients obtained from continuous wavelet transform under the normal condition are in a regular black-and-white shape, and each black or white line only exists in some scales instead of the whole scale space. This is the unsteadiness of the pumps. These measured vibration signals are complicate and obvious unsteady resulting from that the vibration signals of pumps are not only affected by the motion of valve disk and the pulsation of emulsion in high pressure chamber, but also affected by the vibration coupling among the rotational motion of crank-link mechanism, the reciprocating motion of plunger and the other motions.
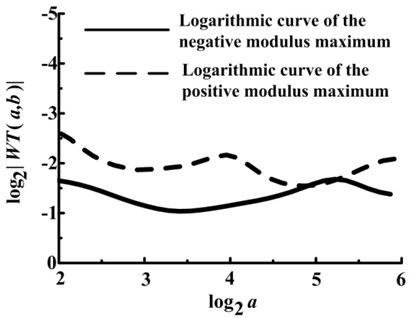
From Fig. 4(c), it can be seen that there exists gray mutation on the Scale-Time plane, which is across the scales. The most dark means the negative maximum value, and the most bright means the positive maximum value. The modulus maximum curve was constructed by the coefficients at the gray mutation across scales which convergent to the mutation time with the decline of scale. Thus, if one modulus maximum position in one scale was discovered, the modulus maxima value will be searched with the decline of scale in the impacting cone. The relative time in nearly 0 scale that researched one modulus maximum is the point where existed singularity or peak point. Furthermore, whether the point relative to the modulus maximum curve is the singularity or the nonsingular peak point depended on the decay of the modulus maximum curve. From above, the slope of logarithmic curve of the modulus maximum should be solved, which corresponded to the Lipschitz index . The logarithmic curves of the modulus maximum under suction valve spring fractured condition are shown in Fig. 5.
The improved Least Square Method estimation with weight used, the slope of the logarithmic curve in Fig. 5 after fitting is 0.43. Thus, the Lipschitz index of the negative modulus maximum curve is –0.07 according to Fig. 1. Similarly for the positive modulus maximum curve, the slope and the Lipschitz index are 0.4 and –0.1 respectively. Both the Lipschitz indexes are no more than 0, thus this point is one singularity of the signal.
Fig. 5Logarithmic curves of the modulus maximum under suction valve spring fractured condition
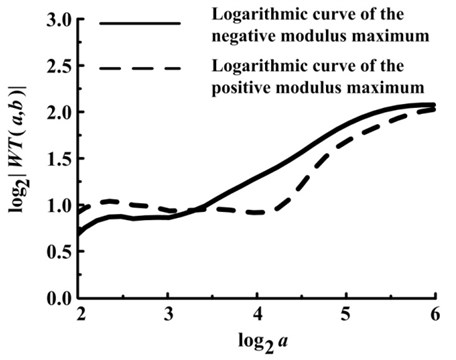
Fig. 6Logarithmic curves of the modulus maximum under drainage valve spring fractured condition
a) Left logarithmic curve
b) Right logarithmic curve
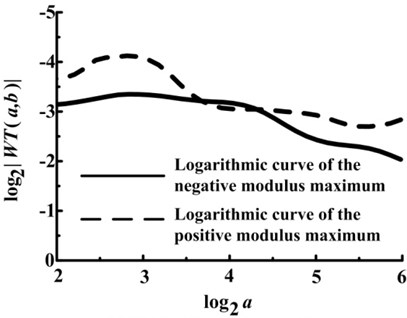
Similarly, there exists two gray mutations on the Scale-Time plane from Fig. 4(d). The logarithmic curves of the modulus maximum under drainage valve spring fractured condition are shown in Fig. 6.
From Fig. 6(a), the the slope and the Lipschitz index of the negative modulus maximum curve are 0.11 and –0.39 respectively. And the ones of the positive modulus maximum curve are 0.28 and –0.22. It indicates that this point is one singularity of the signal.
From Fig. 6(b), the Lipschitz indexes of the negative and positive modulus maximum curve are –0.26 and –0.16 respectively, which indicates that this point is also one singularity of the signal.
There exist one and two mutations at the same time in vibration signals in Fig. 4(c) and Fig. 4(d) respectively. The singularity in Fig. 4(c) and the left singularity in Fig. 4(d) are corresponding to the close time of the valve disc, which means that the valve disc impacting on the base results in the mutation of the vibration signal when the valve spring fractured. And the right singularity in Fig. 4(d) is corresponding to the open time of the discharge valve disc, which means that the discharge valve disc impacting on the lift limiter leads to the mutation of the vibration signal.
5. Conclusions
The improved Least Square Method estimation with weight used, the singularities in data are firstly removed and then the data without singularities is estimated by Least Square Method. This method enhances the stability and efficiency of estimation. Diagnostic results indicate that it is accurate and effective of the improved method to locate the singularity of signals, identify the moment when the valve disc impacts on base or lift limiter and judge the fault diagnosis of pump valve.
References
-
Mallat S., Huang W. L. Singularity detection and processing with wavelets. IEEE Transactions on Information Theory, Vol. 38, Issue 2, 1992, p. 617-643.
-
Gao J. F., Shi W. G. Support vector machines based approach for fault diagnosis of valves in reciprocating pumps. Proceedings of the 2002 IEEE Canadian Conference on Electrical and Computer Engineering, 2002, p. 1622-1627.
-
Kong F. S., Chen R. H. A combined method for triplex pump fault diagnosis based on wavelet transform, fuzzy logic and neuro-networks. Mechanical Systems and Signal Processing, Vol. 18, Issue 1, 2004, p. 161-168.
-
Meltzer G., Dien N. P. Fault diagnosis in gears operating under nonstationary rotational speed using polar wavelet amplitude maps. Mechanical Systems and Signal Processing, Vol. 18, 2004, p. 985-992.
-
Zuo M. J., Lin J., Fan X. Feature separation using ICA for a one-dimensional time series and its application in fault detection. Journal of Sound and Vibration, Vol. 287, 2005, p. 614-624.
-
Zhu Z. K., He Z., Wang A., Wang S. Synchronous enhancement of periodic transients on polar diagram for machine fault diagnosis. International Journal of Wavelets Multiresolution and Information Processing, Vol. 7, Issue 4, 2009, p. 427-442.
-
Wang X., Makis V., Yang M. A wavelet approach to fault diagnosis of a gearbox under varying load conditions. Journal of Sound and Vibration, Vol. 309, 2010, p. 1570-1585.
-
Li H., Zhang Y., Zheng H. Application of Hermitian wavelet to crack fault detection in gearbox. Mechanical Systems and Signal Processing, Vol. 25, 2011, p. 1353-1363.
-
Omar F. K., Gaouda A. M. Dynamic wavelet-based tool for gearbox diagnosis. Mechanical Systems and Signal Processing, Vol. 26, 2012, p. 190-204.
-
Kumar R., Singh M. Outer race defect width measurement in taper roller bearing using discrete wavelet transform of vibration signal. Measurement, Vol. 46, Issue 1, 2013, p. 537-545.
-
Jing L., Qu L. S. Singularity detection using continuous wavelet transform and its application to fault diagnosis. Journal of Vibration Engineering, Vol. 13, Issue 4, 2000, p. 523-530.
-
Zhang Z. Y., Gu J. L., Wang W. B. Application of continuous wavelet analysis to singularity detection and Lipeschitz exponents calculation of a rub-impact signal. Journal of Vibration, Measurement & Diagnosis, Vol. 21, Issue 2, 2001, p. 112-150.
-
Sun Q., Tang Y. Singularity analysis using continuous wavelet transform for bearing fault diagnosis. Mechanical Systems and Signal Processing, Vol. 16, Issue 6, 2002, p. 1025-1041.
-
Figarella T., Jansen M. H. Brush wear detection by continuous wavelet transform. Mechanical Systems and Signal Processing, Vol. 21, 2007, p. 1212-1222.
-
Barreto H., Maharry D. Least median of squares and regression through the origin. Computational Statistics and Data Analysis, Vol. 50, 2006, p. 1391-1397.
-
Leontitsis A., Pange J. Statistical significance of the LMS regression. Mathematics and Computers in Simulation, Vol. 64, 2004, p. 543-547.
-
Bocek P. Linear programming approach to LMS-estimation. Computational Statistics and Data Analysis, Vol. 19, 1995, p. 129-134.
-
Olson C. F. An approximation algorithm for least median of squares regression. Information Processing Letters, Vol. 63, 1997, p. 237-241.
-
Tu C. L., Huang W. L., Ho J. Analysis of singularities from modulus maxima of complex wavelets. IEEE Transactions on Information Theory, Vol. 51, Issue 3, 2005, p. 1049-1062.
-
Chen Y. G., Tian Z. P., Miao Z. Q. Detection of singularities in the pressure fluctuations of circulating fluidized beds based on wavelet modulus maximum method. Chemical Engineering Science, Vol. 59, 2004, p. 3569-3575.
-
Peng Z. K., Chu F. L., Tse P. W. Singularity analysis of the vibration signals by means of wavelet modulus maximal method. Mechanical Systems and Signal Processing, Vol. 21, 2007, p. 780-794.
About this article

This project is supported by the National Natural Science Foundation of China (No. 51375478), the National High Technology Research and Development Program of China (863 Program) (No. 2012AA062104), the Jiangsu Provincial Natural Science Foundation of China (No. BK20131116), the Fundamental Research Funds for the Central Universities (Project No. 2012QNA22) and the Priority Academic Program Development of Jiangsu Higher Education Institutions.
