Abstract
This research describes random process modeling of the accelerated aging process based upon the mechanical degradation in induction motors. In order to show this aging effect, vibration measurements are considered at the end of each aging cycle, which gradually cause to bearing damage in the motor. In this manner, the accelerated aging study comprises seven aging stage sequentially and collected data set is presented as seven aging cycles and one initial cycle. Hence total aging process is represented by a set of the sequential vibration signals for initial and aged cases. Since the vibration signals are random values which represent the Gaussian distribution character in each period of measurement and this character can be conveyed to the next stage with a scaling of the signal related to elapsed time, the process reminds the Brownian motion or the so-called random walk and it is expected that the degradation can be described as a Wiener process. Examining the collected data proves that in the statistical manner, this compact data set reflects the properties of a non-stationary random process and it is expressed by the Wiener Process Model (WPM) as a statistical approach. This property of the process will be helpful to estimate the residual useful life (RUL) of the bearings in induction motors with high accuracy.
1. Introduction
A number of studies have been carried out to find out the reasons of the failures in induction motors. In this manner, the statistical assessment points to the fact that almost half of the failures are caused by rotor based disorders [1, 2]. Among these failures bearing related faults are of high importance [3-5].
In order to predict the residual useful life of the machinery the condition-monitoring is very important. Several researches in this area have been made both in frequency domain and time domain. The frequency domain analysis is mainly based upon the Fourier transform [6]. The wavelet transform is widely applied to non-stationary signals [7]. Together with the pattern recognition techniques the wavelet transform is used to classify the faults in electric motors [8-10]. It is also employed to disclose the dominant frequencies that characterize the aging of the bearing in electric motors [11]. Multi Resolution Wavelet Analysis (MRWA) technique is applied to investigate the vibration signals and it is claimed that the change of the spectrum in the frequency band between 2 kHz and 4 kHz can be used as a measure of the degradation of bearings in induction motors. The Power Spectral Density (PSD) approach is also effectively used for feature extraction in frequency domain [12-14]. Another frequency domain investigation is made by relating the aging to the change of the Hurst parameter [15]. It is shown that the degradation of the bearings results in the change of the Hurst parameter from a positive value for the initial conditions to a negative value for advancing cycles of the aging process. Hence it is explained that this phenomenon can be used as a means to estimate the degree of the degradation.
The time domain analysis has also much importance in terms of the statistical analysis or modeling to define the aging process. In this sense the four statistical parameters as mean value, standard deviation, skewness and kurtosis are used to describe the process [16]. In this study a statistical modeling approach is purposed to represent the mathematical aspect of the aging process and it is modeled by the Wiener process approach as a non-stationary random process.
2. Accelerated aging processes and vibration measurements
Accelerated aging process is a method usually used to estimate the useful life of a product in case it is difficult or impossible to get the real data for the whole life. The process shortens the time to observe the long term performance of the product [17, 18].
Once the aging behavior of the product is defined, its RUL can be estimated by carrying out appropriate measurements at certain instants. In order to increase the accuracy of the estimation of RUL the accelerated aging process should characterize the actual aging as close as possible. Hence, first the dominating effect on the aging is to be specified.
In electric motors the bearings that surround the rotor are greased so that they do not conduct electric current. There are mainly two conditions when current can flow from the rotor to the outer race of the bearing.
If the motor operates at high speeds, the oil inside the bearing is distributed homogeneously. This fact results in high insulation and prevents electric contact between the rotor and the outer race of the bearing. But on the other side it may cause the rotor voltage due to friction to increase with respect to ground since it cannot be discharged easily. If this voltage overcomes the breakdown voltage of the insulation, a spark eventuates. This kind of discharge is described as a momentarily but high-valued current.
If the shaft is rotating at low speeds, oil is not distributed homogeneously inside the bearing. Hence there exist regions where the grease film is very thin reducing the insulation at that point. This results in flowing small-valued but continuous current from the rotor to the bearing.
The current that flows continuously does not harm the bearing too much so that its useful life will not be remarkably shortened. In this manner, low speeds are not much responsible for aging. But the sparks cause mechanical corrosion on the bearing and this corruption consequently leads to the completion of the bearing life. Thus, the accelerated aging process is to be performed under these considerations.
In this study each cycle of the accelerated aging process that is simulating the bearing degradation due to electrical arch has had the following steps:
As for the electrical phase of the aging process which is known as the fluting test, the motor has been running at no load and the shaft is driven with an AC current of 27 A for 30 minutes (Fig. 1(a)). This period is followed by thermal and chemical aging processes in order to speed up the aging acceleration. Following each aging cycle the motor is loaded and vibration signals are measured at 12 kHz sampling frequency for 10 seconds (Fig. 1(b)). Piezoelectric accelerometers that are used as vibration sensors are positioned as in Fig. 1(b).
Fig. 1a) Bearing fluting test of the accelerated aging process (Motor at no load), b) Experimental setup for acquiring data (Motor loaded) and positions of the sensors on the motor
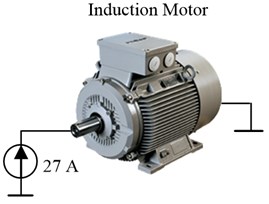
a)
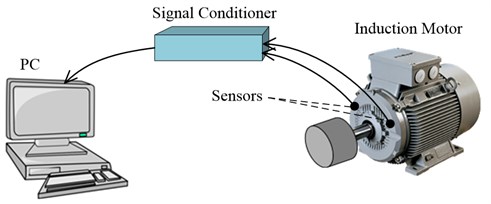
b)
3. The Wiener process
The Wiener process is a fundamental process for a series of stochastic processes. It finds applications in a large number of mathematical sciences [19]. The process has formally been introduced by Norbert Wiener. It has primarily been used to describe Brownian motion of suspended particles in a liquid or a gas [20].
The Wiener process is defined as a Gaussian process with the parameter 0 on with stationary and independent increments; its mean is given as 0, and auto covariance function as:
In other words, a standard Wiener process has the following properties:
- is continuous in time;
- 0;
- is Gaussian with for , : variance;
- and are independent for .
Hence, its one-dimensional density is given by:
and it can be shown that for any , , the -dimensional density [21, 22] is:
The Wiener process is also connected to another widely known process, namely, the random walk process with the time increment approaching zero. It is also used modeling the noise in electronics engineering. It is easy to generate sample paths of the Wiener process.
A simple algorithm is:
1. Let be the time instants.
2. Let be Gaussian random variables with zero-mean and unit variance.
3. Generated output can be represented by:
Since the vibration of the motor shaft due to degradation of the bearings reminds very closely the random walk, it is strongly expected that the vibration can also be described as a Wiener process.
4. Analysis of the acquired data
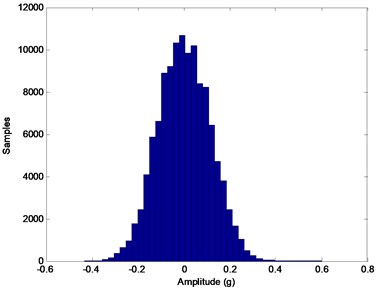
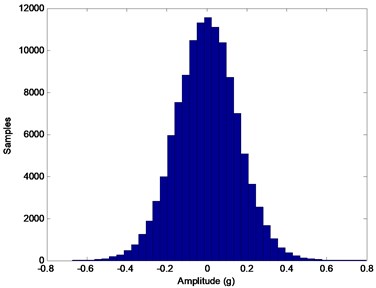
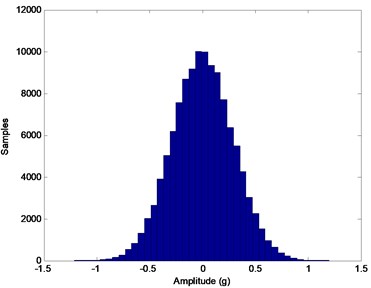
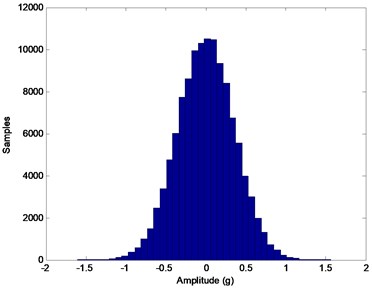
In order to prove the consideration that the whole process has the character of Wiener process, mainly two points are to be investigated. Firstly, the process should be Gaussian at any stage of its progress; secondly, the standard deviation of the Gaussian distribution should increase proportional to the square root of time. One of simple and common ways to observe these properties is examining the histograms. Thus, to analyze the process, first the histograms of all cycles of the process are obtained. Histograms for some aging cycles (0, 1, 3 and 5) are given in Fig. 2. Here, 0 denotes the zero-degradation situation (initial state) which is called the healthy case. As expected, all histograms point to Gaussian distributions with increasing standard deviations.
Fig. 2Histograms of several cycles of the aging process: a) Initial state (k= 0), b) k= 1, c) k= 3, d) k= 5
a)
b)
c)
d)
Next, statistical parameters are calculated for each step k of the aging process (Table 1). As seen, all Gaussian distributions are in form of for 0 to 7 where stands for the expected (mean) value and denotes the standard deviation. is plotted in Fig. 3.
Table 1Expected values (μk) and standard deviations (σk) for each stage k of the aging process
0 | 0.0016 | 0.1132 |
1 | 0.0014 | 0.1543 |
2 | 0.0012 | 0.2084 |
3 | 0.0013 | 0.2870 |
4 | 0.0009 | 0.3313 |
5 | 0.0010 | 0.3439 |
6 | 0.0005 | 0.4212 |
7 | 0.0030 | 0.6010 |
The last (7th) aging cycle already caused full-damage on the bearing. Thus, this cycle is not worth to be taken into account for further analysis since it is out of describing the regular flow of the process.
In case the whole process has a Wiener process character, then according to Eq. (2) the standard deviation throughout the process should vary as:
where stands for the initial value of the standard deviation.
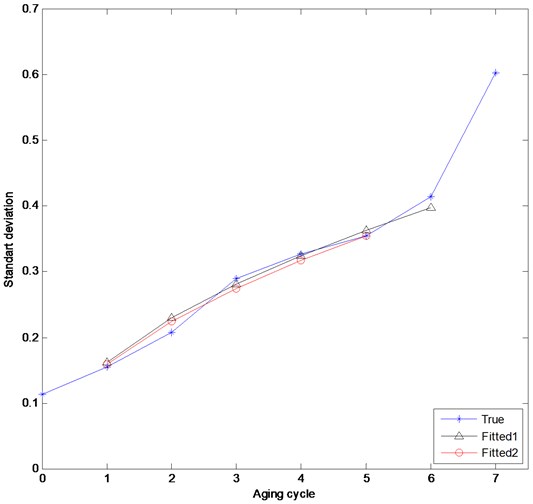
Fig. 3Standard deviations for each aging cycle (σk: True, σw1 and σw2: Fitted1 and Fitted2)
Each aging process corresponds to a certain period of degradation. Thus a relationship between the aging cycles and time is needed to be established in order to compare the variation of with . In this manner the aging cycle ()-axis in Fig. 3 can be considered as the normalized time axis for .
A curve fitting procedure for is followeddefining a square-root-function. Using the least square method for the curve fitting, the time varying standard deviation for the Wiener process is obtained as:
The fitted curve is also plotted in Fig. 3. Satisfactory overlapping of the and curves is observed for 1. According to the definition of the Wiener process 0 for 0. But for the true data this is not possible, since more or less there will be vibrations even if the motor including the bearing is new. Thus it would not have any sense to compare the -values for 0. That’s why value for 0 is not pointed in Fig. 3. The sum of square error () for this fitting is calculated as 0.0015.
As explained before, the last aging cycle caused full damage on the bearing. In addition to this information curve in Fig. 3 indicates that it is very likely that the bearing approached the end of its useful life almost with the 6th aging cycle. Assuming this consideration to be true and therewith excluding even the 6th cycle from the whole process results in a better fitting with:
The sum of square error for this case is calculated as 0.00074, while the five data for 1 to 5 of Fig. 3 would give 0.001.
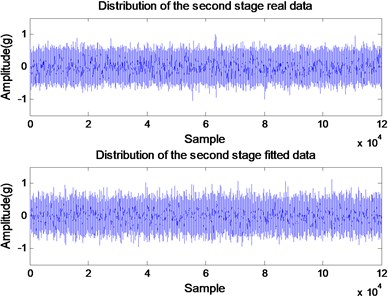
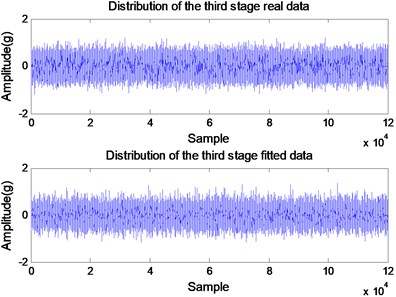
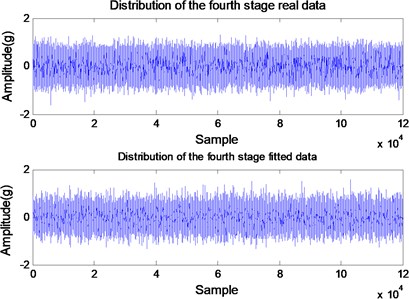
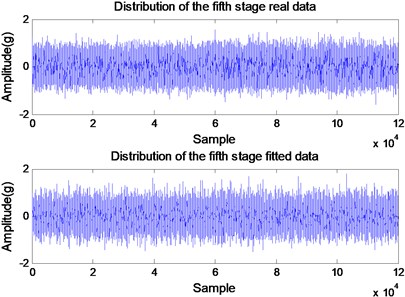
High coincidence between and – curvesstrengthens the validity of the hypothesis that the degradation of the bearing in induction motors can be modeled as a Wiener process. To verify this consideration time domain signals are created for 2 taking the signal for 1 as reference. The variance of a distribution is defined as the expectation of the square of the deviation from the mean. The expectation is a linear operator; thus we can conclude that any variable given in terms of the variable as (: a constant real number) will have the standard deviation . Hence, for each cycle for 2 time domain signals are obtained by multiplying each sample amplitude recorded for 1 by . Because the sampling frequency is 12 kHz, for each cycle 120000 samples are acquired in 10 seconds. Fig. 4 shows the comparison between the acquired (true) data and the created data. Both curves present clearly a good coincidence for 2 to 5 regarding the overall amplitudes of the signals.
Fig. 4Comparison between the acquired (true) and the created time-domain data for: a) k= 2, b) k= 3, c) k= 4, and d) k= 5
a)
b)
c)
d)
Fig. 5Difference of the high-valued amplitude densities between the true and fitted data of the 5th aging stage
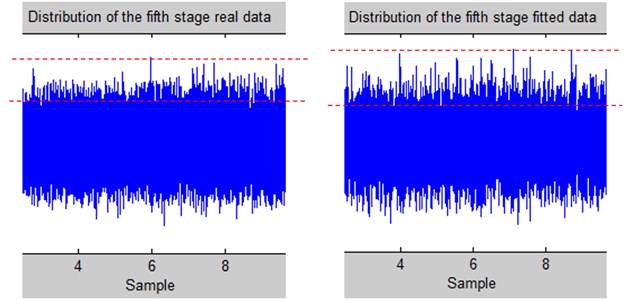
On the other side, carefully examining the time domain signals exhibits that although the overall amplitudes of the true and created signals already match each other very closely; the density of the high-valued samples is higher for the true data. The mid-region of Fig. 4(d) is zoomed to form Fig. 5 which helps to recognize this fact more clearly. This fact has obviously its explanation that for advancing aging stages high-frequency signals enter the process. The validity of this consideration conditions frequency domain analysis which is performed already in another study [15]. It is shown by means of power spectral density (PSD) analysis that at early stages of the process 1 kHz is the dominant frequency component of the vibration, while the frequencies in the range of 2-4 kHz affect the system significantly in progressive cycles [15].
5. Conclusion and discussion
In this study it is first claimed that the degradation of the bearings in electric motors can be characterized as a Wiener process explaining the reasons for this consideration on mathematical basis. Later, this consideration is proved experimentally. In order to shorten the experiment time for long-term processes in practice usually accelerated aging processes are used. This way is also followed in this study. The aging of the bearing is simulated in such a way that its lifespan is divided in eight cycles. Processing the total collected data in time domain denotes that the degradation of the bearing of an induction motor is of a Wiener process character.
The results of this study are easily applicable to practice in order to predict the residual useful life of a bearing in an induction motor unless the operating conditions change. This procedure requires vibration measurements with almost equal time intervals after a certain period the machinery is taken into operation. These data will be used to define the parameter of the Wiener process. If a remarkable deviation from the Wiener process character is observed while monitoring the machinery later on, this situation has to be interpreted as an alert that the bearing is near to fail. In case even the next measurement points to further deviation from the Wiener process, this will be a clear proof for a near failure of the bearing.
References
-
Nicholas J. R. Predictive condition monitoring of electric motors. P/PM Technology, 1993, p. 28-32.
-
Bonnett A. H., Soukup G. C. Cause and analysis of stator and rotor failures in three-phase squirrel-cage induction motors. IEEE Transactions on Industry Applications, Vol. 28, Issue 4, 1992.
-
Bisbee G. A. Why do motor shaft and bearing fail. Tappi J., Vol. 77, Issue 9, 1994, p. 251-252.
-
Bishop T. H. Motor failures: common causes (and solutions). Plant Engineering and Maintenance, 2010.
-
Humbert S. Detection of electrical discharges in bearings. SKF Maintenance Products, 2008.
-
Yazıcı B., Kliman G. B. An adaptive statistical time-frequency method for detection of broken bars and bearing faults in motors using stator current. IEEE Trans. Ind. Appl., Vol. 35, Issue 2, 1999, p. 442-452.
-
Gabor D. Theory of communications. J. IEE., Vol. 93, 1946, p. 429-457.
-
Costello M. J. Shaft voltages and rotating machinery. IEEE Transactions on Industry Applications, Vol. 29, Issue 2, 1993, p. 419-425.
-
Schoen R., Habetler T. G., Kamran F., Bartheld R. G. Motor bearing damage detection using stator current monitoring. IEEE Transactions on Industry Applications, Vol. 31, Issue 6, 1995, p. 1274-1279.
-
Bonnett A. H. Root cause AC motor failure analysis with a focus on shaft failures. IEEE Transactions on Industry Applications, Vol. 36, Issue 5, 2000, p. 1435-1448.
-
Şeker S., Ayaz E. Feature extraction related to bearing damage in electric motors by wavelet analysis. Elsevier, Journal of the Franklin Institute, Vol. 340, Issue 2, 2003, p. 125-134.
-
Şeker S., Ayaz E. A study on condition monitoring for induction motors under the accelerated aging process. IEEE Power Engineering Review, Vol. 22, Issue 7, 2002, p. 35-37.
-
Seker S., Onal E., Kaynas T., et al. A neuro-detector based on the cybernetic concepts for fault detection in electric motors. Journal of Vibroengineering, Vol. 13, Issue 4, 2011, p. 629-637.
-
Sonmez D., Seker S., Gokasan M. Entropy-based fault detection approach for motor vibration signals under accelerated aging process. Journal of Vibroengineering, Vol. 14, Issue 3, 2012.
-
İkizoğlu S., Çağlar R., Şeker S. Hurst parameter and fractal dimension concept for fault detection in electric motors. International Review of Electrical Engineering, Vol. 5, Issue 3, 2010.
-
Ayaz E., Öztürk A., Şeker S., Upadhyaya B. R. Fault detection based on continuous wavelet transform and sensor fusion in electric motors. The International Journal for Computation and Mathematics in Electrical and Electronic Engineering, Vol. 28, Issue 2, 2009, p. 454-470.
-
National research council. Accelerated aging of materials and structures: the effects of long-term elevated-temperature exposure. Washington, the National Academies Press, 1996.
-
IEEE Std 117. IEEE Standard test procedure for evaluation of systems of insulation materials for random-wound AC electric machinery. IEEE, Piscataway, 1974.
-
Guerin F., et al. Bayesian estimation of degradation model defined by a Wiener process. Mathematical and Statistical Models and Methods in Reliability, Statistics for Industry and Technology, 2010, p. 345-357.
-
Brown R. A brief account of microscopical observations made in the months of June, July and August, 1827, on the particles contained in the pollen of plants; and on the general existence of active molecules in organic and inorganic bodies. Phil. Mag., Vol. 4, 1828, p. 161-173.
-
Viniotis Y. Probability and random processes for electrical engineers. Mc-Graw Hill International Editions, 1998, p. 458-460.
-
Leon-Garcia A. Y. Probability, statistics and random processes for electrical engineering. Pearson Education Inc., 2008, p. 517-535.
About this article

The authors present their deepest thanks to Prof. Dr. Belle Upadhyaya from the University of Tennessee for providing the experimental data.
