Abstract
A series of field measurement data is used to establish the prediction model of ground vibration induced by Taiwan high-speed trains on embankments. These measurements consist of various possible influence factors, such as train speed, ground shear wave velocity, and structure volume. The characteristics of near-field ground vibration, far-field vibration propagation, and vibration influence distance are then evaluated from these measurement data. The analyses reveal that the near-field ground vibration level mainly depends on train speed and ground shear wave velocity. The influence of structure volume on the vibration level is minor. The far-field vibration propagation is affected by ground shear wave velocity. The analysis results also show that the attenuation coefficient is different for each frequency range. In general, the measured ground vibration in the high frequency range has the highest attenuation coefficient and that in the low frequency range has the lowest. For the vibration influence distance, the rock can propagate the vibration to the farthest distance among all soil types while the sand/silt/clay soils show the shortest. Finally, a specific ground vibration prediction model is established using these characteristics.
1. Introduction
Ground vibration induced by high-speed trains can reach levels that disturb humans and interrupt sensitive instrumentation. Numerous researchers have studied ground vibration characteristics to develop a scheme for vibration mitigation. The main factors that affect vibration levels can be grouped into vibration source, vibration path, and vibration receiver [1-3]. The vibration receiver primarily depends on the structural design of buildings. Therefore, the characteristics of the near-field vibration source and far-field vibration propagation path are more easily established for a given existing rail system.
Among all the possible influence factors for near-field and far-field vibrations, numerous authors [1-5] have concluded that train speed, ground condition, and frequency dependence are the most important factors in evaluating the vibration behavior of high-speed trains. Other researchers [5, 6] have studied the ground vibration behavior of high-speed trains on a bridge structure and demonstrated that the concrete volume of a structure may also affect the vibration characteristics.
Chen et al. [4] measured the ground vibration induced by Taiwan high-speed trains on embankments with a wide variety of influence factors, including train speed, ground condition, and embankment height. The study mainly focused on far-field vibration propagation. However, understanding the characteristics of near-field vibration, vibration path, and influence distance for various influencing factors is essential in engineering practice. A convenient assessment model is also useful for engineers to predict possible vibration effects in the preliminary design stage. Therefore, systematically understanding ground vibration characteristics and establishing a simple vibration assessment for high-speed trains on embankments is important.
In this study, extensive measurement data from Taiwan high-speed trains on embankments are used to establish ground vibration characteristics. These measurements comprise of all possible influence factors. A simple prediction model is then established based on these characteristics as a preliminary ground vibration assessment.
2. Trainset
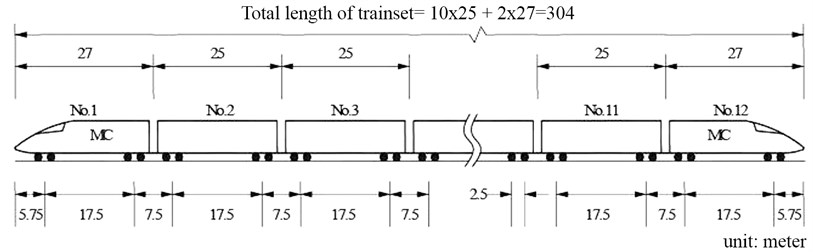
The trainset of the Taiwan high-speed trains consists of 12 train-cars with 10 cars for passengers and 2 cars as locomotives. The lengths of the passenger car (PC) and motive car (MC) are 25 m and 27 m, respectively; thus, the total length of the trainset is 304 m. The trainset configuration and related dimensions of Taiwan high-speed trains is shown in Fig. 1.
Fig. 1Configuration of trainset for Taiwan high-speed trains
3. Measurement of ground vibration
The measuring equipment includes accelerometers, integrator, a data acquisition system, and power supplier. The measured vibration accelerations included (longitudinal), (transverse), and (vertical) directions. Only the vertical component ( direction) is used in the subsequent discussion because some codes, such as Japanese code, etc., consider direction for analysis to simplify the process of vibration impact assessment.
The vibration measuring plan includes near-field and far-field vibration measurements. To establish the near-field vibration database in a consistent reference plane, the distance of the near-field vibration was set at about 25 m from the track center. For far-field measurement, 4 measurement points in each site, which were in a straight line and perpendicular to the train alignment, were used to simultaneously measure the ground vibration when trains pass through the specific location. Before measuring, all equipment must be synchronized.
4. Database for analysis
A series of measurements were performed for this study. These measurements comprised different ground conditions, embankment heights, and train speeds. Table 1 lists the basic information for these measurements. Sites 1, 2, 8, and 10 were used to study near-field ground vibration and far-field vibration propagation. The other sites were used only for near-field vibration. The measurement of the near-field vibration was 25 m from the track center. These selected embankments have various heights ranging from 3.6 m to 11.0 m.
A wide variety of ground conditions and ground shear wave velocities () were considered. The ground condition included sand/silt/clay soils (silty clay, silty sand, and sandy silt), gravels, and rocks (mudstone and sandstone). The ground condition of these embankments ranged from soft to hard ground.
Ground shear wave velocity was used as an indicator in describing “soil stiffness”. The value of increases with increasing soil stiffness. The National Center for Research on Earthquake Engineering (NCREE) measured the ground shear wave velocity throughout Taiwan. The site where NCREE measured the ground shear wave velocity is adjacent to the location of the ground vibration measurement in the present study. Both have relatively similar ground conditions and geotechnical parameters. The average ranged from 170 m/s to 650 m/s. The values of average were taken from ground surface to 10 m deep, based on the suggestion by Yoshioka [5], because it would be a representative of the surface wave analysis. The database was considered a sufficient representative sample to evaluate ground vibration characteristics.
Table 1Basic information of measurement sites
Site No. | Soil type | Embankment height, (m) | Ground shear wave velocity, (m/s) | Measurement distance from source (m) | Measurement purpose |
1 | silty clay | 5.3 | 170 | 28, 53, 78, 101 | near-field and far-field vibrations |
2 | sandy silt | 5.2 | 230 | 33, 68, 93, 118 | near-field and far-field vibrations |
3 | silty sand | 8 | 238 | 25 | near-field vibration |
4 | gravel | 7 | 422 | 25 | near-field vibration |
5 | gravel | 9.6 | 335 | 25 | near-field vibration |
6 | gravel | 5.6 | 388 | 25 | near-field vibration |
7 | gravel | 10.3 | 426 | 25 | near-field vibration |
8 | gravel | 3.6 | 430 | 36, 69, 149, 203 | near-field and far-field vibrations |
9 | mudstone | 6.4 | 461 | 25 | near-field vibration |
10 | sandstone | 6.8 | 650 | 22, 47, 122, 202 | near-field and far-field vibrations |
11 | sandstone | 11 | 460 | 25 | near-field vibration |
5. Analysis method
Given the characteristics of ground vibration induced by high-speed trains, a range of amplitudes (10 dB to 100 dB ref. 1 micro-inch/sec) and frequencies (1 Hz to 100 Hz) were needed for the assessment. A frequency domain of 1/3 octave bands for a center frequency range of 1 Hz to 100 Hz was used in describing the velocity vibration level to evaluate the frequency effect.
The ground vibration level was expressed in terms of its root-mean-square (RMS) velocity. The RMS velocity level was computed using the following steps:
1) First, fast Fourier transform (FFT) was used to transfer the velocity of time history to the frequency domain. The power spectrum density function (PSDF), , was then calculated as follows:
where – FFT amplitude, – time interval of , and – frequency (Hz). A suitable time interval (8 seconds in this study) that covers ground excitation during the passing of train was selected from the time history record.
2) PSDF was accumulated from the lower band to the upper band as follows:
where , , and are the lower band, upper band, and center frequencies, respectively. represents the energy summation from to . The frequencies of , , and are based on the definition of the 1/3 octave band in ANSI [7].
3) RMS of was calculated as follows:
4) RMS velocity level (), which is represented by , was calculated as follows:
where the referred velocity in this study is 10-6 in/sec (2.54×10⁻⁸ m/sec).
The concept of total vibration energy [4, 5] was used in the study. The overall vibration level of the 1/3 octave bands was used to evaluate the total vibration energy. The overall vibration level was transformed from the RMS vibration level of each 1/3 octave band using the following equation:
where is the overall vibration level in decibels, is the center frequency of each 1/3 octave band (1 Hz to 100 Hz for the frequency of to ), and is the vibration level for each center frequency.
A simple equation proposed by Gutowski and Dym [8] and modified from Bornitz [9] was used to estimate vibration decay. Gutowski and Dym considered both geometric and material damping under a line source into an expression of the Rayleigh wave (R-wave) attenuation as follows:
where and are the vibration amplitudes of the R-wave at distances and , respectively; and are the distances from the vibration source; and is the vibration attenuation coefficient for the soil material.
Previous studies [10, 11] have concluded that the dependence of frequency is highly important in analyzing vibration attenuation. Therefore, two types of ground vibration attenuations were evaluated from the measured results in the subsequent analysis. The attenuation was initially analyzed regardless of the dependence of the frequency. The overall vibration level () of all 1/3 octave bands (1 Hz to 100 Hz) was used to evaluate the total vibration energy. The attenuation coefficient for high-speed trains with overall vibration level of each measured point can be back-calculated from four measurement points using Eq. (6).
The second approach is classification of the attenuation based on low, middle, and high frequency ranges. The frequency range was selected based on an observation of the numerous practical results and related literature [4, 12, 13, 14]. Given these principles, 21 frequencies for the 1/3 octave band with 1 Hz to 100 Hz were divided into three groups: low (1 Hz to 8 Hz), middle (10 Hz to 25 Hz), and high (31.5 Hz to 100 Hz) frequency ranges. The overall vibration level and vibration attenuation coefficient for each frequency range can then be computed using Eq. (5) and (6), respectively.
The vibration influence distance is defined as the location of the measured vibration level, which is close to the value of the background vibration level at a specific measurement site. Difficulties may arise in finding the required distance for the complete attenuation of the vibration because of the measurement site conditions. Therefore, certain attenuation distances were inferred from the analysis of the measured near-field vibration level, the background vibration levels, and the vibration attenuation coefficient for the given measured points.
6. Analysis results of near-field ground vibration
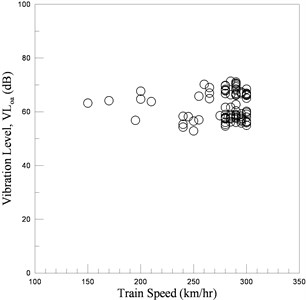
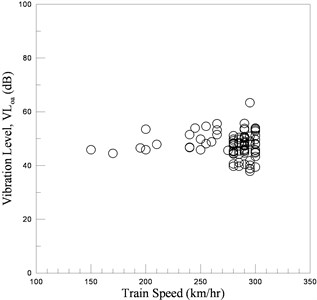
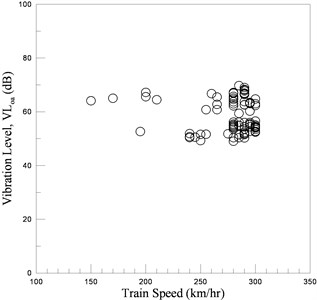
The relationships between train speed and near-field overall vibration level () for the entire, low, middle and high frequency ranges are indicated in Figs. 2(a)-2(d), respectively. On average, the overall vibration level for the entire frequency range increases slightly with increasing train speed, as shown in Fig. 2(a). This result is consistent with the general supposition. The trend of the frequency dependence factor is obvious in the low and middle frequency ranges, as shown in Figs. 2(b) and 2(c), but not in the high frequency range, as shown in Fig. 2(d). The vibration level also does not seem to further increase and becomes flat for any frequency range in which the train speed is above 250 km/hr.
Fig. 2Relationships of VLoa and train speed for a) entire, b) low, c) middle, and d) high frequency ranges
a)
b)

c)
d)
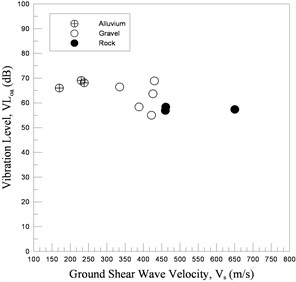
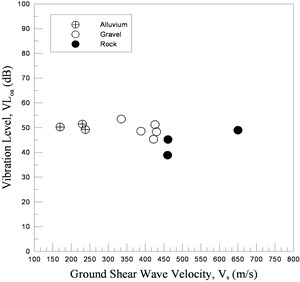
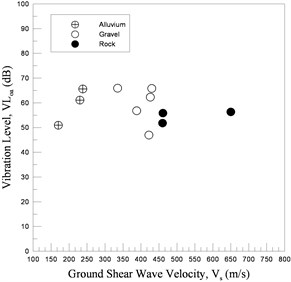
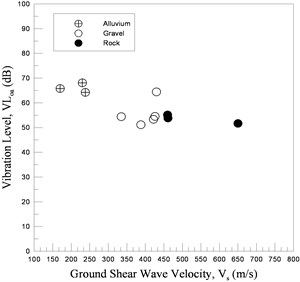
Figs. 3(a)-3(d) show the relationship of the overall vibration level and the ground shear wave velocity () for the entire, low, middle, and high frequency ranges, respectively. The analyzed data in Fig. 3 were adopted from the train speed ranging from 250 km/hr to 300 km/hr for consistency. The vibration level slightly decreases with the increase of in any frequency range at such consistent train speed range. Therefore, softer ground leads to higher vibration level. The overall vibration level for the entire frequency range is from 67 dB to 70 dB for the soft ground. The trend is also relatively obvious in the high frequency range, but is minimal in the low and middle frequency ranges.
Fig. 3Relationships of VLoa and Vs for a) entire, b) low, c) middle, and d) high frequency ranges
a)
b)
c)
d)
The factor of the embankment volume, which is caused by different embankment heights, was also examined in this study. The embankment volume is defined as the calculated volume of filled soil above the ground surface, with a unit of m3. No clear relationship was observed between overall vibration level and embankment volume for the entire frequencies and the various frequency ranges based on the analysis results. Therefore, the relationship is not significant enough to warrant conclusion. These results are not presented in the paper.
7. Analysis results of far-field vibration propagation
Chen et al. [4] studied the far-field vibration propagation for Taiwan high-speed trains on embankments. The authors used the measured results of Sites 1, 2, 8, and 10 in Table 1 to analyze the attenuation coefficient () of Eq. (6). Fig. 4(a) shows the relationship between attenuation coefficient and ground shear wave velocity for the entire frequency range. The regression analyses show that is given as:
where – data points, – coefficient of determination, – standard deviation.
The value of decreases with increasing . A greater value indicates that the ground vibration rapidly attenuates. Therefore, the attenuation of ground vibration induced by high-speed trains was more obvious on the soft ground than on the hard ground. The variation of the mean values ranged from 1.2-4.0 (10-3/m), following the order from hard to soft ground.
The relationships of and for the various frequency ranges are shown in Fig. 4(b). The figure shows that the low frequency range has the smallest value and that the high frequency range presents the highest value for all sites. Therefore, the attenuation in the low frequency range was less than that in the high frequency range. The value of also obviously decreased with the increase of in the high frequency range. However, the difference in the attenuation coefficients for various was relatively small in the low and middle frequency ranges.
Fig. 4Relationships of α and Vs for a) entire frequency range and b) various frequency ranges [4]
![Relationships of α and Vs for a) entire frequency range and b) various frequency ranges [4]](https://static-01.extrica.com/articles/14917/14917-img10.jpg)
a)
![Relationships of α and Vs for a) entire frequency range and b) various frequency ranges [4]](https://static-01.extrica.com/articles/14917/14917-img11.jpg)
b)
8. Analysis results of vibration influence distance
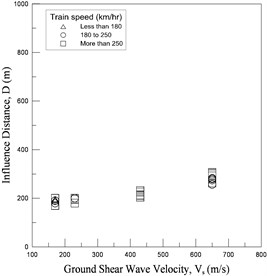
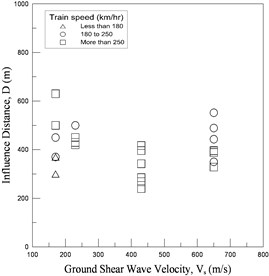
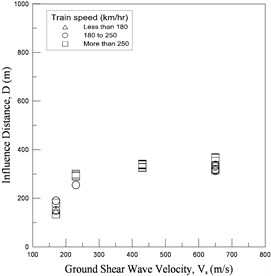
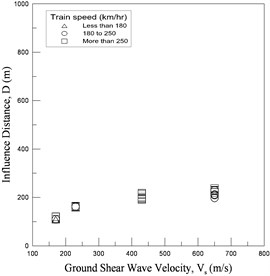
The analyses in this study reveal that train speed, ground shear wave velocity and frequency dependence can be considered as the main influence factors on vibration influence distance (). Fig. 5(a)-(d) show the relationship between vibration influence distance and ground shear wave velocity for the entire, low, middle, and high frequency ranges, respectively. In these figures, the train speed is divided into three groups (i.e., less than 180 km/hr, 180 km/hr to 250 km/hr, and more than 250 km/hr) to observe the effects of the train speed. However, this effect seems minimal in the measured train speed range.
Fig. 5(a) shows that the influence distance clearly increases with the increase of . The influence distances in sand/silt/clay soils, gravelly soils, and rock are 170 m to 200 m, 210 m to 230 m, and 260 to 310 m, respectively. These analysis results show that the embankment in rock has the farthest distance among the three soil types, whereas sand/silt/clay soils have the shortest distance. An observation of the frequency dependence in Fig. 5(b)-(d) reveal that the influence distance increases as the ground shear wave velocity increases for the middle and high frequency ranges, but the trend is not obvious for the low frequency range. The low frequency range generally has the farthest influence distance and can reach 600 m. These results are consistent with the results of the previous attenuation analysis because the low frequency range has the lowest attenuation coefficient. However, further field measurements are suggested to observe the influence distance of low frequency because the results present little variation in this study. To further investigate the influence distance, longer measurement distance from the vibration source and more measurement points should be employed during the vibration measurement.
9. Summary of ground vibration characteristics
The characteristics of the ground vibration induced by Taiwan high-speed trains on embankments are summarized in Table 2. The soil type is grouped into sand/silt/clay, gravel, and rock for convenience. The near-field ground vibration, far-field vibration propagation, and vibration influence distance are all included in the table. These ground vibration-related information are also sub-divided into entire, low, middle, and high frequency ranges.
The table can be used by engineers as a preliminary evaluation in predicting vibration impact. The ground vibration level beside the embankment at 25 m and the influence distance can be predicted based on the soil type, ground shear wave velocity, and train speed. A more detailed evaluation is suggested for high-vibration sensitivity case. The comprehensive evaluation requires more sufficient data regarding soil property, ground shear wave velocity, field measurement, and other factors.
Table 2Summary of ground vibration characteristics for high-speed trains on embankments
Ground type | Ground shear wave velocity (m/s) | Overall vibration levela (dB) | |||||||||
entireb | low | middle | high | ||||||||
Sand/silt /clay | 170-240 | 65-69 | 45-52 | 50-64 | 63-65 | ||||||
Gravel | 330-440 | 56-63 | 44-50 | 40-58 | 48-56 | ||||||
Rock | 460-650 | 56-59 | 43-52 | 54-56 | 50-55 | ||||||
Mean attenuation coefficienta, (10-3/m) | |||||||||||
entire | low | middle | High | ||||||||
3.41 | 0.58 | 2.15 | 7.27 | ||||||||
2.35 | 0.36 | 2.55 | 4.18 | ||||||||
1.26 | 0.73 | 1.48 | 2.08 | ||||||||
Influence distancea (m) | |||||||||||
entire | low | middle | high | ||||||||
165-185 | 280-500 | 260-390 | 130-140 | ||||||||
170-210 | 450-650 | 120-260 | 130-170 | ||||||||
345-390 | 300-560 | 435-460 | 300-350 | ||||||||
a Train speed is between 160 km/hr and 300 km/hr, b These values express in entire, low, middle, and high frequency ranges, respectively. | |||||||||||
Fig. 5Relationships of D, Vs and train speed for a) entire, b) low, c) middle, and d) high frequency ranges
a)
b)
c)
d)
10. Proposed prediction model for ground vibration assessment
To predict ground vibration due to the train system, existing methods in design manuals are not sufficient to reflect the complicated behavior [3]. This paper thus provides a relatively simple and reasonable model for general situations. This model is originally from existing handbooks and design manuals, and is enhanced by field test results in the above sections. This model can help engineers improve the accuracy of preliminary analysis, and is suitable to apply for a large number of preliminary assessments. A brief description of the model is presented below.
10.1. Simulation of vibration source
Since the geological condition is one of the major factors for the characteristic of vibration level, a rail line which has similar geological condition and embankment height in Table 1 is selected to represent the vibration source of the new planning line. The primary prediction vibration level is obtained from Table 2.
For the factor of train speed, the relationship from the design manual of FRA [1] is used to calculate the adjustment of vibration level for the other speed, as given by:
where adjustment – the adjustment of the vibration level of the train with the speed of , and – the train speed of the given vibration source.
10.2. Simulation of ground vibration attenuation
Local geological conditions demonstrated a very large effect on the vibration level and the transmitting distances of ground vibration from the previous field measurement results. Several wave propagation models have been developed in previous studies; however, many parameters need to be defined in the prediction models. The field measurement results of the investigated sites are used to represent the parameters of local geological conditions.
Ground vibration decay is primarily a function of soil damping and geometrical damping. Eq. (6) by Gutowski and Dym [8] can be used to predict the vibration level for a given distance from the center of high speed rail. The attenuation coefficient can be obtained from Table 2. The coefficient need adopt the value of low, middle or high frequency ranges for 1 to 8 Hz, 10 to 25 Hz, or 31.5 to 100 Hz, respectively. With the attenuation coefficient, the vibration influence distance for various frequency ranges can also be assessed using Eq. (6).
10.3. Simulation of vibration receiver
There are some handbooks for engineers to check the soil-structure coupling and building attenuation for the vibration receivers. The parameters for building conditions are foundation type, number of floors, and the damping ratio of the building. To estimate the vibration attenuation of soil-structure coupling, the suggested values in the design handbook [15] are used for the general design. The attenuation due to soil-foundation coupling loss in this prediction method is simplified to depend on the number of floors of the building. As mentioned previously, the current handbooks are somewhat simple and rough, and they may be suitable for an initial estimation only.
11. Conclusions
Field measured data were used to assess near-field ground vibration, far-field vibration propagation, and vibration influence distance of Taiwan high-speed trains on embankments. A wide variety of ground conditions and train speeds were included in the analysis database. Frequency dependence was also applied for analysis. Based on the analysis results, the following conclusions are emerged.
a) The near-field ground vibration level slightly increases with the increase of train speed for the entire frequency range. The trend is also obvious in both low and middle frequency ranges, but not obvious in the high frequency range.
b) The near-field ground vibration level decreases with the increase of ground shear wave velocity in any frequency range. A softer ground leads to a higher near-field vibration level.
c) The influence of embankment volume on vibration characteristics is minor.
d) The value of the attenuation coefficient decreases with the increase of ground shear wave velocity. Therefore, the attenuation of ground vibration is more obvious on soft ground than on hard ground.
e) The low frequency range has the smallest attenuation coefficient while the high frequency range presents highest value.
f) Comparing the influence distance for different soil types, the rock can propagate the vibration to the farthest distance while the sand/silt/clay soils show the shortest.
g) Among all frequency ranges, the vibration in low frequency range generally can propagate to the farthest influence distance.
h) Further field measured data are suggested to observe the influence distance of low frequency because the results present little variation in this study.
i) The proposed prediction model is a hybrid of field measurements and the current design handbook. The field measured database is used to improve the accuracy of vibration source and vibration path. The proposed model can help engineers improve the accuracy of preliminary analysis, and is suitable to apply for a large number of assessments.
References
-
U. S. Department of Transportation, Federal Railroad Administration High-Speed Ground Transportation Noise and Vibration Impact Assessment. Report Number 293630-1, 1998.
-
U. S. Department of Transportation, Federal Transit Administration Office of Planning and Environment, Transit Noise and Vibration Impact Assessment. Report Number FTA-VA-90-1003-06, 2006.
-
Chen Y. J., Ju S. H., Ni S. H, Shen Y. J. Prediction methodology for ground vibration induced by passing trains on bridge structures. Journal of Sound and Vibration, Vol. 302, Issues 4-5, 2007, p. 806-820.
-
Chen Y. J., Chang S. M., Han C. K. Evaluation of ground vibration induced by high-speed trains on embankments. Noise Control Engineering Journal, Vol. 58, Issue 1, 2010, p. 43-53.
-
Yoshioka O. Basic characteristics of Shinkansen-induced ground vibration and its reduction measures. Proceeding of International Workshop Wave 2000, Bochum, 2000, p. 219-237.
-
Chen Y. J., Shen Y. J., Chen K. Y., Chang S. M. Some characteristics of ground vibration as induced by high-speed trains. Proceedings of 4th Geotechnical Earthquake Engineering and Soil Dynamics, Sacramento, GSP 181, 2008.
-
American National Standards Institute Preferred frequencies and band numbers for acoustical measurement. ANSI S 1.6, 1984.
-
Gutowski T. G., Dym C. L. Propagation of ground vibration: a review. Journal of Sound and Vibration, Vol. 49, Issue 2, 1976, p. 179-193.
-
Bornitz G. Uber dieausbreitung der von groszkolben-maschinen erzeugten bodenschwingungen in die tiefe. Journal of Springer, 1931.
-
Huang C., Chen C. H., Ko Y. Y. Characteristics of ground vibrations in STSP deduced from in-situ tests. Proceedings of 3rd International Symposium on Environmental Vibration: Prediction, Monitoring, Mitigation and Evaluation, 2007, p. 432-449.
-
Wiss J. F. Construction vibration: state-of-the-art. Journal of Geotechnical Engineering, Vol. 107, Issue GT2, 1981, p. 167-181.
-
Gordon C. G. Generic vibration criteria for vibration-sensitive equipment. Proceedings of Optomechanical Engineering and Vibration Control, 1999.
-
Chen Y. J., Chiu T. J., Chen K. Y. Evaluation of ground vibration induced by high-speed trains on bridge structures. Noise Control Engineering Journal, Vol. 59, Issue 4, 2011, p. 372-382.
-
Chen Y. J., Huang T. C., Shen Y. J. Evaluation of ground vibration induced by rail systems. Noise Control Engineering Journal, Vol. 61, Issue 2, 2013, p. 145-158.
-
Saubermann H. J., Nelson J. T., WilsonG. P. Handbook of urban rail and noise control. Report for US DOT/Transportation System Center, 1982.
About this article

This study was supported by the National Science Council, Taiwan, under contract number: NSC 100-2221-E-033-073-MY3. The writers also acknowledge the National Center for Research on Earthquake Engineering (NCREE) of Taiwan for providing the information of ground shear wave velocity.
