Abstract
Mass volume train security detection network is a real-time and reliable onboard data communication network based on the train level and vehicle level Ethernet network, which will transmit and send mass volume train status and fault diagnosis information, the event log data, rich audio and video data. The network structure and topology is presented, which include all devices which can attach to the network. Then, a delay model of different network topology is put forward, which indicates that the onboard ring network is superior to the linear network topology. Finally, the analysis is confirmed by simulation results. The results indicated that onboard ring topology network will improve control and network function of train, enhance trains’ service and maintenance efficiency.
1. Introduction
CRH (China Railway High-speed) refer to any commercial train service in China with an average speed of 200 km/h (124 mph) or higher. China has the world’s longest High-speed rail network with over 11,028 km of routes in service as of December 2013, including the world’s longest line, the 2,298 km (1,428 mi) Beijing-Guangzhou High-Speed Railway. For CRH based on electric multiple units require onboard communication network to transmit traction and braking information so as to make the motor units to go harmoniously, status of all motors and trailer cars is transmitted through the network to the central control unit in cab for condition monitoring and fault diagnosis. In practice, onboard security detection network not only can decrease length of onboard train wire, and reduce the total weight of train, also improve the system integration, reliability and maintainability. Train onboard security detection network based Ethernet is used to transmit operating controlling, condition monitoring, fault diagnosis and passenger service information. It refers to all field bus technology to connect embedded subsystem to form onboard local area network so as to realize resource sharing, cooperation, distributed monitoring [1, 2].
There are lots of onboard mechanical, electrical and auxiliary equipments, and a large number of distributed sensors and intelligent nodes fixed in vehicles. Onboard security detection and fault diagnosis system requires that security detection network has highly real-time performance, good maintainability and expansibility, high broadband and interoperability, distributed task processing and data fusion, and sufficiently resilient to overcome rolling stock operation-specific hazards. TCN (Train Communication Network) has the low transmission rate, and cannot meet the requirements of mass volume data transmission and security detection system. Therefore, train security detection network which can transmit mass capacity data is becoming a developing trend. Internet technologies have been widely used in various areas since its large capacity, cost performance, and the number of engineers. Therefore, applying Ethernet technologies to rolling stock has been expected. Despite the fact that the nondeterministic nature of Ethernet was a problem, researchers have been able to meet real-time applications time requirements by changing packet format for real-time control messages, or by giving higher priority for these messages [3-5].
Rolling stock has harsh environments, high-vibration, limited installation space, wiring restrictions, and vehicles often need to be coupled and uncoupled. Compared to conventional TCN, Ethernet devices will reduce costs and increase functionalities. International standardization of Ethernet-based TCN has proceeded in International Electrotechnical Commission/Technical Committee 9/Working Group 43(IEC/TC9/WG43) as IEC 61375 series. Regional trains in Germany and Netherlands are currently being delivered by BOMBARDIER with an onboard Ethernet network. This is the world’s first example of Ethernet protocol being used for train control data management and security detection data transmission. The Bombardier Transportation system will integrate all the intelligent devices onboard into one Ethernet network which will fully replace the TCN in two or three years. SIEMENS is studying how to use the industrial Ethernet PROFINET as the train communication network. Japan Railway union has been developing a 100Mbps-Ethernet-based INTEROS (INtegrated Train communication/control networks for the Evolvable Railway Operation System), which main function is command transmission from a driver to onboard devices such as main traction converters and brake control devices. ALSTON is studying train and consist Ethernet, and cooperating with the French rail operator SNCF to test the onboard Ethernet performance of all TGV train. China’s first intelligent high-speed test train has realized the application of Internet of Things and sensor network, as well as multi-network integration on the train in 2013 [6-8].
2. Topology and onboard devices logical relation of train security detection network
The system and devices which is fixedly mounted on the train and connect with train security detection network comprise all sensors, AP (Access Point), FP (Fusion Point), ND (network noDe), CP (Central Point), DSM (Diagnostic Service Machine), and onboard wireless communication platform. The main function is as follows:
AP1 (Access Point 1) is responsible for connecting the FP and the sensors that is used to collect the data of traction, running, brake system and vehicle body balance. Then, AP1 converts sensor signal to the data identified by the FP with a unified communication protocol. AP1 includes conditioning devices which realize data pre-processing and diagnosis of the above onboard intelligent sensors.
Bogie AP2 (Access Point 2) is responsible for connecting bogie sensor, axle box composite sensor and the FP, and converts the sensor signal to the data identified by the FP with unified communication protocol. AP2 also includes conditioning devices likes AP1.
The FP is physically responsible for the connection to the AP and ND, and logically in charge of the local car AP’s data management and vehicle network management.
The CP is onboard system gateway, which is responsible for dynamic networking, network management and maintenance, network interface configuration, flow distribution, data cache, and using TCP/IP protocol to send and receive data.
The ND relays frames in Link Layer between two devices and responsible for data transmission with 100Mbps broadband, and it has functions of MAC bridge, online management, IP communication, VLAN division, priority control, dynamic networking and so on.
The DSM transmits data with the CP, mobile channel control devices through the security detection network and receives data from the FP. According to the running, traction, braking, auxiliary and surveillance subsystem, the DSM is responsible for encoding and decoding data packet, controlling and storage date flow, and making safety assessment and prioritization, realizing fault diagnosis and early warning.
OMCP includes an onboard wireless communication host, real-time channel unit and static channel unit. The OMCP communicates with the CP, diagnostic service host machine through security detection network, and realizes the data cache, confirms on-line and off-line large capacity transmission mechanism, data packing, controls the dynamic transmission unit and static transmission unit, achieves data transmission via static and dynamic modulation.
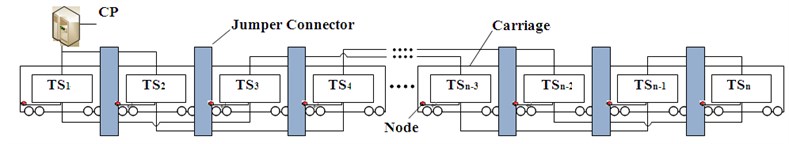
Vehicles are grouped in various forms. The EMU (Electric Multiple Unit) for high-speed train are of 8-vehicle short groups and 16-vehicle long groups, while the one for subway trains is of 4-vehicle short groups and 8-vehicle long groups. Generally, 4-vehicle is a train set. The architecture of train security detection network must be scalable to the different grouping form. Take a typical networked metro system, in which there are 4 cars per train set, its train security detection network topology is shown in Fig. 1. The ND acts as the central node of each vehicle. The network devices mounted in car A with cab mainly performs the train-to-ground communications link and establishes a consistent, uninterrupted, and low-latency link between a fast-moving train and trackside systems, which includes real-time and static channel unit, diagnostic services display terminal and the antenna, the TCN gateway as master and slave which is respectively mounted in the front and rear car A for 8-vehicle groups. The network devices installed in car B and car C, includes AP, FD, ND, as CP only mounted in both car B as master and slave. The network devices installed in car D, includes AP, FP, ND, DSM which is only mounted in one car D, OMCP which is only mounted in one car D and other related devices.
Fig. 1The train security detection network topology
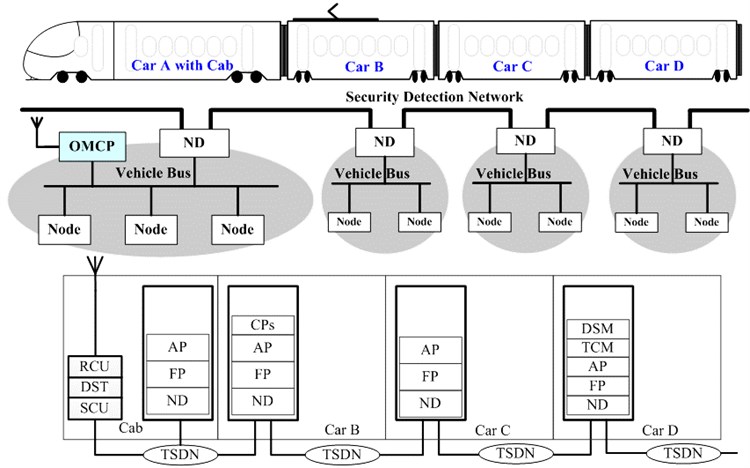
The logical and topology relation of train security detection network is shown in Fig. 1. Data from intelligent sensors will transmit controlling and diagnosis data from AP, FP, ND to train level network. The existing TCN network data will be transferred by the gateway between train security detection network and the TCN, then be transmitted to train level network through the ND. The DSM and the OMCP connect the train level network directly through the ND. The CP is responsible for the management and control of train level network through the ND. The DSM sends data to ground system through the OMCP.
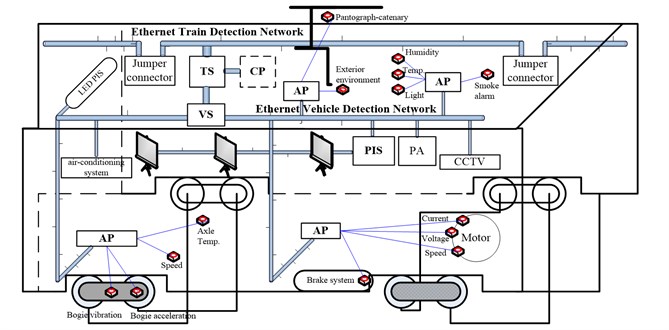
As train carriages and consists are frequently reconfigured, the speed and accuracy with which new inter-carriage and inter-consist links can be established are both key determinants in the overall operational efficiency of a railway operation. Train security detection network based Ethernet/IP technology, using TCP/IP protocol, divided into train level ETDN (Ethernet Train Detection Network) and vehicle level EVDN (Ethernet Vehicle Detection Network), can provide more automated solutions to the problem of quickly adapting train networks. The initial network configuration tasks will be automatically performed by the network system, without any operator intervention required. The ETDN network throughout the train, realizes the train network management, VLAN division, priority, dynamic networking, and so on. The EVDN network including a single, two, three, four or more vehicles forms fixed group, in charge of data and network management of local inter-carriage and inter-consist. The ETDN network is composed by zero, one, two or more the EVDN network. As one fixed operation urban train, the train network is simplified as one EVDN network. Train security detection network architecture is shown in Fig. 2, the TS (Train Switch) mainly refers to the ND, which can realize the ETDN and the EVDN network data conversion. The VS (Vehicle Switch) includes NP and FP. The ED (End Device) comprises a variety of sensor, AP, CP, DSM and OMCP, other devices provides data source for the TS and VS [9-12].
Fig. 2The train security detection network general architecture
3. Delay analysis of different topology structure
3.1. Node data delay analysis
The studies have proved, as a starting point, that switched Ethernet for train communication network applications, specifically for train security detection network, is a viable solution. The topology structure of train security detection network is shown in Fig. 1, nodes which include sensors and actuators communicate with a dedicated controller with different sampling period in the security detection network. In the train security detection network, as the restriction of network bandwidth and the uncertainty of data change, data collision and network congestion exist. Therefore, communication delay appears when data changes between lots of network node, jumper connectors between two vehicles also create delay. Communication delay will affect overall operational security and stability of a railway operation. Packet end-to-end delays and number of lost packets are measured, guaranteeing zero packet loss and delays within the sampling period of the network nodes [13-15].
Communication delay is the time from data packet of the sending nodes going into waiting status to the CP receives the full data packet, which is composed of five period of delay as follow:
1) , the processing delay for bottom nodes sending data, includes encapsulation delay of sending a packet from the application layer to network layer one by one, queue delay of data frames on the MAC buffer, sending delay depending on the length of the frame and MAC transmission speed. The last two delays refer to buffer response delay as data frames on the sending side.
2) , the transmission delay of physical link, the time of data packet transmission in the physical medium, which affects by the size of the packet, the physical media, the network bandwidth and the transmission distance. As using shielded twisted-pair cable to communication, transmission delay of each physical link unit is about 5×10⁻⁹ s/m.
3) , the CP processing delay, the store-and-forward time of onboard switches (TS and VS). refers to the total of delay caused by all switches, which are the main components of the network delay. It refers to the delay of each physical link unit. refers to the length of physical link.
4) , the delay of jumper connector, the delay after remote host receives and verifies data packet, then decodes it layer by layer and sends to application layer. As the stray current is relatively high in jumper connector, it will produce delay while network communication between vehicles through jumper connector. The delay time is determined by the connector performance.
5) , the receiving and processing delay of the CP, the delay of the CP verifying and reordering data packet, then decodes it layer by layer and sends to application layer.
By analyzing the Eq. (1), the CP data processing delay caused by a large number of network nodes is the main part of the communication delay. is composed of three period of delay as follow:
1) , exchange delay is determined by the quality of the switch, and specific values can be provided by switch manufacturers.
2) , frame forwarding delay, which is fixed by the forwarding mode and frame length. As Ethernet frame header length is fixed, the frame forward delay through switches is also fixed.
3) , buffer delay, which will based on input flow mode, such as regular mode or not regular mode.
The hop counts can be reduced when data transferred from bottom node to the CP by optimizing train security detection network topology and nodes deployment, so, it can effectively avoid switch delay.
3.2. Communication time delay analysis and optimization based on node deployment
Firstly, the delay of traditional linear network topology is analyzed. As data sending delay and data receiving delay are fixed by packet length and CPU processing performance, it will only focus on transmission delay and data processing delay.
Assuming one train has n vehicles, each TS set in the middle of vehicle, physical link length of adjacent switches is (considering the bend in actual wiring and gap between carriages, take this length about 1.5 times the central distance of adjacent carriages). The average distance of bottom nodes to TS is . The switch hop count from the car’s bottom nodes transmission data to the CP is , the total length via the physical link is , the number of node hop through jumper connector is , their mathematical expectation are respectively , and :
The CP is be deployed in the first car before optimization scheme, which is shown in Fig. 3.
Fig. 3The CP in the first car
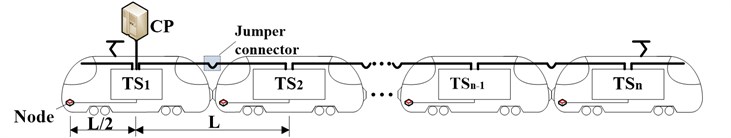
In this linear network topology, , , , 1, 2,…,, and:
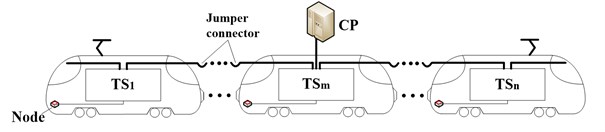
The CP is be deployed the m car in the middle of train after optimization scheme, when is odd, , when is even, , which is shown in Fig. 4.
Fig. 4The CP in the middle of train
In this linear topology train network, when :
When :
When is odd, :
When is even:
Summing up, when :
By comparing the and , and , and , it is observed that optimized scheme has lower latency than previous scheme. Both the total length of the physical link and the jumper connector number are not changed in the two schemes, however, the CP deployed in the middle of the train can avoid long distance communication which data sent from the tail to the head of train. In fact, this is to average the link, and avoid concentration leads to network congestion.
It can effectively reduce the link transfer average distance and average hop count when server is set in the middle of train, therefore, average network delay is lower than that in the head of train.
3.3. Communication time delay analysis and optimization based on node topology
In linear topology, it will pass through large amount of network nodes when data transferred from the last vehicle to the CP. The workloads of switches near the CP are heavy, that will cause network congestion and delay increases frequently, and affects the service quality of communication. The whole communication network will be paralyzed when one node breaks down, as they are in a same link. It is effective to replace the traditional linear network topology with ring redundancy topology.
Interval train switches connected end to end constitute ring redundancy network, which is an active network where each node is connected in series to two other nodes. The CP is located at the first carriage, then, the switching node of the first car is to connect to that of the second car. The ring redundancy topology of the train security detection network is shown in Fig. 5. In a similar way, the number of switch hop from the car’s bottom nodes transmission data to the CP is , the total length via the physical link is , the number of node hop through jumper connector is , their mathematical expectation are respectively , and .
Fig. 5The ring redundancy topology of the train security detection network
All the data transferred to the CP has to go through the first switch, and increases the workload in the first switch, leading to data packet congestion. If the CP also connects to the second switch, data in switches of even vehicle can be transferred to it directly and without going through the first switch.
As the switches in the first and second vehicle connect with the CP directly, the communication network constitutes a ring network topology. The physical link length of switches (e.g. switch 1 and switch 3, switch 2 and switch 4) in adjacent vehicles is . In this ring redundancy network, When is odd:
When is even:
When is odd, the mathematical expectation of is:
When is even, the mathematical expectation of is:
The mathematical expectation of and are:
Summing up, , , .
From the comparison of and , it can be concluded that the average transfer distance in ring network topology is the same as that of linear network topology, however, switch delay is only half as much. Since there are two communication links in redundancy design of ring network topology, it greatly reduces the switch hop count in data transmission, and network delay is decreased. Moreover, when transferring data through ring redundancy network, each switch has two choices, once one of the links breaks down, it can choose another one.
4. The delay estimation under different tasks
This section uses the OPNET to analyze the delay estimation of data transmission based on train security detection network under different network bandwidth. As each of the CRH2 (China Railway High speed 2) set consists of 8 cars. There is a train level switch in each car, so the network is divided into many smaller collision domains and each collision domain achieves the isolation through the train switches. According to the before and after optimization scheme, three scenarios are set respectively, the application link bandwidth are set up to 100 Mbps. The first scenario is set for linear topology, and the CP is deployed in the first carriage shown in Fig. 3. The second scenario is set for linear topology, while the CP is deployed in the middle carriage of the train shown in Fig. 4. The third scenario is set for onboard ring topology, and the CP is deployed in the first carriage shown in Fig. 5. Each carriage has one train switch which connects with four network nodes using to simulate four devices send security, status, test and passenger service information respectively.
4.1. Comparing the simulation results based on node deployment
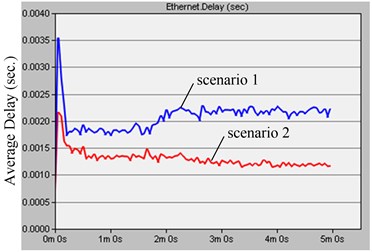
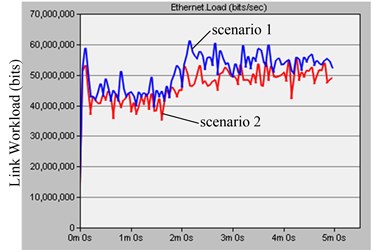
The network delay and link workload of the before and after optimization scheme are shown in Fig. 6.
Fig. 6Delay and workload comparing based on node deployment
a)
b)
The network delay mathematical expectation before optimizing is:
When is odd, the optimized network delay mathematical expectation is:
When is even, the optimized network delay mathematical expectation is:
Therefore, when tend to , .
The calculation and simulation results are basically identical. The left diagram of the Fig. 6 is the delay comparing the before and after optimization scheme. The network average delay before optimization scheme is about 2.2 ms shown in the scenario 1, while that after optimization scheme is about 1.2 ms shown in the scenario 2, it is basically accord with 2 times. It shows that reasonable CP node deployment can effectively reduce the train network delay. The right diagram of the Fig. 6 is the workload comparing of the before and after optimization scheme. The workload is basically the same before and after optimization scheme shown in the scenario 1 and scenario 2, it shows CP node deployment has a little influence on total network traffic, and roughly in line with expectations.
Reasonable CP node deployment can effectively reduce the node hop that underlying data sent to the server in the middle link, thereby reducing train security detection network delay. It notes that not all servers are suitable for deployment in the middle of the train. Some communication services which have very little traffic need driver real-time monitoring and feedback, such as traction and control system, its server must be set in the cab. The system which have mass volume data transmission, such as onboard CCTV and Passenger Entertainments system, its server will adapt to be set in the middle of the train.
4.2. Comparing the simulation results based on node topology
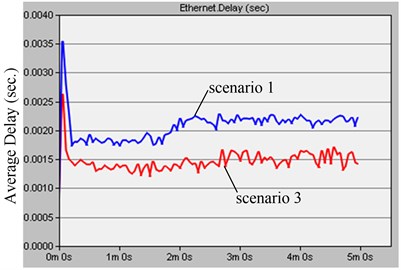
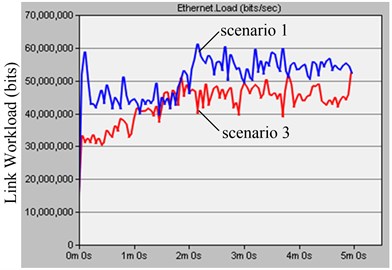
The network delay and link workload of the different node topology are shown in Fig. 7.
Fig. 7Delay and workload comparing based on node topology
a)
b)
When is odd, the network delay mathematical expectation of onboard ring topology is:
When is even, the network delay mathematical expectation of onboard ring topology is:
To sum up, .
It can be seen from the left diagram of the Fig. 7 that the network average delay of onboard linear topology after the network stability is about 2.2 ms shown in the scenario 1, and that of onboard ring topology is about 1.5 ms shown in the scenario 3. It shows the ring network topology average delay is lower than that of linear network topology, which is accordance with the requirement of delay that must be lower than 25 ms in the TCN standard. The right diagram of the Fig. 7 is the workload comparing onboard linear and ring topology, The CP workload of ring topology shown in the scenario 1 is lower than that of linear topology shown in the scenario 3, which shows linear topology is more congestive than that of ring topology in the case of equal amount onboard nodes.
By comparing the Figs. 6 and 7, it shows both node deployment and topology will affect network latency and link workload, and onboard ring topology, which overcomes the recovery time problem of STP/RSTP and ensures non-stop operation of networks with an extremely fast recovery time, has higher real-time, reliability, stability, fault-tolerance than linear topology in train security detection network. Therefore, MRP (Media Redundancy Protocol) defined in IEC 62439 is used to manage the onboard ring topology so as to ensure continue to communicate in case of failure on one of the redundant links.
5. Conclusions
In recent years, bandwidth requirements due to the installation of new embedded system onboard trains are growing rapidly. Now, the revising standard IEC 61375 is much extended. Mass volume security detection network runs in parallel to the existing TCN or solely used for all kinds of communication in train.
As common topology in traditional train communication network, linear network topology has many insufficiencies. Based on mathematical method and simulation, it shows that onboard ring topology is superior to linear network topology in train security detection network. The hop counts in ring network topology are reduced, there are two links chosen in each train switch. The communication network model based on Ethernet technologies will help to optimize rail transit network node, reducing network delay, and improving network communication quality, guarantying the safety of rail transit. In the next stage of our research, we intend to test the delay performance of security detection network by transmission experiments. Then, we will establish onboard wireless detection network using 802.11b/g/n standards, analysis and verify delay of the structure, develop networking products feature constant high-speed connectivity, swift wired and wireless network redundancy, vibration-proof casing and connectors, wide operating temperature range, and fast wireless roaming.
References
-
Beugin J., Marais J. Simulation-based evaluation of dependability and safety properties of satellite technologies for railway localization. Transportation Research Part C: Emerging Technologies, Vol. 22, Issue 6, 2012, p. 42-57.
-
Gianmarco B., Igor N. F., Marcelo M., Marco L., Vincenzo P., Enzo B., Giuseppe R., Raffaele M., Marcoccio S., Senesit F. An early warning system for detecting GSM-R wireless interference in the high-speed railway infrastructure. International Journal of Critical Infrastructure Protection, Vol. 3, Issue 3-4, 2010, p. 140-156.
-
Verstichel S., Hoecke S. V., Strobbe M., Berghe S. V., Turck F. D., Dhoedt B., Demeester P., Vermeulen F. Ontology-driven middleware for next-generation train backbones. Science of Computer Programming, Vol. 66, Issue 1, 2007, p. 4-24.
-
Lovati V., Palmieri G., Gervasini S., Colombo A. M. An ID-Card based security system for railway applications. Social and Behavioral Sciences, Vol. 48, 2012, p. 234-245.
-
Rodriguez M. C., Alexandres S., Muñoz J. D. Broadband system to increase bitrate in train communication networks. Computer Standards & Interfaces, Vol. 31, Issue 2, 2009, p. 261-271.
-
Flammini A., Ferrari P., Marioli D., Sisinni E., Taroni A. Wired and wireless sensor networks for industrial applications. Microelectronics Journal, Vol. 40, Issue 9, 2009, p. 1322-1336.
-
Mohammad Z. A., Chin K. W. TrainNet: A transport system for delivering non real-time data. Computer Communications, Vol. 33, Issue 15, 2010, p. 1850-1863.
-
Wu X. X., Chen C., Bu J. J., Chen G. Sensor network architecture for intelligent high-speed train on-board monitoring. Journal of Zhejiang University-Science A, Applied Physics & Engineering, Vol. 12, Issue 12, 2011, p. 921-925.
-
Chen L. J., Shan Z. Y., Tang T., Liu H. J. Performance analysis and verification of safety communication protocol in train control system. Computer Standards & Interfaces, Vol. 33, Issue 5, 2011, p. 505-518.
-
Refaat T. K., Amer H. H., Daoud R. M. Reliable architecture for a two-wagon switched ethernet train control network. 3rd International Congress on Ultra Modern Telecommunications and Control Systems and Workshops, 2011, p. 1-7.
-
Zeng Z., Ding R. J., Yang W. F., Lu X. Y., Feng J. F. A distributed comparison algorithm for train inauguration protocols over ethernet. International Conference on E-Product E-Service and E-Entertainment, 2010, p. 1-5.
-
Wang S. J., Zhang T. X., Zhang G. S. Time triggered controller area network for electric vehicles using compound scheduling strategy. Automotive Engineering, Vol. 32, Issue 11, 2010, p. 993-996.
-
Gao K., Huang Z. W., Wang J., Peng J., Liu W. R. Decentralized control of heavy-haul trains with input constraints and communication delays. Control Engineering Practice, Vol. 21, Issue 4, 2013, p. 420-427.
-
Richard M. L., Jesper L., Matthias E., David M. R. A set packing inspired method for real-time junction train routing. Computers & Operations Research, Vol. 40, Issue 3, 2013, p. 713-724.
-
Min O. Y., Zhao L. J., Liu H., Pan Z. Z. Comparisons of complex network based models and real train flow model to analyze Chinese railway vulnerability. Reliability Engineering & System Safety, Vol. 123, 2014, p. 38-46.
About this article

This work is financially supported by the National Natural Science Foundation of China under project (Grant No. 51165001), Guangxi Natural Science Foundation Program (Grant No. 2013GXNSFAA019297), and Guangxi Key Laboratory of Manufacturing System and Advanced Manufacturing Technology (Grant No. 10-046-07S05).
