Abstract
Rock permeability impacts by effective stress. Permeability modulus is used to evaluate the level of permeability reduction due to effective stress change. And the permeability modulus is always obtained by the experiment which assumes that the overburden pressure is constant during production. Actually, the overburden pressure reduces during production due to stress arch effect and it is easy to form a stress arch in the overburden when the reservoir is small and soft compared with surrounding’s rock. Based on the definition of the permeability modulus, we obtain an expression between permeability modulus considering stress arch effect and permeability modulus without stress arch. There lies a linear ship between and , which is also proved by the experiment data. Based on the relationship between and , a delivery equation for vertical fractured well is established. Compared with the absolute open flow with stress arch ratio of 0, the absolute open flow increases by 2.87 %, 6.79 %, 12.32 %, 20.12 % and 25.44 % for the stress arch ratio of 0.12, 0.28, 0.5, 0.8 and 1, respectively, with permeability modulus of 0.0397 MPa-1. And it increases by 7.31 %, 18.1 %, 34.88 %, 61.02 % and 79.97 % for the stress arch ratio of 0.12, 0.28, 0.5, 0.8 and 1, respectively, when 1. So absolute open flow with high permeability modulus is more sensitive to stress arch ratio. Stress arch also impacts the optimum fracture half-length. Vertical well has the maximum absolute open flow when it has the optimum fracture half-length. The maximum absolute open flow increases with the increasing of stress arch ratio, while optimum fracture half-length decreases with increasing of stress arch ratio for the same permeability modulus . Compared with case with no stress arch, the optimum fracture half-length reduces by 2.86 %, 5.7 %, 11.43 %, 17.14 % and 22.86 % for the stress arch ratio of 0.12, 0.28, 0.5, 0.8 and 1 respectively when equals to 0.0397 MPa-1. While the maximum absolute open flow increases by 1.6 %, 3.8 %, 7.16 %, 12.02 % and 15.60 % for the stress arch ratio of 0.12, 0.28, 0.5, 0.8 and 1 respectively. Thus, vertical well considering stress arch needs smaller fracture half-length than that with no stress arch. Meanwhile, the maximum absolute open flow and optimum fracture conductivity both increase as stress arch ratio increases. Compared with the case without stress arch, the optimum fracture conductivity increases by 50 %, while the maximum absolute open flow increases by 21.40 % with stress arch ratio of 0.5 when equals to 0.0397 MPa-1. The stress arch greatly impacts on the stress sensitive permeability, permeability modulus and well performance, which can’t be neglected especially in the low and ultra-low permeability reservoir.
1. Introduction
Rock permeability is sensitive to the effective stress. Permeability modulus is always used to evaluate the permeability reduction due to effective stress change [1]. Permeability modulus can be obtained by the experiment data and all previous experiments assume that the overburden pressure is constant during production [2-7]. Some authors established the delivery equation considering the stress sensitivity of permeability based on the definition of the permeability modulus [8-9]. And they concluded that production of the low and ultra-low permeability reservoir is significantly affected by the stress sensitivity of permeability.
However, the reservoir, unlike a free body, is attached to the surrounding rocks. Due to the internal driving forces and external constrains, change of overburden pressure may be occurred, which is called stress arch effect [10]. When stress arch generates, part weight of the overburden is supported by the sideburden during reservoir compaction [10-15]. Stress arching ratio is used to describe the value of the overburden pressure drop per unit pore pressure drop and it is related to the reservoir’s geometry and rock properties of the reservoir and surrounding’s rock [10-14]. When the reservoir is small and soft compared with the surrounding rock, it is easy to form a stress arch in the overburden [13-19]. So, the permeability modulus obtained by the experiment, which assumes that the overburden pressure is constant, can’t reflect the permeability change during the production and the delivery equation can’t reflect the productivity during the production.
In the previous work, we find that the stress sensitive permeability is significantly impacted by the stress arch effect [20]. In this paper, we begins with the definition of the permeability modulus. A new permeability modulus considering stress arch effect is established, which is proved by experiment data in Sulige gas field. Based on this new permeability modulus, a delivery equation for vertical fractured well is established. Then, we analysis the stress arch influence on productivity, optimum fracture half-length and optimum fracture conductivity.
2. Permeability modulus considering stress arch effect
Permeability modulus, which is used to evaluate the change of permeability induced by production, which is defined as [1]:
where is permeability modulus without stress arch, MPa-1. is permeability measured at the pressure of , md. When Biot’s coefficient equals to 1, the effective stress change can be described as follows:
where is effective stress change, MPa. means the overburden pressure change, which equals to 0 when there is no stress arch in the overburden. So the permeability modulus can also be expressed as:
When a stress arch forms in the overburden, the permeability modulus still can be defined as Eq. (4):
where is permeability modulus with stress arch. The effective stress considering stress arch effect can be expressed as Eq. (5) when Biot’s coefficient equals to 1 [10]:
Then permeability modulus considering stress arch effect can be described as Eq. (6):
where is stress arch ratio, dimensionless. Stress arch ratio is defined as the ratio between stress change and pore pressure change, which varies between 0 and 1. The stress arch ratios can be calculated by the theories of inclusion and inhomogenieties, and they are greatly impacted by the reservoir geometry, Poisson’s ratio and the shear module ratio between the reservoir and surrounding rocks [10].
Combined Eq. (3) with Eq. (6), there is a linear ship between permeability modulus considering stress arch effect and permeability modulus without stress arch:
When 0, there is no stress arch in the overburden, so . When 1, the overburden pressure change equals to pore pressure change and effective stress remains unchanged during production. The permeability change is induced by effective stress change, so there is no permeability stress sensitivity with stress arch ratio of 1 and equals to 0.
From the definition of the permeability modulus, permeability for different pore pressure can be expressed as Eq. (8):
In the following part, we will used the experiment date to validate Eqs. (7) and (8). Sulige gas field is located at the Ordos basin of China, and covers an area of 20000 km2. The field is large sandstone reservoir of braided river system with stratigraphic traps. He 8 and Shan 1 are the main producing formations. Statistics show that 75 % of the effective sand body is isolated, and most of the isolated sand body is produced by one well. The main shape of the reservoirs can be classified as penny shape reservoir and elliptical cylinder reservoir. The penny shape reservoirs are common in the Sulige gas field and they take amount of 70.4 %. The maximum of the stress arch ratios are 0.12 and 0.28 for elliptical cylinder reservoir and penny shape reservoir respectively [20]. The normalized permeability is defined as the ratio of the permeability for current reservoir pressure and initial permeability. The normalized permeabilities are listed as Figs. 1-3 when the stress arch ratios are 0, 0.12 and 0.28 respectively.
Fig. 1Normalized permeability K/Ki versus pressure drop ΔP for stress arching ratios γ of 0
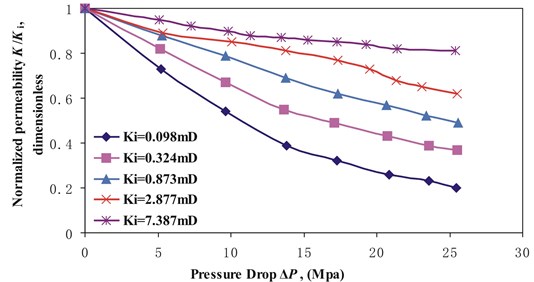
There lies in a negative exponential relationship between normalized permeability and pressure drop. The permeability modulus obtained by the experiment data and predicted by Eq. (7) are listed in Table 1.
Fig. 2Normalized permeability K/Ki versus pressure drop ΔP for stress arching ratios γ of 0.12
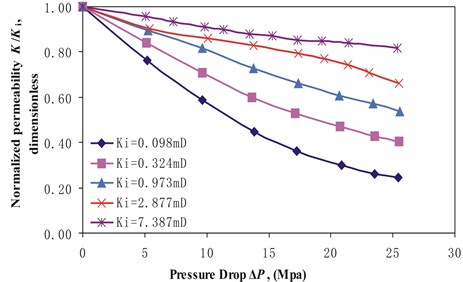
Fig. 3Normalized permeability K/Ki versus pressure drop ΔP for stress arching ratios γ of 0.28
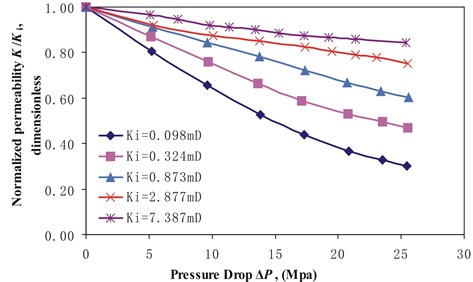
Table 1Permeability modulus of permeability for different stress arch ratios
, (mD) | |||||||
Tested | Predicted | Error, % | Tested | Predicted | Error, % | ||
0.0987 | 0.0635 | 0.057 | 0.0559 | –1.9 | 0.0483 | 0.0464 | –3.9 |
0.324 | 0.0397 | 0.0361 | 0.0349 | –3.3 | 0.0304 | 0.029 | –4.6 |
0.873 | 0.0283 | 0.0248 | 0.0249 | 0.4 | 0.0201 | 0.0207 | 3.0 |
2.877 | 0.018 | 0.0146 | 0.0158 | 8.2 | 0.0105 | 0.0131 | 24.8 |
7.387 | 0.0084 | 0.008 | 0.0074 | –7.5 | 0.0069 | 0.0061 | –11.6 |
From Table 1, the predicted values of the permeability modulus are the same as the values obtained by the experiment data. The relative error varies between –1.9 % and 24.8 % and most relative errors are small. So we can use the Eq. (7) to predict the permeability modulus if there is no experiment date for different stress arch ratios. However, this method cann’t be used if there lies no negative exponential relationship between normalized permeability and pressure drop.
3. Delivery equation for vertical fractured well with stress arch
3.1. Idealization and description of the fractured system
Yang, et al. [21] established a fracture system to simplify the calculation of the productivity of the vertical fracture well and they also used the field date to prove that their model could predict the well performance effectively. The relative error of the predict value is 8 %, which is very small. Guo, et al. [22] also used this fracture system to establish their delivery equation to calculate the absolute open flow, the result was validated by the well test date. The relative error is 2 %. Thus, we still use this fracture system to illustrate stress arch effect on the vertical gas well productivity.
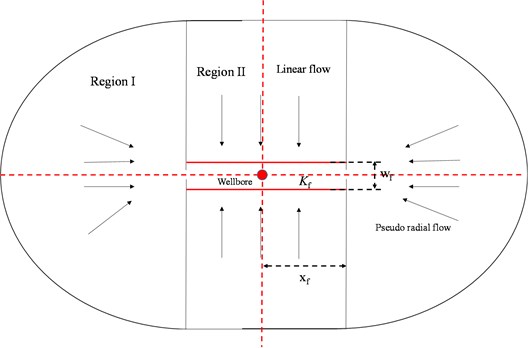
The fracture system in two dimension, illustrated in Fig. 4, has some assumptions as follows. 1) The gas producing layer with constant thickness and uniform initial permeability is bounded above and below by impermeable strata. 2) After the well is fractured, the cylindrical outer boundary is neither too near nor too far from the fracture. 3) The artificial fracture is represented by two parallel planes, which has the limited length 2 and fracture conductivity. 4) The fracture is bounded by the impermeable matrix above and below the producing layer. 5) Gravity effects are neglected, the flow behavior in the reservoir will be independent of the vertical position. 6) The reservoir can be divided into two regions, the flow patterns are different in these two regions. In region I, the flow pattern is pseudo radial flow, while it is linear flow in the region II. 7) Flow entering the wellbore comes only through the fracture. 8) The flow in the reservoir considers the stress sensitivity of permeability, while the flow in the fracture obeys high-velocity non-Darcy flow. 9) Neglect the change of the fracture permeability. 10) There is no skin near the wellbore.
Fig. 4Schematic diagram of fractured system
3.2. Model of delivery equation for the well
In region I, the flow pattern is pseudo radial flow. When the gas flow reaches the fracture, the flow obeys the high-velocity flow through fracture to wellbore. In region II, the flow pattern is linear flow. When it reaches the surface of the fracture, the flow obeys the high-velocity flow through fracture to wellbore.
3.2.1. Pseudo radial flow in region I
For steady state flow condition, Darcy’s law for the radial flow of gas can be expressed as:
where is flow velocity, m/s; is gas permeability, md; is gas viscosity, mPa∙s; is reservoir pressure, MPa; is radius at pressure of , m.
Substituting Eq. (8) into Eq. (9) gives:
where is flow rate for pseudo radial flow, m3/s; is reservoir pressure at standard conditions, MPa; is reservoir thickness, m; is compressibility factor, fraction; is compressibility factor at standard conditions, fraction; is absolute reservoir temperature, K; is absolute reservoir temperature at standard condition, K.
Let:
Eq. (10) can be written as:
where is pressure on both ends of the fracture, MPa; is gas production rate at standard conditions, m3/d; is the radius of drainage, m; is the width of the fracture, m.
In region I, the flow in fracture with non-Darcy flow effect can be represented by Forchheimer’s equation:
where gas density and flow velocity are shown in Eqs. (13) and (14) respectively:
where is fracture permeability, mD; is flow velocity in fracture, m/s; is relative density of gas, fraction; is gas density, kg/m3; is the relative molecular mass of air; is universal gas constant; is turbulent factor, m-1. , we commonly use the following equation:
Substituting Eqs. (13) and (14) into Eq. (12) yields:
where is bottom hole pressure, MPa; is radius of wellbore, m; is fracture half-length, m; is average gas compressibility factor; is average gas viscosity, mPa∙s. and are calculated by average pressure, which is the arithmetic mean between initial reservoir pressure and bottom hole pressure.
3.2.2. Linear flow in region II
In region II, the flow equation for steady state flow can be expressed as:
where is flow rate for linear flow pattern, m3/s. Based on the definition of , Eq. (17) gives:
where is the pressure for both side of fracture surface, MPa; is flow rate for linear flow pattern, m3/d.
In region II, the flow in fracture with non-Darcy flow effect can be represented by Forchheimer’s equation. Then:
So the total production rate can be expressed as:
where is the total production rate, m3/d.
3.2.3. Solution method
1) Initial reservoir and bottom hole pressure are known. Give initial , so can be calculated by Eq. (16).
2) Let:
If the absolute value of the difference between and is less than 1, , . While it is greater than 1, then . , and will be calculated until , then , .
3) Using the same method, we can get and .
4) Using Eq. (20) to calculate the total production rate.
4. Effect of stress arch on productivity of vertical fractured well
To analyze the stress arch influence on well productivity, the following basic data are needed. Reservoir thickness is 10 m; Absolute temperature is 395 K; Reservoir initial permeability is 0.324 mD; Radius of drainage area is 800 m; Radius of wellbore is 0.1 m; Fracture half-length is 200 m; Fracture width is 0. 005 m; Fracture permeability is 40 D; Relative density of gas is 0.76; Initial reservoir pressure is 31.33 MPa; Permeability modulus is 0.0397 MPa-1.
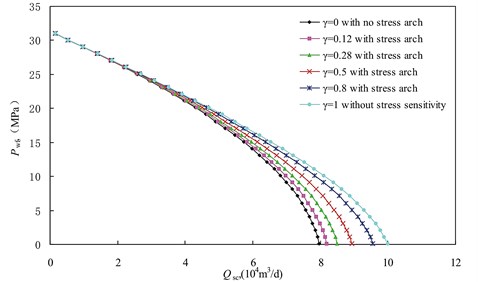
4.1. Stress arch effect on IPR curve
Fig. 5 is a series of IPR curves for different stress arch ratio. It is shown that the well production rate increase with the increasing of the stress arch ratio when the permeability modulus of 0.0397 MPa-1. Stress arch greatly impacts on well production rate for large pressure drop. When 0, the absolute open flow is the least one, and the production rate declines quickly as the bottom hole pressure decreases. While, 1, the absolute open flow is the largest one and the production rate declines slowly. Compared with the absolute open flow with stress arch ratio of 0, the absolute flow increases by 2.87 %, 6.79 %, 12.32 %, 20.12 % and 25.44 % for the stress arch ratio of 0.12, 0.28, 0.5, 0.8 and 1 respectively when equals to 0.0397 MPa-1.
Fig. 5IPR curve for different stress arching ratio with b0= 0.0397 MPa-1
For different permeability modulus , the absolute open flow for different stress arch ratio is shown in Fig. 6.
Fig. 6Qaof versus permeability modulus b0 for different stress arch ratio
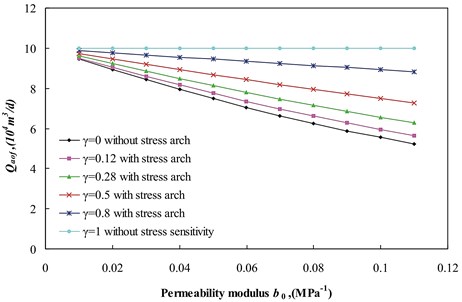
Fig. 6 shows that absolute open flow decreases with the increase in permeability modulus . Compared with the absolute open flow with no stress arch, increases by 0.67 %, 1.56 %, 2.80 %, 4.50 % and 5.63 % for the stress arch ratio of 0.12, 0.28, 0.5, 0.8 and 1 respectively when equals to 0.01 MPa-1. It increases by 7.31 %, 18.1 %, 34.88 %, 61.02 % and 79.97 % for the stress arch ratio of 0.12, 0.28, 0.5, 0.8 and 1 respectively when 1. For the same stress arch ratio, the larger the permeability modulus is, that is, the larger the permeability reduction is, the larger the increase of the absolute open flow is. It should be noted that the absolute open flow remains unchanged when stress arch ratio equals to 1 because there is no permeability change during the production.
4.2. Stress arch effect on optimum fracture half-length
Fig. 7 shows the correlation between the absolute open flow and fracture half-length at a given fracture permeability, say 40 D. increases as the fracture half-length increases until it reaches to the maximum value.
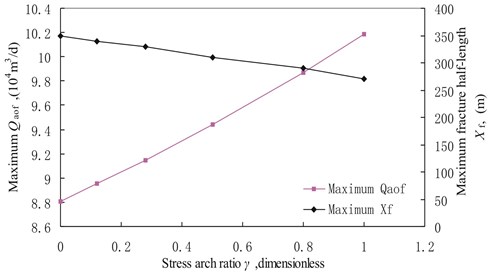
If the vertical well has the optimum fracture half-length, the is the largest one at the same stress arch ratio. Fig. 8 indicates that the maximum increases with the increase in stress arch ratio, while optimum fracture half-length decreases with increasing of stress arch ratio for the same permeability modulus . Compared with the optimum fracture half-length with no stress arch, it decreases by 2.86 %, 5.7 %, 11.43 %, 17.14 % and 22.86 % for the stress arch ratio of 0.12, 0.28, 0.5, 0.8 and 1 respectively. While the maximum increases by 1.6 %, 3.8 %, 7.16 %, 12.02 % and 15.60 % for the stress arch ratio of 0.12, 0.28, 0.5, 0.8 and 1 respectively. It means that vertical well can have large production rate with small fracture half-length and large stress arch ratio.
Fig. 7Qaof versus fracture half-length for different stress arching ratio with b0 of 0.0397 MPa-1
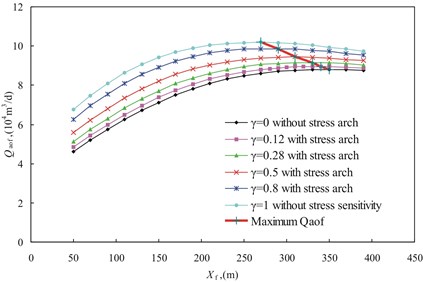
Fig. 8Maximum Qaof and maximum fracture half-length versus stress arch ratio with b0 of 0.0397 MPa-1
4.3. Stress effect on optimum fracture conductivity
Fig. 9Qaof versus Fcd for different stress arching ratio with b0 of 0.0397 MPa-1
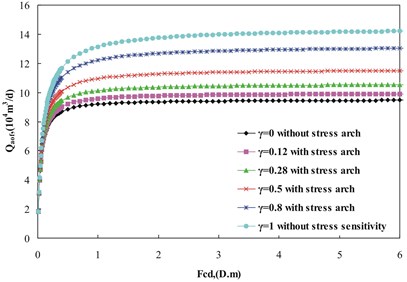
Fig. 9 shows the correlation between absolute open flow and fracture conductivity . For the same stress arch ratio, the increases as increases until it reaches the maximum value, then it remains nearly unchanged. The vertical well has maximum when the fracture has the optimum fracture conductivity. For the same , the increases with the increase in stress arch ratio.
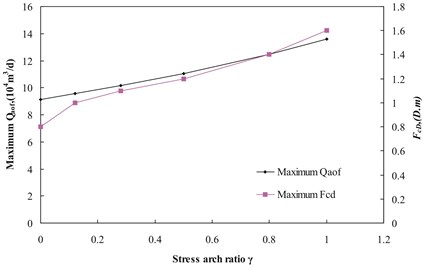
The maximum and optimum fracture conductivity both increase with the increasing of stress arch ratio. Compared with the case without stress arch, the maximum fracture conductivity increases by 100 %, while the maximum increases by 49.29 % with stress arch ratio of 1.
Fig. 10Maximum Qaof and maximum Fcd versus stress arch ratio with b0 of 0.0397 MPa-1
5. Discussion
Reservoirs are dynamic systems and they continually change during production. As the pore pressure reduces, formation permeability decreases especially for the low permeability and tight gas reservoir. Permeability modulus is used to describe the level of permeability damage. The larger the permeability modulus is, the larger the permeability reduction is. The low permeability or tight gas reservoir has large permeability modulus, which means that the rock with low permeability is more sensitive to effective stress than the rock with high permeability. The permeability modulus is relevant to stress arch ratio. Based on the definition of permeability modulus, we get an expression between permeability modulus with stress arch and permeability modulus without stress arch. There lies a linear ship between and , which is proved by the experiment data. When stress arch ratio equals to 0, there is no stress arch formed in the overburden, so . If 1, there is no stress sensitivity in the reservoir, equals to 0.
Meanwhile, a delivery equation for vertical fracture well considering stress arch effect is established. It shows that the stress arch greatly impacts on the well productivity, optimum fracture half-length and fracture conductivity. The absolute open flow increases with the increasing of the stress arch ratio for the same . The stress arch influence on the absolute open flow is also relevant to . It is more obvious when the rock has the large permeability modulus than the rock with small one. It means that stress arch has greater effect on the productivity of low permeability reservoir than that of high permeability reservoir.
The absolute open flow reaches the maximum value when the vertical well has the optimum fracture half-length for the same fracture permeability. The maximum increase with the increase in stress arch ratio, while optimum fracture half-length decreases with increasing of stress arch ratio for the same permeability modulus . So vertical well has large production rate with small fracture half-length and large stress arch ratio. The vertical well also has maximum when the fracture has the optimum fracture conductivity. The maximum and optimum fracture conductivity both increase with the increasing of stress arch ratio.
This study emphasizes that stress arch effect on stress sensitivity of permeability and well productivity. We also want to note that the level of permeability damage for low permeability and tight gas reservoir is relevant to stress arch effect. We can’t make a conclusion that the low and ultra-low permeability do exist the strongest stress sensitivity. Meanwhile we can’t neglect the stress arch effect when we design the oil and gas develop plan for the low and ultra-low permeability reservoir.
It should be noted that if stress sensitive permeability has no exponential relationship with pressure drop or effective stress change, the relationship between and may be complicated and need to be proved in the future. For thin reservoir, the horizontal stress arch ratio is larger than vertical stress arch ratio in general. So if the rock is under non hydrostatic stress condition, stress sensitive permeability is a function of stress state and stress arch ratios both in vertical and horizontal directions. And it’s more difficult to describe the relationship between and , which should also be researched in the future. Meanwhile the delivery equation used here is established on some simple assumption, which should also be improved in the future.
6. Conclusion
Based on the definition of the permeability modulus, we obtained an expression between permeability modulus considering stress arch effect () and permeability modulus without stress arch (). There lies a linear ship between and , which is proved by the experiment data. When stress arch ratio equals to 0, there is no stress arch formed in the overburden, so . If 1, there is no stress sensitivity in the reservoir, equals to 0. The rock with low initial permeability has the larger permeability modulus than that of high initial permeability.
A new delivery equation for vertical fracture well is established, and which is considered the stress arch effect. Compared with the absolute open flow with stress arch ratio of 0, the absolute flow increases by 2.87 %, 6.79 %, 12.32 %, 20.12 % and 25.44 % for the stress arch ratio of 0.12, 0.28, 0.5, 0.8 and 1 respectively when the permeability modulus equals to 0.0397 MPa-1. The increase ratio with larger is larger than that with small one.
The optimum fracture half-length is also relevant to stress arch ratio. For the same stress arch ratio, the vertical well has the maximum absolute open flow when it has the optimum fracture half-length. The maximum increase with the increase in stress arch ratio, while optimum fracture half-length decreases with increasing of stress arch ratio for the same permeability modulus . Compared with case with no stress arch, the fracture half-length reduces by 11.43 %, while the maximum increases by 7.16 % when the stress arch ratio equals to 0.5. Considering stress arch effect, vertical well can have large production rate with small half-length.
The maximum and optimum fracture conductivity both increase with the increasing of stress arch ratio. Compared with the case without stress arch, the maximum fracture conductivity increases by 50 %, while the maximum increases by 21.40 % with stress arch ratio of 0.5.
References
-
Pedrosa O. A. Pressure transient response in stress-sensitive formations. California Regional Meeting, Society of Petroleum Engineers, 1986.
-
Mckee C. R., Bumb A. C., Koenig R. A. Stress-dependent permeability and porosity of coal and other geologic formations. SPE Formation Evaluation, Vol. 3, Issue 1, 1988, p. 81-91.
-
Wu F., Sun L., He J. The research and application of permeability, porosity and net overburden pressure laws. Journal of Southwest Petroleum Institute, Vol. 21, Issue 4, 1999, p. 23-25.
-
Liu J., Liu X. The effect of effective pressure on porosity and permeability of low permeability porous media. Journal of Geomechanics, Vol. 7, Issue 1, 2001, p. 41-44.
-
Jones F. O., Owens W. W. A laboratory study of low-permeability gas sands. Journal of Petroleum Technology, Vol. 32, Issue 9, 1980, p. 1631-1640.
-
Rhett D. W., Teufel D. W. Stress dependence of matrix permeability of North Sea sandstone reservoir rock. Symposium on Rock Mechanics, Washington, 1996, p. 12-18.
-
Schutjens P. M. T. M., Hanssen T. H., Hettema M. H. H. Compaction-induced porosity permeability reduction in sandstone reservoirs. Annual Technical Conference and Exhibition, New Orleans, Louisiana, 2001, p. 1-12.
-
Wang Z., Ran Q., Tong M., et al. A new productivity calculation method of fractured gas well in tight gas reservoir. Science Technology and Engineering, Vol 13, Issue 36, 2013.
-
Xiong J., Qiu T., Guo P., et al. Production evaluation of fractured reservoirs with in in low permeability reservoir with nonlinear flow. Petroleum Drilling Techniques, Vol. 40, Issue 3, 2012, p. 92-96.
-
Soltanzadeh H., Hawkes C. D. Induced poroelastic and thermoelastic stress changes within reservoirs during fluid injection and production. Porous Media, Heat and MassTransfer, Transport and Mechanics, 2009, p. 27-57.
-
Segall P. Induced stresses due to fluid extraction from axisymmetric reservoirs. Pure and Applied Geophysics, Vol. 39, Issue 3-4, 1992, p. 535-560.
-
Schutjens P. M. T. M., Blanton T. L., Martin J. W., et al. Depletion-induced compaction of an overpressured reservoir sandstone: An experimental approach. Rock Mechanics in Petroleum Engineering, Trondheim, Norway, 1998, p. 1-15.
-
Soltanzadeh H., Hawkes C. D., Sharma J. Closed-form solutions for production- and injection-induced stresses in plane-strain reservoirs with elastic properties different from the surrounding rock. International Journal of Geomechanics, Vol. 7, Issue 5, 2007, p. 353-361.
-
Soltanzadeh H., Hawkes C. D. Semi-analytical models for stress change and fault reactivation induced by reservoir production and injection. Journal of Petroleum Science and Engineering, Vol. 60, Issue 2, 2008, p. 71-85.
-
Soltanzadeh H., Hawkes C. D., McLellan P. J., et al. Poroelastic modelling of production and injection-induced stress changes in a pinnacle reef. Proceedings of the 3rd Canus Rock Mechanics Symposium, Toronto, Canada, 2009, p. 43-51.
-
DusseaultM. B. Geomechanical challenges in petroleum reservoir exploitation. Journal of Civil Engineering, Vol. 15, Issue 4, 2011, p. 669-678.
-
Verdon J. P. Geomechanical Simulation of CO2 Injection Microseismic Monitoring and Geomechanical Modelling of CO2 Storage in Subsurface Reservoirs. Berlin, Verlag Berlin Heidelberg, 2012, p. 83-105.
-
Hawkes C. D., McLellan P. J., Bachu S. Geomechanical factors affecting geological storage of CO2 in depleted oil and gas reservoirs. Journal of Canadian Petroleum Technology, Vol. 44, Issue 10, 2005, p. 52-61.
-
Segura J. M., Fisher Q. J., Crook A. J. L., et al. Reservoir stress path characterization and its implications for fluid-flow production simulations. Petroleum Geoscience, Vol. 17, Issue 4, 2011, p. 335-344.
-
Wang F., Li X., Couples G., et al. The effect of stress arching on the permeability sensitive experiment in the su lige gas field. Vibroengineering Procedia, Vol. 2, 2013, p. 158-163.
-
Yang Z., Zhang S., Zhang X., et al. The steady-state productivity formula after fracturing for gas wells and fracturing numerical simulation. Natural Gas Industry, Vol. 23, Issue 4, 2003, p. 74-76.
-
Guo J., Luo T., Zhang J., et al. Steady-state model of gas wells after fracturing. Natural Gas Industry, Vol. 25, Issue 12, 2005, p. 95-96.
About this article

