Abstract
In the past, when performing dynamic response analysis of dams on deep overburden, the dam body and the overburden have often been discussed separately. In this paper, the overburden and the dam body are considered as a whole, and the dynamic response analysis is carried out by using a completely nonlinear dynamic analysis method. From the acceleration of the earth’s surface, the displacement of the dam, and the stress distribution of the panel, the dynamic response of the structure is shown to increase first and then decrease with increasing cover thickness, and the overburden layer thickness corresponding to the extreme point is called the critical thickness. The results obtained in this study can provide a design basis for a face rock-fill dam built on a deep overburden layer.
Highlights
- By establishing a complete 3D model, the influence of the thickness of the cover on the dynamic response of the dam is studied.
- As the thickness of the covering layer increases, the response spectrum appears to shift to the longer period, and the notable period gradually increases.
- The covering layer has a critical thickness, the whole displacement of the dam body is at its maximum.
1. Introduction
With the development of China’s economy and the implementation of western development, construction of water conservancy projects has progressed rapidly. The concrete-faced rock-fill dam has become a popular choice for the dam industry because of its good safety and economy as well as its adaptability, especially under unfavourable geological conditions [1-4]. Owing to the limitation of topography and resources, increasing number of high-face rock-fill dams are built directly on deep overburden, such as the Chahanwusu Hydropower Station in Xinjiang (dam height: 110 m, cover thickness: 46 m), the Jinchuan Hydropower Station Project (dam height: 112 m, cover thickness: 65 m), and the slope card hydropower project (dam height: 108 m, cover thickness: 100 m) [5]. In response to damage from the Zipu earthquake of magnitude 5.12, Zhao Jianming, Chen Shengshui and other scholars carried out a survey analysis [6, 7]. Relevant papers detail a series of serious consequences after the high earth-rock dam was broken. Therefore, it is necessary to perform dynamic analysis of a high earth-rockfill dam on deep overburden.
Some scholars have studied the influence of overburden thickness on seismic response. Scholars use one-dimensional equivalent linear wave method to calculate seismic reflection of homogeneous soil [8]. The surface acceleration peak can be compared to find whether the thickness of the cover will amplify the seismic wave, and the role of amplification first increases and then decreases. However, although the one-dimensional equivalent linear wave method has the advantages of clear concept and few calculations, it cannot truly reflect the propagation of seismic waves in soil [9, 10]. The larger the size of the structure on the cover layer, the greater the influence on the motion characteristics of the cover layer [11]. Therefore, the mere consideration of the overburden alone is not enough to solve complicated situations in actual engineering. In this paper, referring to the actual situation of a proposed water conservancy project in the west, dynamic response analysis of a concrete-facing rock-fill dam with different cover thicknesses is carried out by establishing a three-dimensional model [12]. To improve the accuracy of seismic wave propagation and simulate the large deformation of structures, FLAC3D software based on fast Lagrangian numerical analysis with the finite difference method was used [13, 14]. The advantage is that the permanent deformation can be calculated directly by using any nonlinear constitutive model. The seismic response analysis of the dam is explored from three aspects: the acceleration of the site, the permanent deformation of the dam body, and the safety of the seepage control body [15, 16].
2. Calculation of the model and parameters
2.1. Geometric model
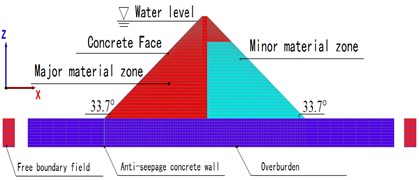
After rational simplification of the model, the dam height is 160 m, the dam axis length is 800 m, the crest width is 16 m, the upstream-to-downstream slope ratio is 1:1.5, and the left-to-right slope ratio is 1:1. The thickness of the panel is taken as 86 cm according to the formula 0.3 + 0.0035 ( is the dam height), the thickness of the impermeable wall is 1 m, the height of the water level is 128 m, and the covering layer is simplified as a rectangular horizontal foundation. In this paper, the seismic wave is filtered, and the maximum seismic frequency is 5 Hz. The maximum size of the model is calculated according to the 1/8 wave length (see Table 1). The three-dimensional shape of the dam consists of 31,340 units and 39,402 nodes (see Fig. 1). Panels, dams, and overlays are composed of hexahedral elements and a few tetrahedral elements. The soil and structure are linked by units of non-thickness contact surface, and a free boundary field is added around the cover [17, 18]. The maximal cross-section of the model is shown in Fig. 2.
Table 1Element size
Material | Maximum frequency (Hz) | Shear wave velocity (m/s) | Maximum unit size (m) |
Major material zone | 5 | 191.85 | 4.796 |
Minor material zone | 189.46 | 4.737 | |
Overburden | 201,21 | 5.030 |
Fig. 13-D finite difference mesh of dam
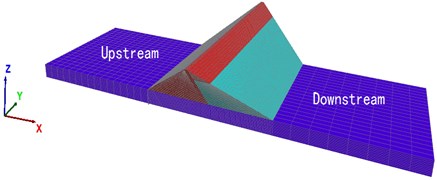
Fig. 2The maximal cross-section of CFRD
2.2. Constitutive model
In the calculation using FLAC3D, the commonly used Mohr-Coulomb plastic model is adopted for the dam body [19]. The model makes it easier to simulate the plastic shear deformation at the time of the earthquake and obtain the permanent displacement directly.
The main failure mode of a dam under earthquake is shear failure. The Mohr-Coulomb yield criterion is used. The shear yield function of the dam is:
where , , are the maximal and minimal principal stress, respectively; is cohesion; and is the internal friction angle. When 0, shear yielding appears.
Because the material properties of soil and concrete differ greatly, this paper set up interfaces characterized by Coulomb sliding and tensile and shear bonding between them [20]. The Coulomb shear strength of the tangential force () at the contact surface is [21]:
where is the cohesion along the interface; is the friction angle [degrees] of the interface surface; is the pore pressure (interpolated from the target face); is the area represented by the contact surface node. If the criterion () is satisfied, then sliding is assumed to occur, and , with the direction of shear force preserved.
During sliding, shear displacement may cause an increase in the effective normal stress on the joint, according to the relation:
where is the dilation angle [degrees] of the interface surface is the magnitude of shear force before the preceding correction is made; is the additional normal stress caused by the initialization stress; is the normal stiffness; is the shear stiffness.
By plane waves propagating upward from the foundation, a seismic wave input is represented. This solution must reduce the reflection of the waves at the boundaries. The lateral boundaries and the free-field grid are coupled through a viscous flow field. The formula for the unbalanced () force acting on the free-boundary field is as follows:
where is the density of the material along a vertical model boundary; is the p-wave speed at the side boundary when the unbalanced force is in the -direction; is the velocity (-velocity, -velocity, -velocity) of a grid point in the main grid at the side boundary; is the velocity (-velocity, -velocity, -velocity) of a grid point in the side free field; is the free-field grid point force (, , ) with contributions from the stresses (, , ) of the free-field zones around the grid point.
2.3. Material parameters
During the calculation, the rock-fill material is prone to plastic shear deformation due to earthquake, which will lead to a change in the shear modulus (). To truly simulate the property of the excavated stone material, the parameters of the shear modulus () of the dam body are set by self-defined procedures as follows:
where is the standard atmospheric pressure; is the average stress; is the dynamic shear modulus coefficient; is the dynamic shear modulus index.
The bulk modulus of rock-fill material can be calculated from the dynamic shear modulus. When the Poisson ratio is 0.3, the formula is:
The static and dynamic parameters of the dam are shown in Table 2 and Table 3, in which # 1 is the major rock-fill zone and # 2 is the minor rock-fill zone, which are obtained by experimental results [22, 23].
Table 2Static parameters of rock-fill
Number | Density / (kg·m-3) | Cohesion / (kpa) | Friction angle / (°) | Expansion angle / (°) |
#1 | 2.23 | 3.5 | 36 | 12 |
#2 | 2.2 | 3.2 | 32 | 11 |
Table 3Dynamic parameters of rock-fill
Number | Dynamic shear modulus coefficient | Dynamic shear modulus index |
#1 | 2455 | 0.619 |
#2 | 2216 | 0.467 |
The contact parameters are presented in Table 4, where #3 is the contact surface between the panel and the dam, and #4 is the contact surface between the cut-off wall and the cover [24].
Table 4Parameters of contact surface
Number | Friction angle / (°) | Cohesion / (kPa) | Normal stiffness / (kN·m-3) | Shear stiffness / (kN·m-3) |
#3 | 30 | 12 | 2.25×10⁸ | 8×10⁸ |
#4 | 43 | 23 | 3.2×10⁸ | 2.58×10⁸ |
To highlight the single factor of the overburden thickness, homogeneous sand was selected as the overburden material, with the following mechanical parameters: natural dry density of 2.2 g·cm−3, deformation modulus of 50 MPa, and friction angle of 38°. Concrete panels and cut-off walls were used as the linear elastic model, and C30, C40 concrete was used.
2.4. Earthquake time history curve
The artificial seismic wave used in the model calculation was obtained by fitting the time history curves of bedrock acceleration in the certain dam site (exceedance probability is 2 % over 100 years). First, the seismic wave is filtered and adjusted to absorb high frequencies (> 5 Hz), as shown in Fig. 3. Then, the seismic waves were input from the bottom of the overburden. Among them, the peak acceleration in the direction of the river was 0.28 g, the vertical direction was 2/3 of the line of defense along the river, and the duration of the earthquake was 20 s.
3. Calculation results and analysis
To study the effect of cover thickness on the dam, this study divides the cover thickness into ten grades: 9, 18, 27, 36, 45, 54, 63, 72, 81, 90 m.
3.1. Site dynamic response analysis
Magnification is the degree to which the structure amplifies seismic waves [25]. First, seismic waves of different acceleration peaks (0.07, 0.21, 0.28, 0.35 g) were input from the bottom of the model. Five points on the four sides and the middle of the earth surface are then selected as the measurement points (as shown in Fig. 4), and the average of five is taken as the peak acceleration of the earth’s surface. Finally, acceleration magnification is obtained by dividing the peak mean surface acceleration by the peak value of the corresponding input seismic wave (Fig. 5).
Fig. 3Input of ground acceleration curves
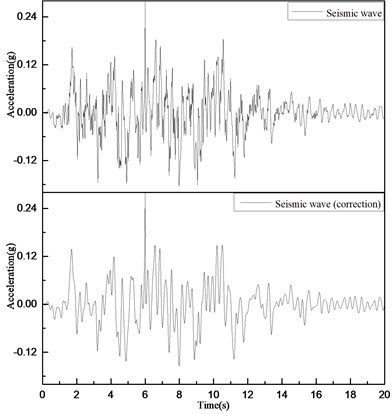
Fig. 4Surface acceleration peak value diagram
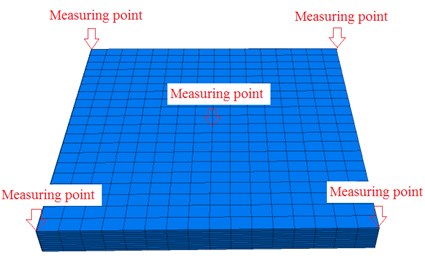
Fig. 5Site acceleration magnification
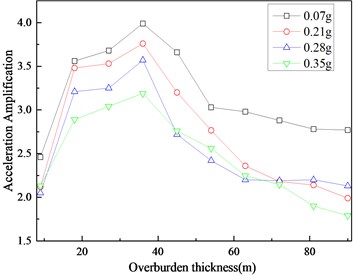
As seen in the figure, with increasing overburden thickness, the acceleration magnification tends to increase first and then decreases, and the maximal acceleration magnification corresponds to the overburden thickness of 36 m; at the same overburden thickness, the acceleration magnification decreases as the peak value of the input seismic wave increases (from 0.07 g to 0.35 g).
As a result, although there are differences in amplifying effects of overburden thickness under different earthquake intensities, the cover thickness corresponding to the extreme value of acceleration magnification is the same, and this thickness is called the critical thickness. In this case, the critical thickness is 36 m, which is 0.255 times the dam height.
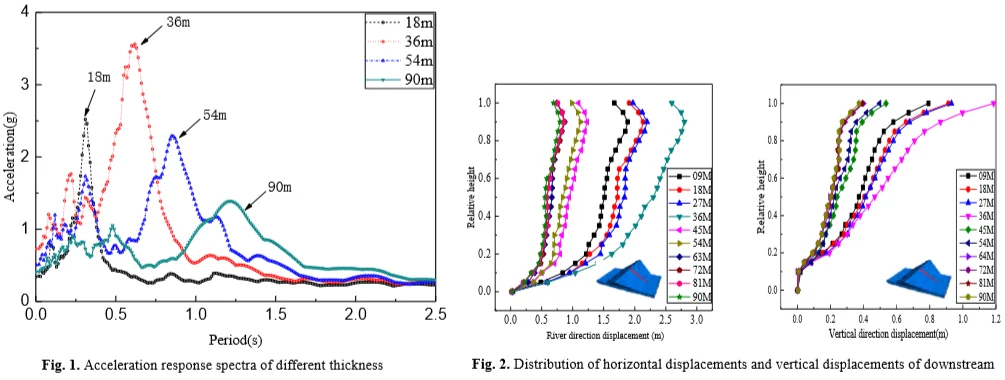
To further study the influence of the cover layer thickness on the acceleration response spectrum of the ground surface, a seismic wave with an acceleration of 0.28 g was selected as the dynamic load at the bottom of the input cover. Fig. 6 shows the acceleration response spectra (damping ratio: 5%) at the overburden thickness of 90, 54, 36, 18 m.
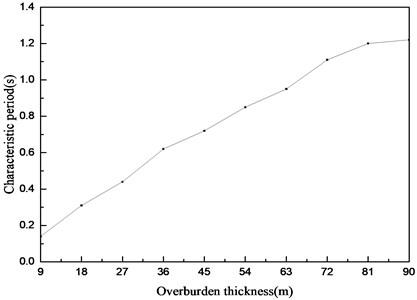
From Fig. 5, the effect of the overburden thickness on the long-period component of the acceleration response spectrum is weaker, whereas the influence on the short-period component is relatively obvious. Accompanying the increased thickness of the coating, the acceleration response spectrum appears to shift toward the long period; the characteristic periods of each thickness are arranged and plotted as shown in Fig. 7. With increasing overburden thickness from 9 m to 90 m, the characteristic period also increased from 0.14 s to 1.22 s. The trend of the characteristic period is consistent with that of the specification [26].
Fig. 6Acceleration response spectra of different thickness
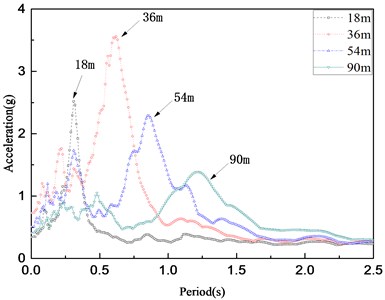
Fig. 7Effect of overburden layer thickness on the characteristic periods of response spectra
3.2. Dm body displacement analysis
The steady state of the dam slope is reflected from the permanent displacement at a specific position of the dam body. When the accumulated permanent displacement in the dam body reaches a certain degree, the dam body may be destabilized. Therefore, the permanent deformation of the dam in practical engineering is an important indicator of the seismic resistance of the earth dam [27].
To understand the overall displacement of the dam body, Fig. 8 shows the permanent displacement contour of the maximal section of the dam body with cover thickness of 18, 36, 54, 90 m, when the peak value of seismic wave acceleration is 0.28 g.
The maximal permanent displacement (2.9 m) of the dam in Fig. 4 corresponds to an overburden thickness of 39 m (see Fig. 8(b)), which is consistent with the critical thickness above; from the displacement distribution point of view, when the cover is at a critical thickness, the area of large displacement (> 0.5 m) becomes significantly larger, and the gradient of displacement becomes clear.
Fig. 8The maximal cross-sectional displacement of different overburden thickness (unit: m)
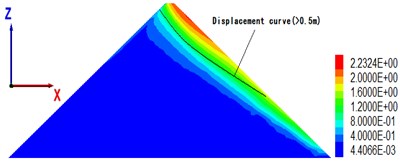
a) Overburden thickness is 18 m
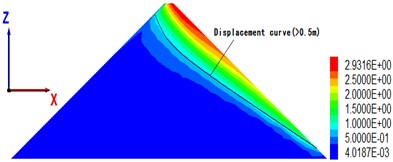
b) Overburden thickness is 36 m
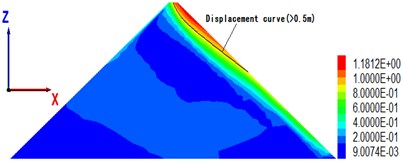
c) Overburden thickness is 54 m
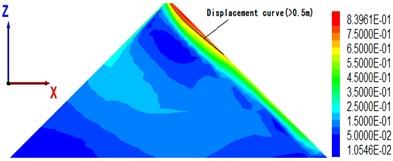
d) Overburden thickness is 90 m
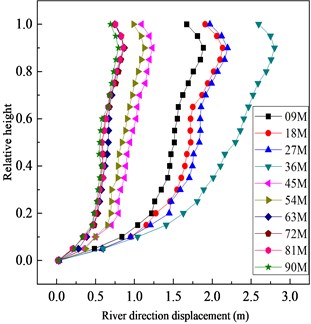
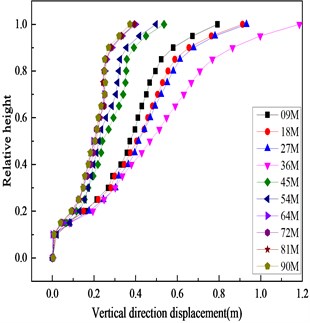
As seen in Fig. 8, the displacement of the downstream face is larger, so the downstream face is taken as the characteristic displacement point. To show the change of displacement more accurately, Fig. 9 shows the displacements of the downstream axis (-axis is 0) in the river direction (-axis direction) and the vertical direction (-axis direction) with different overburden thickness. Owing to the whipcord effect, the horizontal and vertical displacements show a significant inflection point at the relative height (9/10); as the thickness of the cover increases, the horizontal and vertical displacements of the downstream face first increase and then decrease. Observation of the three displacement curves about overburdens of 72 ,81 and 90 m indicate that the three curves are close to the position, and the other few displacement curves are relatively dispersed. Thus, when the thickness of the overburden reaches a certain degree of displacement, the effect of displacement is weakened.
Fig. 9Distribution of horizontal displacements and vertical displacements of downstream
a)
b)
3.3. Concrete slab dynamic response analysis
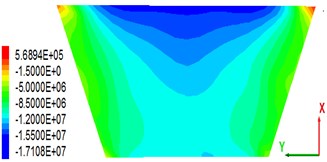
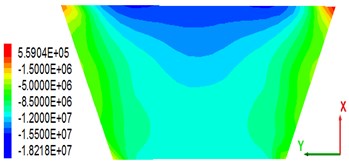
As the main anti-seepage body of CFRD, the stability of a concrete slab is of great significance. Some scholars found that the dam axial (-axis) stress in the panel after the earthquake has a close relationship with the panel stability [28]. This study analyses only the dam axial stress after the earthquake. Fig. 10 shows the stress distribution in the dam axial direction of a concrete slab under the condition that the peak value of the seismic wave is 0.28 g. From the stress distribution point of view, the panel is mainly subjected to compressive stress (negative). Owing to the permanent displacement of the dam body toward the downstream side after the earthquake ends, a wide range of compressive stress occurs in the upper part of the central panel of the dam section (close to the crest). As seen in the stress maps of the panels on the four different thickness overburdens, there is little change in the distribution of the stress diagrams of the panels, indicating that the change of the covering thickness does not have much influence on the stress distribution; the dam axial panel maximal compressive stress of 18.2 MPa corresponds to the cover thickness of 36 m. The maximal tensile stress value is 0.568 MPa, and the corresponding cover thickness is 18 m. It can be seen that the critical thickness (36 m) does not apply to the maximal tensile stress analysis.
Fig. 11 shows the maximal axial compressive-tensile stress of a concrete panel with overburden thickness from 9 m to 90 m. As with the panel stress diagram, the maximal thickness of the compressive-tensile layer is not the critical thickness (36 m). However, when the thickness of the cover is 27 m, the stress value of the panel shows the maximal value (compressive stress: 8.42 MPa, tensile stress: 0.572 MPa). This study concludes that the panel is directly connected to the cutoff wall, and the difference between the material of the cutoff wall and the soil material of the overburden leads to different amplification effects.
A comparative analysis of the critical thickness of the overlay (see Table 5). Since the acceleration magnification and permanent displacement of the dam are related to the material of the overburden and bam, their critical thickness is 36 m. The dynamic response of the concrete panel is related to the material of the anti-seepage wall. The difference in material causes the wave velocity of the seismic wave to change, so the critical thickness variation corresponding to the panel stress extreme value is 27 m. This indicates that a change in the medium that propagates the seismic wave load will result in a change in the “critical thickness”.
Fig. 10Stress distribution of the concrete panel along the dam axis after earthquakes (press is negative, unit: MPa)
a) Overburden thickness is 18 m
b) Overburden thickness is 36 m
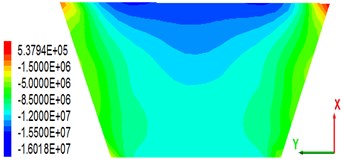
c) Overburden thickness is 54 m
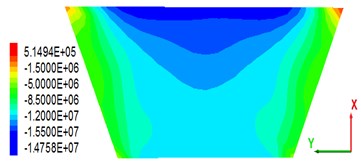
d) Overburden thickness is 90 m
Fig. 11Stress of the concrete panel of different overburden thickness along the dam axis
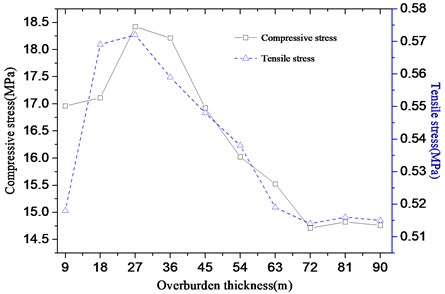
Table 5Critical thickness
Category | Extremum | Critical thickness |
Acceleration magnification | 3.55 | 36 m |
Horizontal displacements | 2.6 m | 36 m |
Vertical displacements | 1.15 m | 36 m |
Concrete panel compressive stress | 18.42 MPa | 27 m |
Concrete panel tensile stress | 0.572 MPa | 27 m |
4. Conclusions
In this paper, a three-dimensional dam model is established based on the data of a planned concrete-facing rock-fill dam in the west of China. The main conclusions are as follows:
1) The presence of overburden will affect the dynamic characteristics of the input seismic wave so that the acceleration amplitude of the ground surface increases. The overall trend is to first increase and then decrease, so the thickness of the coating corresponding to the maximal value of acceleration magnification is called the critical thickness. The geological conditions above this thickness should be exhaustively explored.
2) From the field surface acceleration response spectrum, it can be seen that as the thickness of the coating increases, the response spectrum appears to shift to the longer period, and the notable period gradually increases. In practical engineering, the characteristic period of the site should be properly adjusted to reduce damage to the superstructure.
3) When the cover is at the critical thickness, the whole displacement of the dam body is at its maximum in the range of either the numerical value or the large displacement, and it is necessary to effectively increase the antiseismic facilities and expand the antiseismic range.
4) The panel of different overburden thickness is mainly subjected to compressive stress. Owing to the difference in material properties between the impervious wall and the overburden soil, the critical thickness corresponding to the panel maximal stress is reduced. This phenomenon shows that materials have great influence on the propagation of seismic waves.
Different conditions of overburden foundation have a huge impact on the dynamic response of a concrete-faced rock-fill dam. This article considers only the single factor of overburden thickness. However, the shape and geological conditions of overburden have an impact on the rock-fill dam, both of which will be investigated in subsequent studies.
References
-
Liu J., Liu F., Kong X., et al. Large-scale shaking table model tests of aseismic measures for concrete faced rock-fill dams. Soil Dynamics and Earthquake Engineering, Vols. 61-62, Issue 3, 2014, p. 152-163.
-
Yuan L., Liu X., Wang X., et al. Seismic performance of earth-core and concrete-faced rock-fill dams by large-scale shaking table tests. Soil Dynamics and Earthquake Engineering, Vol. 56, Issue 1, 2014, p. 1-12.
-
Hongqi Fudong Technical progress on researches for the safety of high concrete-faced rockfill dams. Engineering Sciences, Vol. 2, Issue 3, 2016, p. 332-339.
-
Chen S. S., Fu Z. Z., Wei K. M., et al. Seismic responses of high concrete face rockfill dams: a case study. Water Science and Engineering, Vol. 9, Issue 3, 2016, p. 195-204.
-
Li Guo-Ying, Miao Zhe, Mi Zhan-Kuan A review of foundation condition and design scheme for seepage prevention system of high CFRD built on deep alluvium deposit. Hydro-Science and Engineering, Vol. 4, 2014, p. 1-6, (in Chinese).
-
Zhao Jian-Ming, Zahou Guo-Bin, Guan Zhi-Cheng, et al. Inspirations from 5.12 seismic damage ofzipingpu dam for aseismic measures of CFRD. Water Resources and Power, Vol. 30, Issue 1, 2012, p. 24-27, (in Chinese).
-
Chen Sheng-Shui, Huo Jia-Ping, Zhang Wei-Min Analysis of effects of “5.12” Wenchuan earthquake on Zipingpu concrete face rock-fill dam. Chinese Journal of Geotechnical Engineering, Vol. 30, Issue 6, 2008, p. 795-801, (in Chinese).
-
When Wen, Song Ting-Su, Wang Jue Effects of the thickness of overburden layer with signal homogeneous soil on peak acceleration of ground motions and platform value of the acceleration response spectrum. Journal of Seismological Research, Vol. 35, Issue 4, 2012, p. 548-554, (in Chinese).
-
Qi Wen-Hao, Bo Jing-Shan Summarization on equivalent linear method of seismic responses for soil layers. World Earthquake Engineering, Vol. 23, Issue 4, 2007, p. 221-226, (in Chinese).
-
Yang Zheng-Quan, Liu Xiao-Sheng, et al. Study on ground seismic response analysis considering structural characteristics of deep overburden layer. Journal of Hydroelectric Engineering, Vol. 34, Issue 1, 2015, p. 175-182, (in Chinese).
-
Wang Yixian, Guo Panpan, Dai Feng, Li Xian, Zhao Yanlin, Liu Yan Behavior and modeling of fiber-reinforced clay under triaxial compression by combining the superposition method with the energy-based homogenization technique. International Journal of Geomechanics, Vol. 18, Issue 12, 2018, p. 04018172.
-
Deng Ming-Jiang, Wu Liu-Yi, Fan Jin-Yong, et al. Design of dam body structure and seepage control for deep overlying strata in dam foundation of aertash hydro project. Journal of Water Resources and Architectural Engineering, Vol. 2, 2014, p. 149-155, (in Chinese).
-
Zhu Ya-Ling, Kong Xian-Jing, Zou De-Gao, et al. Effect of valley topography on dynamic response properties of high earth-rockfill dams. Chinese Journal of Geotechnical Engineering, Vol. 34, Issue 9, 2012, p. 1590-1597, (in Chinese).
-
Cheng Yu-Ming, Xu Ding-Ping Basic and Engineering Example of FLAC/FLAC3D. China Water and Power Press, 2013.
-
Zhao Jian-Ming, Wen Yan-Feng, Liu Xiao-Sheng, et al. Study of maximum aseismic capability of high earth-rock dam on deep riverbed alluviums. Rock and Soil Mechanics, Vol. 31, 2010, p. 41-47, (in Chinese).
-
Wang Yixian, Guo Panpan, Ren Weixin, Yuan Bingxiang, Yuan Haiping Laboratory investigation on strength characteristics of expansive soil treated with jute fiber reinforcement. International Journal of Geomechanics, Vol. 17, Issue 11, 2017, p. 04017101.
-
Saeed Maleki-Jebeli, Mahmoud Mosavi-Mashhadi, Mostafa Baghani A large deformation hybrid isogeometric-finite element method applied to cohesive interface contact/debonding. Computer Methods in Applied Mechanics and Engineering, Vol. 330, Issue 1, 2018, p. 395-414.
-
Wood D. M. Geotechnical Modelling. Spon Press, 2004.
-
Jia N., Yao Y., Yang Y., et al. Analysis of two-dimensional contact problems considering surface effect. International Journal of Solids and Structures, Vol. 125, 2017, p. 172-183.
-
Zhu Ya-Ling, Kong Xian-Jing, Zou De-Gao, et al. Dynamic response and failure mechanism of high earth-rockfill dams. Chinese Journal of Geotechnical Engineering, Vol. 28, Issue 9, 2010, p. 1362-1367, (in Chinese).
-
FLAC3D. Fast Lagrangian Analysis of Continua in 3 Dimensions, User’s Manual. Itasca Consulting Group, 2005.
-
He Jiang Study on the calculating parameter of the static numerical model on the contact surface of CFRD. Jilin Water Resources, Vol. 6, 2017, p. 11-13, (in Chinese).
-
Kong X. J., Lou S. L., Degao Zou, Jia G. X. The equivalent dynamic shear modulus and equivalent damping ratio of rockfill material for dam. Journal of Hydraulic Engineering, Vol. 8, 2001, p. 20-25, (in Chinese).
-
Poursartip B., Fathi A., Kallivokas L. F. Seismic wave amplification by topographic features: a parametric study. Soil Dynamics and Earthquake Engineering, Vol. 92, 2017, p. 503-527.
-
Specifications for Seismic Design of Hydraulic Structures, JTJ004-89. China Electric Power Press, 2001.
-
Chen Sheng-Shui, Li Guo-Ying, Fu Zhong-Zhi Safety criteria and limit resistance capacity of high earth-rock dams subjected to earthquakes. Chinese Journal of Geotechnical Engineering, Vol. 29, Issue 11, 2007, p. 1604-1610, (in Chinese).
-
Kong Xian-Jing, Zhang Yu, Zou De-Gao Study on the stress distribution characteristics of face-slab of high concrete-face rock-fill dam. Journal of Hydraulic Engineering, Vol. 44, Issue 6, 2013, p. 631-639, (in Chinese).
-
Yu G., Mi W., Wang D., et al. Research on the relationship between the surface dynamic subsidence and overburden separated strata of coal mine and its model. Procedia Engineering, Vol. 191, 2017, p. 196-205.
Cited by
About this article

The project has been supported by the Natural Science Foundation of China (51409076, 51774107).
