Abstract
This paper deals with the earthquake response and effect of adjacent structures founded at different depths. In this paper, the dynamic time history analyses were performed using structural analysis program developed in this research, both the structure and the soil were represented by plane stress or plane strain elements, with response quantities to be interpreted from the stresses obtained at element centers. The elasticity modulus of the ground is varied. Just like the modification of elasticity modulus, the varying relations of inertia have a strong influence on the section forces within the structures. Two structures with different foundation depths and the same foundation levels were represented by the three different systems. The interaction of the proposed method and programs was demonstrated and discussed with numerical examples. As a result, the greatest difference between two structures could be observed in the shallow and deep foundations. Concerning the plane stress model, the calculation of section forces reveals that the greatest difference was also in the shallow and deep foundations. If case of both structures having shallow foundations, the interaction was small and negligible. If one structure is shallow and the other one deep, then the interaction renders the forces in one structure 20 % smaller than those in a single shallow structure, If the adjacent structures have the same deep foundation level, then due to interaction the forces in one structure are 25 % larger than those in a single deep structure.
1. Introduction
The seismic response of structures is known to be strongly influenced by the soil systems on which they are founded. This soil-structure interaction itself depends on many different variables [1-3]. One of these influence factors is the interaction between adjacent structures. The depths of foundation obviously play a major role in this case. It is known that the interaction effects between adjacent structures can cause either magnification or reduction of the earthquake energy, based on the specific reflections and refractions of the incoming seismic waves. The literature on soil-structure interaction provides reviews on the strengths and limitations of the various techniques for modeling the seismic response of major structures. For vibratory motion with simple mode shapes, spring-mass models are considered to be adequate. For low-rise structures, trigonometric shape functions have been recommended [4-7].
In order to investigate Effect of soil conditions on the response of reinforced concrete tall structures to Near-Fault Earthquakes (NFE), Galal and Naimi evaluated the seismic performance of a 20-storey and a 6-storey RC frame structures with fixed-base and flexible-base conditions [8]. It is concluded that Soil-Structure Interaction (SSI) effects could vary significantly according to the characteristics of the NFE record, the scaling criterion and the seismic performance indicator representing the SSI.
In this research, by developing some generic RC frame models supporting on flexible foundations, effects of stiffness and strength of the structure on force reduction factors are evaluated for different relative stiffnesses between the structure and the supporting soil. The results indicated that the foundation flexibility could significantly change the response reduction factors of the system and neglecting this phenomenon may lead to erroneous conclusions in the prediction of seismic performance of flexibly supported RC.
For the analysis of the SSI from an instrumented building response, Zaicenco and Alkaz made the long-term project for seismic instrumentation of a 16-storey reinforced concrete cast-in-place dwelling building [9]. The effect of SSI is clearly observed from the recorded response. SSI becomes more pronounced for higher level of ground shaking (larger magnitudes), amplifying and increasing the predominant period of the structure and slightly suppressing high frequencies on the foundation in comparison with the free-field motion.
However, these researches did not consider the interaction of different foundation levels and mostly, it were used the commercial structural analysis programs. In this paper, the dynamic time history analyses are performed using two different structural analysis programs. For program FEMAS (Finite Element Method for Static and Dynamic Analysis of Structures), developed by Harbord [10], both the structure and the supporting soil structure are modeled with frame elements. The soil is assumed to consist of granular material. In program GEMAS (Mixed Element Method for the Analysis of Shell Structures), developed in this research, both the structure and the soil are represented by plane stress or plane strain elements, with response quantities to be interpreted from the stresses obtained at element centers. In the first case, both of structures are supported by a shallow foundation, in the second case, both structures have deep foundations, and in the last case, one structure has a shallow and the other one a deep foundation. The structure is assumed to be a reinforced concrete frame and the soil dense gravel. Numerical results will be presented for the three different scenarios, each modeled with the two different computer programs. To permit a further understanding of the interaction effects, the modulus of elasticity of the soil is varied in a separate parameter study.
2. Dynamic analysis methods for structure-foundation system
To be accessible to dynamic analysis methods, a structure has to be reduced to a dynamic system which is defined by its mass, stiffness and damping. For earthquake response evaluations, the following sets of equations are solved:
where , , and are respectively the mass, damping, and stiffness matrix, is the nodal displacement vector, and is the earthquake load vector. In the time domain, Eq. (1) is traditionally solved either by direct integration or modal analyses.
In the direct integrations method, the equations of motion are integrated directly, without any prior transformation. For a modal analysis, an eigenvalue problem has to be solved first, to determine the frequencies and mode shapes of the combined system. These mode shapes are used to uncouple the equation of motion, which typically leads to a reduction of the overall solution effort. The multi degree of freedom analysis of simple linear model developed earlier can be applied to the ease of the soil-structure interaction.
The force-displacement relation is also represented in coupling Eq. (2):
where , , and – forces and displacements, and – lateral stiffness of structure on fixed base and stiffness of foundation.
Programs FEMAS and GEMAS employ modal analysis to solve the equations of motion. Structural systems can be modeled using of various structural elements such as, one-dimensional, two-dimensional, and three-dimensional elements. The program FEMAS is based on a displacement formulation at a three dimensional structural beam element. In the program GEMAS the elements of bar, area and volume are implemented in a mixed hybrid formulation. With both programs static analysis as well as dynamic calculations can be accomplished on the basis of the antwortspectrum method.
3. Soil-structure interaction analysis for three different foundation systems
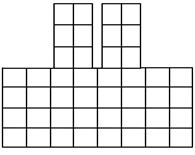
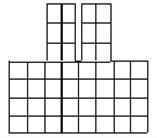
The cases studied herein are shown schematically in Fig. 1, indicating the three different foundation configurations. The case of two structures on shallow foundations Fig. 2(a) was analyzed using the three different models as shown in Fig. 2. The elastic modulus of reinforced concrete, and elastic modulus of soil (sand and gravel type), .
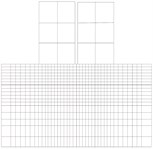
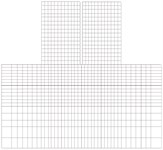
Model 1a employs one-dimensional frame elements to represent both the structure frames and the soil structure below, by arranging bars in a grid-like foundation, Fig. 2(a). The dimensions of the soil foundation included in the model were selected as , , , and , where is the width one structure, is the height of the structure and is the depth of the structure, Fig. 1. This system was analyzed by the frame analysis program FEMAS as well as by the finite element program GEMAS. Model 1b employs the same one-dimensional frame elements as model 1a to represent the structure. The soil foundation, however, is modeled with a coarse grid of 4 × 8 = 32 plane strain elements. Model 1c is identical to model 1b, except that the soil is represented by a fine mesh of 18 × 38 = 684 plane strain elements.
Fig. 1The different foundation arrangements
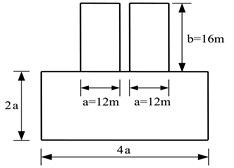
a) Shallow-shallow (SS)
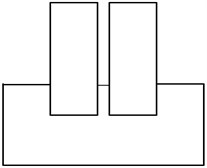
b) Deep-deep (DD)
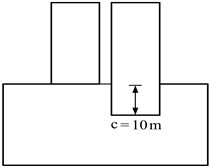
c) Shallow-deep (SD)
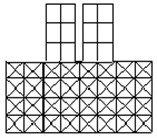
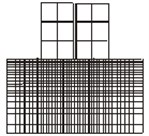
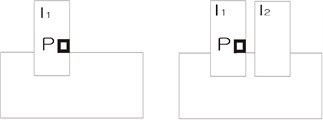
Fig. 2Analysis models
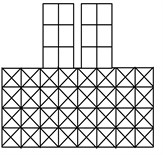
a) Model 1a (FEMAS and GEMAS)
b) Model 1b (GEMAS)
c) Model 1c (GEMAS)
d) Model 2 (GEMAS)
In model 2, the structures are represented by 12 × 16 = 192 plane strain elements and the soil by 18 × 38 = 684 plane strain elements. The floor masses were lumped as usual at the floor levels. To obtain the thickness of the plane stress elements, the combined stiffness of the structure to lateral loads was simulated by an equivalent structural wall. Model 1b, 1c, and 2 were analyzed by program GEMAS.
The following preliminary analyses were performed with model 1a. First, a static analysis of the structure for gravity loads, neglecting the soil, was performed to verify the correctness of the program and the structure model. The eigenvalue analysis provided the mode shapes and frequencies, again without the influence of the soil. Then, a time history analysis of the structure subjected to the acceleration record of the El Centro earthquake was carried out using the normal mode method. After a careful examination of the results, the eigenvalue analysis and modal time history analysis were repeated for all three variations of model 1, this time including the effect of the soil.
The first 5 frequencies for each of the 4 cases including the soil effect are summarized in Table 1.
Table 1The first frequencies of model 1 with soil effect
Mode | Comp. | Frequencies [Hz] | |||
Model 1a | Model 1b | Model 1c | |||
FEMAS | GEMAS | GEMAS | GEMAS | ||
1 | Lateral | 4.56 | 4.54 | 4.58 | 4.46 |
2 | Lateral | 13.17 | 13.16 | 13.00 | 12.98 |
3 | Vertical | 21.50 | 20.45 | 17.53 | 17.26 |
4 | Lateral | 23.23 | 23.23 | 23.06 | 23.02 |
5 | Vertical | 23.72 | 23.75 | 23.73 | 23.72 |
Table 2 indicates the contributions of the lowest modes to the total displacements as determined in the time history analysis. Note that compared with the structure deformations, soil displacements were found to be negligibly small.
The first observation of the results presented in Tables 1 and 2 is that the two computer programs give essentially the same results, as they should. When comparing the results for models 1a and 1b, it is obvious that except for the frequency at the first vertical mode, it makes little difference whether the soil is modeled with grid-like frame elements or with plane strain elements, the generally accepted way. Similarly a comparison of the results for modes 1b and 1c shows little justification for the mesh refinement of the soil.
Table 2Modal contributions to root displacement
Mode | Comp. | Modal contributions [%] | |||
Model 1a | Model 1b | Model 1c | |||
FEMAS | GEMAS | GEMAS | GEMAS | ||
1 | Lateral | 84.5 | 84.6 | 85.2 | 85.3 |
2 | Lateral | 13.0 | 12.9 | 12.6 | 12.5 |
3 | Vertical | 97 | 97.6 | 97.9 | 98.9 |
4 | Lateral | 2.4 | 2.4 | 2.1 | 2.0 |
The following Table 3 not only shows the data of node and element from the first floor but also shows the section forces , and which is data Beam and Column of building 1 and 2. They have been analyzed using the programs GEMAS and FEMAS.
The eigen oscillation types of various mesh model consist of Case 1 (model 1a, FEMAS and GEMAS 1D+1D), Case 2 (model 1b, GEMAS 1D+2D rough mesh) and Case 3 (model 1c, GEMAS 1D+2D fine mesh).
4. Frame analysis results
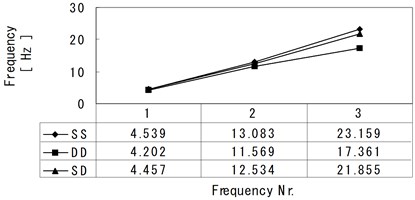
Program FEMAS was used to analyze model 1a for the three different foundation configurations shallow-shallow (SS), deep-deep (DD), and shallow-deep system (SD). The frequencies of the first three lateral modes of deformation are plotted in Fig. 3. As expected, case 3 with two deep foundations is characterized by lower frequencies, especially in the higher modes. If only one foundation is deep, frequencies are much less affected.
Comparing cases SS and DD, it is observed that the largest moment (bottom of center column) is barely affected by the depth of foundation. All other moments are increased as the foundation is deepened, even more so in the columns (up to 37 %) than in the beams (up to 19 %). By comparing the moments in the structure with one or two shallow foundations (cases SS and SD), it is observed that lowering the foundation of the neighboring structure reduces structure moments consistently, from 5.3 % to 12 %. Finally, a comparison of the moments in the structures with at least one deep foundation (cases DD and SD), shows that the lower foundation of the neighboring structure decreases moments in one column by up to 22 %, while bending moments in the other columns and beams are changed by relatively small amounts.
Table 3Section forces from beam and column of structure 1 and 2
FEMAS | GEMAS | |||||
Model 1a [FEMAS] | Model 1b [GEMAS1D+2D] | Model 1c [GEMAS1D+2D] | ||||
 |  |  | ||||
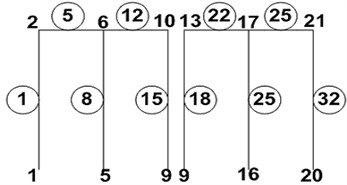 | 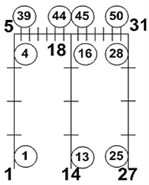 | 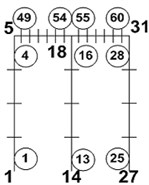 | ||||
Build 1, 2 | Element / Node | Moment [kN∙m] | Element / Node | Moment [kN∙m] | Element / Node | Moment [kN∙m] |
B1. Beam | 5/2 | 24.960 | 39/40 | 24.956 | 49/33 | 24.862 |
B1. Beam | 5/6 | 25.116 | 44/46 | 24.992 | 54/59 | 24.898 |
B1. Beam | 12/6 | 25.173 | 45/46 | 25.268 | 55/59 | 25.429 |
B1. Beam | 12/10 | 24.991 | 50/31 | 25.197 | 60/65 | 25.337 |
B2. Beam | 22/13 | 24.991 | 39/40 | 25.197 | 49/53 | 25.337 |
B2. Beam | 22/17 | 25.173 | 44/46 | 25.268 | 54/59 | 24.898 |
B2. Beam | 29/17 | 25.116 | 45/46 | 24.992 | 55/59 | 24.898 |
B2. Beam | 29/21 | 24.960 | 50/31 | 24.956 | 60/65 | 24.862 |
B1. Column | 1/1 | 19.765 | 1/1 | 19.903 | 1/1 | 19.736 |
B1. Column | 1/2 | 12.200 | 4/5 | 12.322 | 4/5 | 12.167 |
B1. Column | 8/5 | 40.547 | 13/14 | 40.746 | 13/14 | 40.835 |
B1. Column | 8/6 | 24.580 | 16/18 | 24.583 | 16/18 | 24.672 |
B1. Column | 15/9 | 19.730 | 25/27 | 20.182 | 25/27 | 20.279 |
B1. Column | 15/10 | 12.180 | 28/31 | 13.977 | 28/31 | 12.480 |
B2. Column | 18/9 | 19.736 | 1/1 | 20.184 | 1/1 | 20.279 |
B2. Column | 18/13 | 12.184 | 4/5 | 12.380 | 4/5 | 12.480 |
B2. Column | 25/16 | 40.547 | 13/14 | 40.746 | 13/14 | 40.835 |
B2. Column | 25/17 | 24.580 | 16/18 | 24.583 | 16/18 | 24.672 |
B2. Column | 32/20 | 19.765 | 25/27 | 19.903 | 25/27 | 19.736 |
B2. Column | 32/21 | 12.202 | 28/31 | 12.322 | 28/31 | 12.167 |
Fig. 3Comparison of natural frequencies of frame models
5. Plane stress analysis results
Program GEMAS was used to analyze model 2 (Fig. 2(d)), in which two structures were represented by plane stress elements. Again, the three different foundation configurations were considered.
Fig. 4The section forces of structures and the stresses of the ground in case of SS
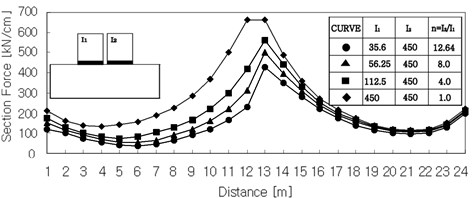
a) Horizontal section force of structure [n11]
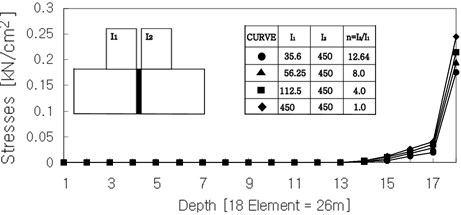
b) Stresses of vertical ground section
Fig. 4(a) shows the horizontal section force of the structures in case of shallow-shallow system. The ratio of inertia moment changes, i.e., the section forces increase with an increasing of the moment of inertia. The Fig. 4(b) shows the vertical stresses of ground in case of shallow-shallow system. That shows a sudden increase of stresses in the highest elements. These tendencies appeared analogously in other foundation types. The variation of moments of inertia, i.e., the ratio of moment of inertia of structure 1 to that of structure 2, has an influence on the section forces, as well as the modulus of elasticity of the soil. The following Table 4 shows the computed section forces n22 at the outermost right base point of the structures normalized against the corresponding value n22 computed with 35.6 m4. The tendencies are displayed in the following Fig. 5.
The shallow system shows that the section forces in increasing moment of inertial increase about 20 %. In the shallow-shallow system the section forces are almost as high as the section forces of a single shallow system. But in shallow-deep system the section forces are about 20 % lower than the section forces of the single shallow system. In case of decrease of the variation of moment of inertia, the section forces of the shallow-deep system decrease.
Fig. 5Normalized section forces at the exterior base point depending on the I2/I1 ratio (shallow-shallow system and shallow-deep system)
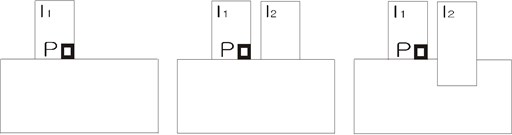
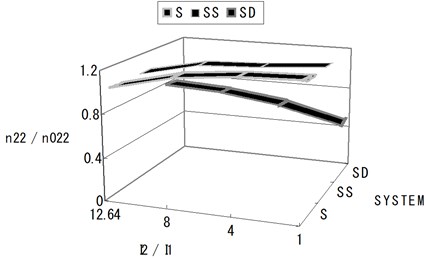
Table 4Normalized section forces at the exterior base point depending on the I2/I1 ratio (shallow-shallow system and shallow-deep system)
Nr. | n22/n022 | ||||
S | SS | SD | |||
1 | 35.6 | 12.64 | 1.000 | 1.017 | 0.781 |
2 | 56.25 | 8.0 | 1.133 | 1.141 | 0.746 |
3 | 112.5 | 6.0 | 1.187 | 1.159 | 0.662 |
4 | 450.00 | 1.0 | 1.201 | 1.199 | 0.513 |
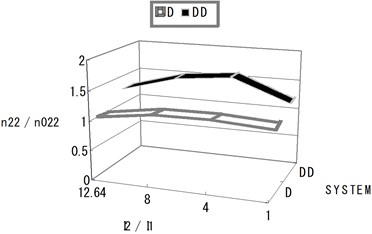
The following Fig. 6 and Table 5 show a deep system and deep-deep system. In case of two deep constructed structures the section forces are about 25 % higher than the section forces of a single deep system. As the result, Fig. 6 and Table 5 show that the influence of the interaction on a neighboring structure seems to be little in shallow-shallow system, even weak in shallow-deep system and strong in deep-deep system.
Fig. 6Normalized section forces at the exterior base point depending on the I2/I1 ratio (deep system and deep-deep system)
a)
b)
Table 5Normalized section forces at the exterior base point depending on the I2/I1 ratio (deep system and deep-deep system)
Nr. | n22/n022 | |||
D | DD | |||
1 | 35.6 | 12.64 | 1.000 | 1.267 |
2 | 56.25 | 8.0 | 1.127 | 1.528 |
3 | 112.5 | 6.0 | 1.134 | 1.620 |
4 | 450.00 | 1.0 | 1.076 | 1.234 |
6. Conclusion
This paper deals with the earthquake response of structures founded at different depths. The computations done with the frame model show that the bending moments of beam and columns differ. As a result, the greatest differences between two structures could be observed in a shallow-deep system. Concerning the plane stress model the calculation of section forces reveals that the greatest difference is also in the shallow-deep system.
The analysis of the interaction of neighboring structures with three different plane models yielded the following conclusions. If both structures have shallow foundations, the interaction is small and negligible. If one structure is shallow and the other one deep, then the interaction renders the forces in one structure 20 % smaller than those in a single shallow structure, If the neighboring structures have the same deep foundation level, then due to interaction the forces in one structure are 25 % larger than those in a single deep structure. In the second case, the weaker structure has to be reinforced. Since this premise is based on the limited results obtained from this study, further experiments and research are required that involve more parameters.
The intrinsic characteristics of the interaction effects between adjacent structures due to different foundation levels can be well captured by proposed method and program with reasonable amount of computational resources and accuracy.
References
-
Shakib H. Evaluation of dynamic eccentricity by considering soil-structure interaction: a proposal for seismic design codes. Soil Dynamics and Earthquake Engineering, Vol. 24, 2004, p. 369-378.
-
Assimaki D., Kausel E., Gazetas G. Soil-dependent topographic effects: a case study from the 1999 Athens earthquake. Earthquake Spectra, Vol. 21, Issue 4, 2005, p. 929-966.
-
Todorovska M., Rjoub Y. Effects of rainfall on soil-structure system frequency: examples based on poroelasticity and a comparison with full-scale measurements. Soil Dynamics and Earthquake Engineering, Vol. 26, 2006, p. 708-717.
-
Takewaki I. Bound of earthquake input energy to soil-structure interaction systems. Soil Dynamics and Earthquake Engineering, Vol. 25, 2005, p. 741-752.
-
Masoumi H., Degrande G., Lombaert G. Prediction of free field vibrations due to pile driving using a dynamic soil-structure interaction formulation. Soil Dynamics and Earthquake Engineering, Vol. 27, 2007, p. 126-143.
-
Soneji B., Jangid R. Influence of soil-structure interaction on the response of seismically isolated cable-stayed bridge. Soil Dynamics and Earthquake Engineering, Vol. 28, 2008, p. 245-257.
-
Li C. Effectiveness of active multiple-tuned mass dampers for asymmetric structures considering soil-structure interaction effects. The Structural Design of Tall and Special Buildings, 2010.
-
Galal K., Naimi M. Effect of soil conditions on the response of reinforced concrete tall structures to near-fault earthquakes. The Structural Design of Tall and Special Buildings, Vol. 17, Issue 3, 2008, p. 541-562.
-
Zaicenco A., Alkaz V. Analysis of the SSI from an instrumented building response. The Structural Design of Tall and Special Buildings, 2007.
-
Harbord R. FEMAS: Finite element method for static and dynamic analysis of frame structures. TU Berlin, 2004.
About this article

