Abstract
According to the disadvantages of soft landing in two impact tests, the lunar lander full scale model within the moon gravitational field and 1/6 scale model within gravity field of the earth, the passage provides a new approach for the impact test of 1/3 scale model within gravity field of the earth. Test principle and test scheme is analyzed. Scale model prototype of the lunar lander is designed. Emulated lunar soil is prepared in terms of volcanic ash as raw material, and its mechanics performance is tested. Crushing test of selected aluminum honeycomb buffer material is analyzed as well. Also the measurement requirement of the data test is analyzed. The whole test system is verified and analyzed. Test results show that the test system presented in this test could simulate the soft landing process on the moon surface by the lunar lander. The overload would arrive minimum when the lunar lander is landing along the downhill on the symmetric mode, at the same, the rigid foot pad would not apply to lunar lander.
1. Introduction
Soft landing on the surface of the moon would be the most important progress in the whole project [1]. Although the current precise navigation and point landing technology are advanced, the lunar lander still has certain risk in landing stage performance due to the particularity of the lunar surface environment, complexity and landing speed and gesture may all bring a certain degree of uncertainty. It is necessary to conduct the simulation test on the ground completely and evaluate the lunar lander soft landing buffer performance and soft landing stability before the launch. At the same time, optimization, adjustment and improvement of the lander structure would make the structure more reasonable, stable and advantageous [2].
So far, both domestic and overseas, the lunar lander landing impact test mainly has two methods. They are landing impact test by full scale model with the moon gravitational field and 1/6 scale model within earth gravity field. The main research work would focus on moon gravity field simulation during the dynamic process of soft landing. Contents of the impact test of full scale model with moon gravity field would be: Blanchard raised the pulley balance method [3] and slope method [4] to simulate the moon gravitational field in 1964 and 1969 separately; Huey [5] came up with the corresponding improvement scheme basing on the pulley balance method in 1968; in 2003, Karen [6] released the lunar probe ground test platform used for ground test soft landing of probe by NASA, in which case, the platform utilize suspension method to simulate the moon gravitational field; In 2005, Wang Shaochun [7] proposed a test method to simulate low gravity field of moon, which is also based on the simulation of pulley balance method; In 2008, Zhu Wang and Yang Jiangzhong [8] had designed a kind of aircraft landing gear shock test bench which could test the landing impact of soft landing legs of lunar lander. It is necessary for the full scale model within moon gravitational field landing impact test to have the enough room to take the test, and also it requires a lot of manpower and financial resources as well, more important, it is difficult to simulate the lunar soil and moon surface characters on the platform. The complicated movement of the model makes it hard to control during the test. Based on the above defects, Blanchard [9] presented the impact test scheme of 1/6 scale model earth gravity field according to the principle that gravity field on moon is 1/6 of that on earth. Walton [10] pointed out that this method could simulate the surface landing impact process of the full scale model within moon gravitational field accurately according to the dynamic similarity transformation. It is also difficult for the 1/6 scale model to avoid the defects within earth gravity field landing impact test. The size of the lander is small, and the landing mechanism parts have cylinder structure. After shrinkaging the scale to 1/6 smaller size of the soft landing buffer mechanism parts and buffer material aluminum honeycomb would be utilized. This could also make the thickness of the shell thinner, which would be raising the price of manufacture and the requirements of processing technology and equipment for the parts, especially the buffer material, aluminum honeycomb. So it would not be sensible for university and institute to develop the research and teaching work via the lunar lander scale model soft landing impact test.
Therefore, this research investigated the dynamics similarity principle of lander soft landing impact, and deduced similarity coefficient of the data acquired from landing impact test of 1/3 scale model within earth gravity field model and full scale model within moon gravitational field separately. Also, by using dynamics software ADAMS and DYTRAN, this research carried out the test per rigid body and soft body respectively. The accuracy of the dynamic similarity coefficient is verified by research results [11]. At the same time, this research did a lot of work on: lunar lander structural dynamics [12], soft landing dynamics [13], soft landing buffer mechanism design and reliability analysis [14-15] and soft landing cushion material [16]. On the basis of research work above, landing impact test system within earth gravity field for 1/3 scale model is designed during this research. Besides, this test system would provide simplified equipment, easier operational characters, good representativeness and strong practicability. It would also be convenient to design the critical parameters optimally. The requirements of full-scale model test site can be met, and also, complex and time consuming operation as well as highly difficult processing of 1/6 scale test model can be avoided. This test system could be used for the test work in lunar probe project in early phases, through which the landing stability and buffer performance of soft landing mechanisms of lunar lander could be investigated.
2. Soft landing impact test principle and analysis of the lunar lander test system
2.1. Test principle analysis
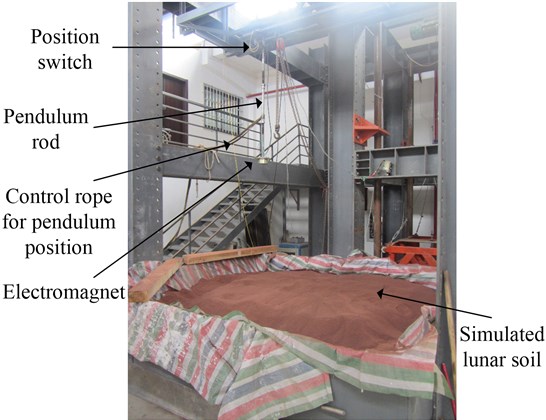
In this research, the soft landing impact test is designed to simulate the free falling body of lunar lander. The research would focus on buffer characteristics of the buffer systems and effect on the stability of the lunar lander caused by its structure. Test principle diagram is shown in Fig. 1. Fig. 2 shows the pendulum system and emulated lunar surface zone. The main purpose of this test is to make the scale model or prototype fall under a certain horizontal velocity, and also it can be called horizontal case movement. The horizontal velocity of the prototype is obtained via pendulum principle. This test uses pendulum system with one single lever. Make one of the ends of the pendulum lever hinge on the top of the frame, and hinge the other end to an electromagnet. The prototype can be drawn after the electromagnet is electrified. A steel plate on the top of the prototype would make prototype be drawn by the electromagnet tightly. Adjust the yaw angle of lander, and then connect to the electrified electromagnet. Pull the lander to position A, so that the angel between the pendulum lever and vertical direction would be . Position A is the lock position for the model and the pendulum lever, and it is also named release position. Loosen the swing position control cable, so the lander would do simple pendulum movement in the force of gravity. When the pendulum lever moves to the vertical position, which means the lander moves to the position B, the electromagnet will shut off the power by sending signal to electromagnet from position switch sensor. Position B is also called release position for model. Considering the requirement of releasing speed, this point should be the lowest point of simple pendulum movement. So the model would have only horizontal velocity rather than vertical velocity when released. Lander prototype would fall free under this velocity, and then move to position C by horizontal case movement. Position C is used as the landing position for the model.
Fig. 1Principle diagram
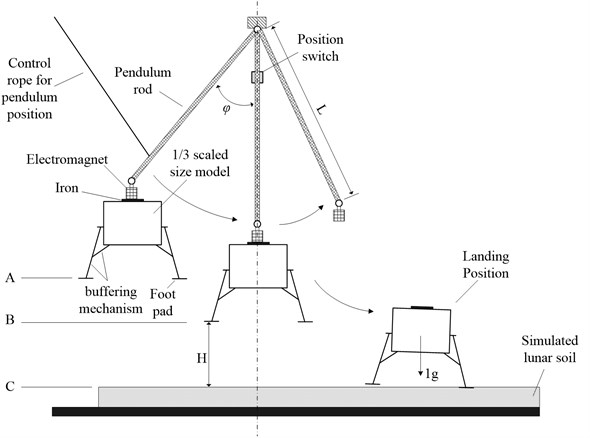
Fig. 2Pendulum system and simulated lunar surface zone
Before the test, some preparation needs to be finished. First of all, adjust the length of the lever arm according to the requirements of the vertical velocity and test platform height in the test. Then, calculate the release position (A) of simple pendulum according to the requirements of the horizontal landing velocity of the model.
For the reason that the tension of pendulum lever is always at the vertical direction of the movement rate of the model, the tension is not doing work in the movement. Thus, on the track from the release position A to release position B, only gravity works. Regardless of the mechanical friction resistance and air resistance of the pendulum lever, according to the law of conversation of the mechanical energy, the horizontal velocity of the model in release position would be:
The represents lander quality, and is the distance between A and B. The relationship between the distance from A to B and the length of pendulum lever is:
The relationship between pendulum lever length , horizontal velocity and initial pendulum angle of pendulum lever would be:
According to the relationship between required vertical drop velocity and distance from prototype to the ground, the free falling movement along vertical direction could be calculated according to the law of conservation of energy:
The relationship between vertical drop velocity and distance from prototype to the ground is:
2.2. Test system analysis
The architecture of test system is shown in Fig. 3, which includes test bench, operation platform, measurement and control system, principle prototype and installation fixture (principle prototype and installation fixture are used to assess the performance of test system). The acceleration, impact force, stress, displacement and stain etc. would be obtained dynamically in the test process. Also the signal would be analyzed respectively.
Fig. 3Architecture of lunar lander impact test system
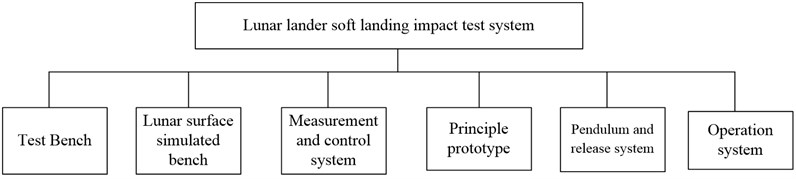
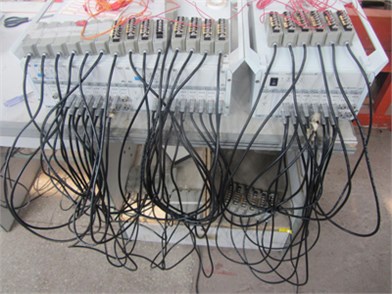
Test bench could meet the requirements of the lunar lander installation and landing test, and it could also be adjusted according to the key parameters. Operation platform shall meet the requirements of test system, test parts, test instrument safety and reliability comprehensively, and also it shall meet test personnel safety, comfort requests. Measurement and control system should implement the automatic control of the test process, and reduce the manual operation, and also improve the reliability of the test data and safety of personnel as far as possible. Test data recorded from the test process is shown in Fig. 4, and the total channel quantity is 48. The main concern in the test would be the overload at the vertical direction, acceleration response of the foot pad in three directions, impact environment and results of the universal joint connection between primary pillar and body, axial strain of the secondary pillar and buffer process of primary/secondary pillars. The dynamic signal test equipments are provided by Donghua Test. The name is DH5957 network dynamic signal testing and analysis systems, which consists of two sets of DH5957 signal test analysis instruments (32 channels + 16 channels). It is shown as Fig. 5.
Fig. 4Test data and channel constitution
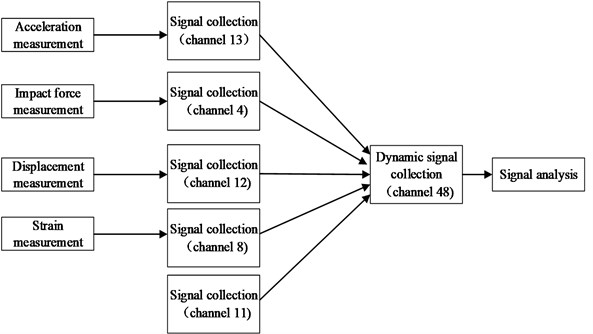
Fig. 5Dynamic signal test system
3. Design of lunar lander scale model prototype
The lander scale model prototype designed in this test utilizes the ‘plate’ structure as the main structure. Landing buffer mechanism utilizes ‘four – legs cantilever beam’ configuration. Four landing legs arranged around the lander circumferentially. Every landing leg includes the following parts: primary pillar, secondary pillar and foot pad. It is aeronautical aluminum alloy 7A09T6 that the scale model prototype and buffer mechanism utilize as the material. Buffer uses aluminum honeycomb as effective buffer material which could provide capability of energy absorption performance, light quality, space adaptive ability, high reliability etc. The virtual prototype model is shown in Fig. 6, and test physical prototype is shown in Fig. 7.
3.1. Primary pillar
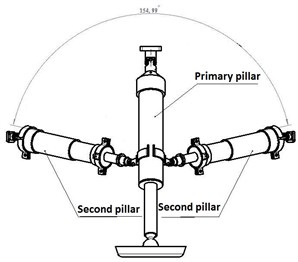
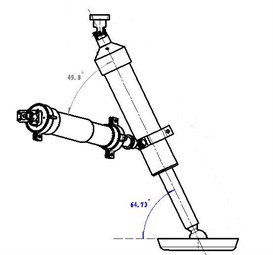
In the lunar lander scale model, every landing leg consists of one primary buffer (primary pillar) and two secondary buffers (secondary pillar) and a foot pad. The primary pillar is mainly used to buffer impact load in the vertical direction. It consists of piston cylinder and piston rod. Piston cylinder connects to the main structure of lander through universal joint. Piston rod bottom connects to the foot pad through joint and has 64° to the horizontal plane. The angle between the two secondary pillars is 155° which is shown in Fig. 8.
Fig. 6Virtual prototype schematic diagram of lunar lander 1/3 scaled model
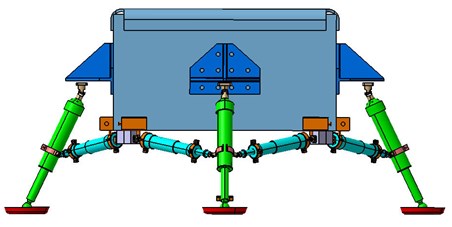
Fig. 7Physical prototype of lunar lander 1/3 scaled model
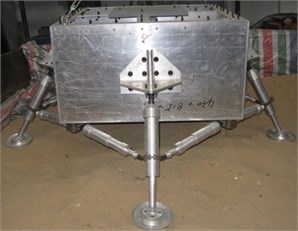
Fig. 8Buffer mechanism diagram
a)
b)
Figs. 6-8 show that the connection between the primary pillar and the body is implemented by universal joint. So is the connection between the primary pillar and secondary pillar. They are GS – 04 universal joint and GS – 01 universal joint, both of which are imported from United States by Gongnuo technology co., LTD. The bottom of primary pillar connects to the foot pad by ball joint. Apollo series of lander used the ball joint to connect primary pillar to secondary pillar. In this test, because of the tension made by secondary pillar when the lander is landing along the slope land, which would destroy the ball joint, the safer and more reliable universal joint is used. It is compressive stress between foot pad and the primary pillar piston rod, and compressive stress would not make the ball joint failure theoretically. The primary pillar piston rod would pass on the landing impact to buffer with the help of certain rotation degrees of freedom, so the ball joint connection should be used between foot pad and primary pillar piston rod.
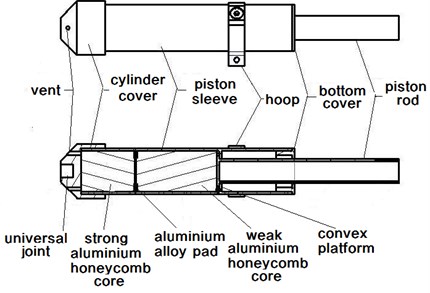
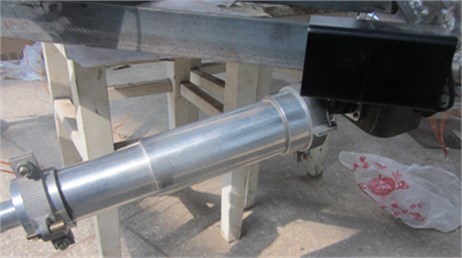
Fig. 9 shows the structure diagram of the primary pillar. The energy absorbing part of primary pillar consists of two different aluminum honeycomb core sections with different intensity, which corresponding to different honeycomb crushing load and buffering process separately, and the ratio of length from the strong to weak aluminum honeycomb core is 2:3. Considering the transitivity of the landing impact, a piece of aluminum alloy pads should be set between the strong honeycomb core and weak one, which could increase the stress area to make the load on the honeycomb appropriate. Top of the cylinder cover connects to the primary pillar universal joint (GS – 04) by screw thread. To prevent the primary buffer pillar from generating air spring effect in the process of buffer, four symmetrical vents are set on the cylinder top cover. There is a round convex platform inside of the cylinder which could limit and localize the piston rod. A hoop is set outside of the piston sleeve which would bring about two functions: one is to have connection between the two universal joint of each secondary buffer pillar (GS – 01); another function is to investigate the landing buffer performance and landing stability effected by the radius of developed landing legs, in which case the radius would be changed by the different distance between the hoop and foot pad without changing the length of primary and secondary pillar.
Fig. 9Primary pillar structure diagram
3.2. Secondary pillar
Secondary buffer (secondary pillar) has capability of both tension and compression, which is mainly used to buffer the impact of the horizontal load. The buffer material for tension or compression is also aluminum honeycomb. Fig. 10 represents the buffer structure diagram of the secondary pillar. Secondary buffer utilizes piston cylinder to tense, and compression aluminum honeycomb to buffer. At present, most of the lander secondary pillar would utilize the piston rod structure shown in Fig. 11, which is similar to the structure of primary pillar. The piston rod in primary pillar gets through the tensile aluminum honeycomb.
Fig. 10Secondary pillar structure diagram
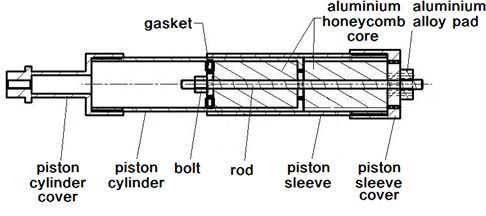
Fig. 11Piston rod style for secondary pillar structure diagram
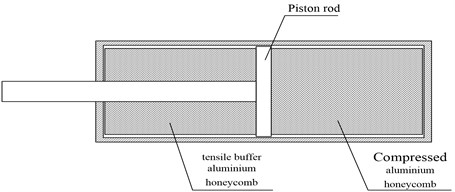
In this test, as shown in Fig. 10, the buffer structure of primary pillar is used for the following reasons: the model designed in this test is 1/3 scale model, thus the diameter of secondary pillar piston sleeve is small, so is the diameter of secondary buffer aluminum honeycomb. Processing a hollow cylinder in the center of the aluminum honeycomb of the secondary pillar for the piston rod to get through would result in the complicated processing technology and uncertain of the aluminum honeycomb shape, and at the same time, aluminum honeycomb is very likely to have deformation in the processing. In view of the above reasons, this test would use the piston sleeve structure as shown in Fig. 10. Place buffer aluminum honeycomb inside of both the piston cylinder and sleeve. The one in piston cylinder is tensile buffer aluminum honeycomb, and in the sleeve, it is compression buffer aluminum honeycomb. On the other side of the aluminum honeycomb tensile buffer, there is a circle gasket used for position limitation of the tensile aluminum honeycomb. This test uses a rod through the tensile, compression aluminum honeycomb and the gasket, and also uses bolt and block to fix the threaded connection in the two sides of the tie rod separately. The rod outside of the block uses threaded connection to universal joint (GS – 01). It is high strength alloy steel the rod material uses and the diameter would allow itself to get through the aluminum honeycomb covered circle. Piston cap would connect to the hoop on the primary pillar by screw rod. It is restrict for piston cylinder structure to locate the center of the aluminum honeycomb. In the manufacture processing of aluminum honeycomb, one of the aluminum honeycomb panel covered circle should be used as the center to be located, and then process to the shape of cylindrical. The same situation would happen in the assembly process of aluminum honeycomb which will need to get the rod through the center of covered circle.
3.3. Foot pad
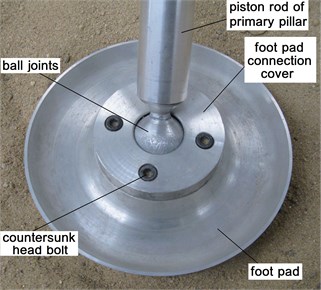
Foot pad is used to prevent the excessive subsidence of lander during instantaneous landing process, and to reduce the sliding resistance in the landing process. Foot bottom generally uses special honeycomb structure, which is used to decrease part of impact in the process of landing. Since the purpose of the experiment and test cost, honeycomb structure foot pad is not used in this test, and instead, the foot pad designed in this test is solid aluminum alloy. Foot pad is connected to the primary pillar piston rod by ball joint. Ball head of the ball joint is set into the half spherical tank of the foot pad, and the cover of the ball hinge is connected to the foot pad through four countersunk head nuts as shown in Fig. 12.
Fig. 12Foot pad diagram
3.4. Body part
The design in this test is mainly used for test of soft landing buffer mechanism, so the lander scale model body is simplified. The plate structure is used as the body part structure; main body is similar to box structure; bottom and four walls uses angel aluminum (material 7A09T6) by riveting joint. In order to reinforce the body structure, the internal structure of the four pieces aluminum plates uses angle aluminum riveting, so the internal space is divided into four grids. The reason for this design is: the convenient of manufacture process and assembly of body part; and the scale model physical prototype would be tested later and maybe more complicated. For example, the influence on the stability and landing performance by the liquid sloshing via the internal loaded simulated fuel tank. See Fig. 13 for detail.
Fig. 13Scaled size lunar lander structure diagram
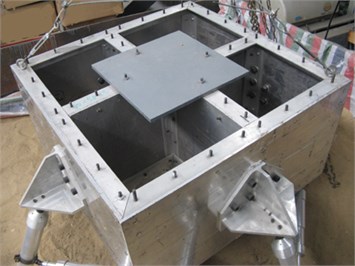
As shown in Figs. 6, 7 and 14, there are four irregular convex blocks in the four angles of the bottom plate of the prototype used to connect to the universal joint (GS – 01) on auxiliary buffer mechanism. Generally speaking, the universal joint on the auxiliary buffer mechanism would connect to the body bottom directly. The convex platform of scale model in this test is used for the following reasons: before manufacturing scale model physical prototype, the scale model virtual prototype has been developed. In the virtual prototype, the universal joint of the auxiliary buffer mechanism connects to the body bottom directly, which is studied by this test on its landing process. Movement interference is found in the landing process simulation between the auxiliary buffer mechanism sleeve and body bottom. According to preliminary analysis of the situation, the main reason comes from the piston cylinder structure of the auxiliary buffer mechanism which makes bigger size of the diameter of the auxiliary buffer mechanism sleeve comparing with the size of piston rod mechanism, so the distance between the auxiliary buffer mechanism sleeve and body bottom is small, which causes the movement interference. In order to solve this problem, in the body bottom, a convex platform is added, which connects to the universal joint on the auxiliary buffer mechanism and increases the distance between the auxiliary buffer mechanism sleeve and the body bottom. After the simulation and investigation of the soft landing process of virtual prototype, no interference phenomenon exists, which solves the movement interference problem between the auxiliary buffer mechanism sleeve and the body bottom plate.
Fig. 14Platform at the bottom of body
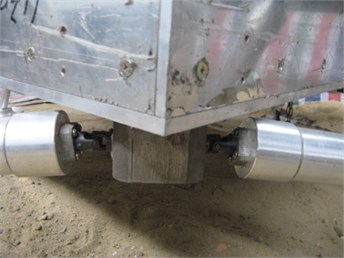
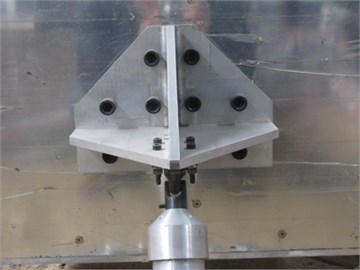
As shown in Figs. 7, 13 and 15, a link frame is arranged in every side of the symmetrical wall, and a small outside plane provides link joint to primary buffer mechanism. Connection frame is connected to the wall of body by blot riveting. Primary pillar is connected to the connection frame of body by universal joint (GS – 04). When the lander contacts the lunar surface, the force imposed on table foot from lunar surface would be transferred to the body structure through the connection between the soft landing mechanism and body structure, which means that the connection between the soft landing mechanism and body is the key load transferring components. In order to ensure the strength of the connection frame, L type beam is used to reinforce the connection between link frame and body as well as the connection between diaphragm and vertical plate. The material of connection plate and L type beam are both aluminum alloy 7A09T6. Riveting bolt is high strength bolt.
Fig. 15Connection point between primary pillar and body
4. Simulated lunar soil preparation and performance testing analysis
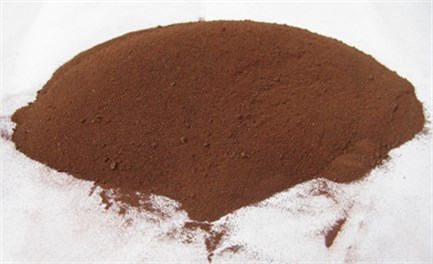
Many studies on the interaction in the process of lunar lander landing on lunar soil would request a lot of simulated soil which could simulate lunar soil’s main physical and mechanical properties. According to the research on the lunar soil of Zheng Yongchun [17], by using the tephros of Changbai mountain from Jin Yu county, Jilin province, the test in this paper prepared the lunar soil for the lunar lander scale model prototype landing impact test, and the physical and mechanical performance test analysis are also conducted. Jin Yu tephros material has obvious edge; particle size is big and uneven; density is small and not easy to compact; natural moisture content is big; there are a large number of visible pores on the tephros particles; it cannot satisfy the technical indicators, therefore it still needs to be processed and prepared. Firstly, the tephros material needs to be dried under natural air, which makes its moisture content below 2 %, then be grinded and milled by ball mill and Raymond mill. In the end, it needs to be dried again in ventilated place. Fig. 16 shows the samples of lunar soil processed accordingly.
Fig. 16Simulated lunar soil sample
4.1. Simulated lunar soil particle grading analysis
Lunar soil particle grading represents the relative content (by lunar soil quality percentage) of various grain kinds in lunar soil, which could be used to describe the distribution characteristics according to different particle size, the diameter, for example. The constitution of soil plays the decisive role in soil physical mechanical properties. In this paper, sieve analysis method based on the percussion drying machine is used to analysis the particle whose diameter is bigger than 0.075 mm. Diameter of the pore is divided into 7 grades which are: 0.075 mm, 0.1 mm, 0.25 mm, 0.5 mm, 1.0 mm, 2.0 mm, 5.0 mm. Particle size distribution curve of lunar soil diameter is shown as Fig. 17. Ordinate represents the percentage of particular soil whose diameter is smaller than the certain value over the total weight of the lunar test sample. Abscissa represents the particle size of the test lunar soil with natural logarithm for the unit. The tephros prepared to simulate the lunar mechanics performance should meet the grading requirements in Table 1. As shown in Table 1, the lunar soil used in this test meets the requirements.
Fig. 17Particle size distribution curve of simulated lunar soil diameter
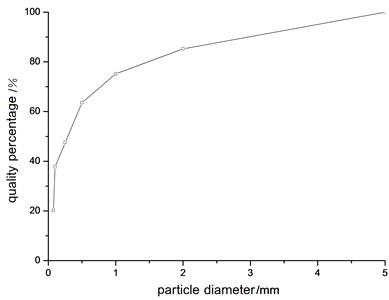
Table 1Grading requirements of the simulated lunar soil particle
Particle diameter range (mm) | <0.075 | 0.075-0.1 | 0.1-0.25 | 0.25-0.5 | 0.5-1.0 | 1.0-2.0 | 2.0-5.0 |
Standard quality percentage (%) | 20 | 17.5 | 10 | 16 | 11.5 | 10 | 15 |
Quality percentage used in real (%) | 19.6-20.4 | 17.15-17.85 | 9.8-10.2 | 15.68-16.32 | 11.27-11.73 | 9.8-10.2 | 14.7-15.3 |
Quality percentage measured in test (%) | 20.2 | 17.45 | 9.93 | 15.97 | 11.61 | 10.1 | 14.74 |
4.2. Mechanics performance test for simulated lunar soil
This paper tests five contents of the simulated lunar soil: dry density, void ratio, moisture content, the shear strength and bearing characteristics, and then compares with the requirements of the simulated lunar soil mechanics performance parameters. The results shows that the simulated lunar soil could meet the requirements of its mechanical performance parameters, and it could simulate the superficial layer of lunar soil. The test parameters are shown in Table 2.
5. Test analysis of aluminum honeycomb buffer performance
In this test, the reason that LF2Y aluminum alloy honeycomb material is used is that it shows the best capability in energy absorption, impact strength and compression strength in low speed; and also it shows relative good capability of heat conduction; and has low expense. For secondary aluminum honeycomb buffer, energy absorption portion consists of weak honeycomb and strong honeycomb which have different grades of strength. Weak honeycomb is designed to meet the requirement of absorbing the complete impact energy when the lander lands under an ideal landing velocity with ideal attitude of four legs. Strong honeycomb is designed for absorbing the bigger impact energy when the lander lands on other attitude, and it also has stronger ability to resist crash energy. And the selection of the mechanical characteristics and buffer curse of strong honeycomb and weak honeycomb need to consider the structural constraint, acceleration response and landing state, etc. comprehensively.
Table 2Test for mechanical performance parameters of simulated lunar soil
Mechanics performance type | Standard range | Tested data |
Dry density (g/cm3) | 1.36-1.65 | 1.39-1.57 |
Void ratio | 0.9-1.0 | 0.92-0.98 |
Moisture content | < 2 % | 1.17 % |
Internal friction angle (°) | 44-47 | 44.6, 46.2, 45.9 * |
Cohesion (kPa) | 0.74-1.1 | 0.92, 1.08, 0.89 * |
Compression index (MPa-1) | 0.01-0.3 | 0.17, 0.26, 0.22 * |
Bearing capacity (kPa) | 25-36 | 29.7, 23.1, 30.9 * |
* Internal friction angle, cohesion, compression index and bearing capacity are all measured from three samples. | ||
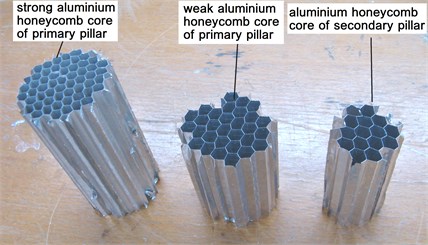
Lander prototype buffer mechanism needs three different kinds of aluminum honeycomb buffer material which have different crushing load. The difference of crushing load could be realized by different aluminum honeycomb materials which have different covered circle length. The chosen aluminum honeycomb material in this test is developed by Beijing Aerospace New Material Development Company. Aluminum honeycomb buffer material is LF2Y alloy aluminum with a hole. Aluminum honeycomb buffer material products meets the requirements in HB5443-90 standard, class II, and the node strength is 1.5 KN/m. The material provided by Beijing Aerospace New Material Technology Development Company has honeycomb plate structure shown in Fig. 18, which would meet the requirements of the buffer material that is used by the lander prototype buffer mechanism after processing and forming. The aluminum honeycomb material used by lander buffer mechanism is cylindrical. In order to keep honeycomb covered circle structure complete, the water knife would always be used to cut and process. Since the huge expensive cost of water knife process, stamping die for aluminum honeycomb forming process is used in this test. The processed lander prototype is shown as Fig. 19.
Fig. 18Raw aluminum honeycomb plate
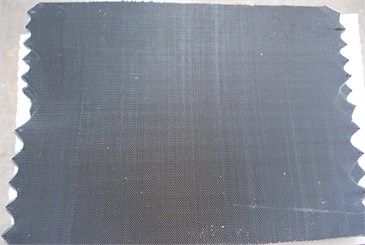
Fig. 19Processed aluminum honeycomb material for lander prototype
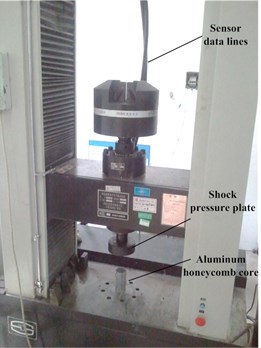
Beijing Aerospace New Material Technology Development Company provides three kinds of different crushing load theoretical value for the aluminum honeycomb, however, aluminum honeycomb material would destroy the peripheral covered circle structure inevitably for the reason of limitation means of process, therefore it is necessary to test the crush strength to measure and verify its real crushing load. This paper uses quasi-static plastic collapse stress test whose crushing rate is 100 mm per minute. The equipment is WDW – 20E microcomputer control electronic universal testing machine provided by Shijin Company in Jinan City. It is shown in Fig. 20.
Fig. 20Aluminum honeycomb quasi-static crushing test
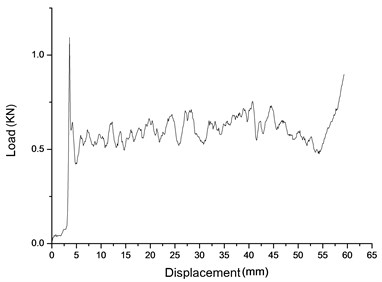
The curve measured in aluminum honeycomb quasi-static plastic collapse stress test is load – displacement curve. Fig. 21 shows load – displacement test curve of the strong honeycomb in primary pillar; Fig. 22 shows load – displacement test curve of weak honeycomb in primary pillar; Fig. 23 shows load – displacement test curve of secondary pillar honeycomb. Table 3 shows the performance parameters for the three different kinds of aluminum honeycomb.
Fig. 21Primary pillar strong honeycomb load – displacement test curve
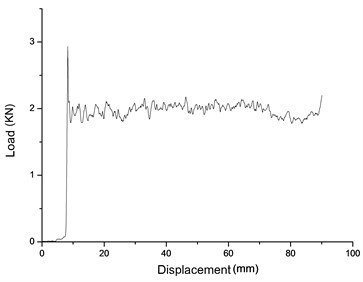
Fig. 22Primary pillar weak honeycomb load – displacement test curve
It is usually PASCAL that aluminum honeycomb of crushing load uses as the unit. Collect data from Figs. 21-23, the platform area, then use the average to estimate aluminum honeycomb buffer material crushing load preliminarily. Transfer it to pressure by equation below:
where is the pressure when aluminum honeycomb material happens to collapse. is average load of the platform area. is compressed cross-sectional area of aluminum honeycomb material.
Substitute the pressure cross-sectional area and platform area average load into Eq. (6), and then collapse pressure of plastic collapse of the aluminum honeycomb could be got. Table 3 shows different performance parameters of three kinds of aluminum honeycomb of the lander prototype.
Fig. 23Secondary pillar honeycomb load – displacement test curve

Table 3Performance parameters of aluminum honeycomb of the lander prototype
Name | Circle thickness (mm) | Circle length (mm) | Height (mm) | Diameter (mm) | Theoretical quasi-static crushing load* (MPa) | Test quasi-static crushing load (MPa) | Error |
Primary pillar strong honeycomb | 0.03 | 3 | 100 | 50.8 | 1.18 | 1.06 | –10.2 % |
Primary pillar weak honeycomb | 0.03 | 5 | 67 | 50.8 | 0.53 | 0.45 | –15 % |
Secondary pillar honeycomb | 0.03 | 4 | 67 | 37 | 0.73 | 0.675 | –7.5 % |
* Theoretical quasi-static crushing load is provided by Beijing Aerospace New Material Technology Development Company. | |||||||
As shown in Table 3, the less the covered circle length of aluminum honeycomb buffer is, the bigger the crushing load could be. The reason is that the smaller the circle length in unit area is, the bigger the quantity could be, so that the density of the aluminum honeycomb is bigger, and so is the capacity of load. The quasi-static crushing load captured in the test is smaller than the theoretical crushing load. According to the analysis, it is stamping die processing that the test uses for the aluminum honeycomb buffer material process. In die stamping process, the most outer layer of the covered circle of aluminum honeycomb would be destroyed. In other words, the external covered circle of aluminum honeycomb may not be the complete covered circle; therefore the load capacity is reduced, which results in the difference between the quasi-static crushing load recorded from the test and the theoretical quasi-static crushing load.
6. Test analysis
6.1. Force and acceleration measurement
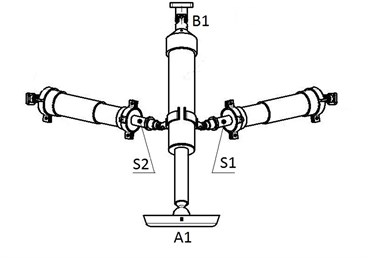
Fig. 24 lists a set of arrangement of test point for landing buffer mechanism. The whole model consists of four sets of landing buffer mechanisms, so the total test point is four times as many as the single set of landing buffer mechanism. In the test, the four sets of landing buffer mechanism have same test point positions. One of them has test point A1, A1 is test point for three direction acceleration input of the foot pad. The direction acceleration output curves of the center of the lower surface of prototype roof also need to be measured based on the machine coordinate. B1 is load test point of the universal joint of the primary pillar. The point is measured by unidirectional sensor, and the corresponding mechanical interface is provided by lander prototype. Point S1 and S2 are the test point of secondary pillar which use pasted unidirectional stain gages.
Fig. 24Arrangement of test point for landing buffer mechanism
In order to avoid the influence on the release of the lander prototype, acquisition equipment, signal conditioning equipment are all located in the lander prototype body structure, and sensors on the test points are connected by cable. The test data is recorded and obtained by analysis software. Single set of load and acceleration measurement equipments are shown as Fig. 25.
Fig. 25Single set of load and acceleration measurement equipments
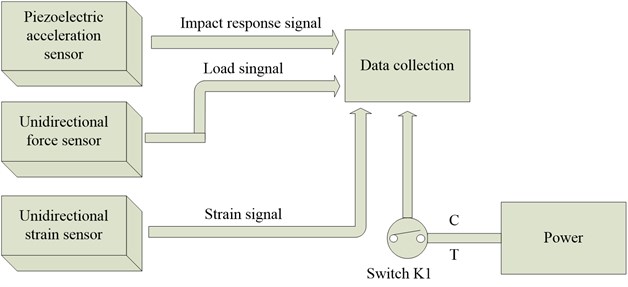
1) Unidirectional force sensor, unidirectional strain sensor
Every primary pillar has a unidirectional force sensor installed on the connection to the body, which is located in B1 as shown in Fig. 25. There are totally four sensors, the channel needs to be measured is four, which is used to capture the load response of the connection between the primary pillar and body. 5113 unidirectional force sensor used in the test is provided by First Design Institute of Astronautic, and its installation is shown as Fig. 26. Strain gauge is labeled on each rod of the secondary pillar, which is used to test the axial strain during the buffer process of secondary pillar. It is shown as Fig. 27.
2) Piezoelectric acceleration sensor
Each foot pad has one three-directional acceleration sensor installed, which is located at A1 and is used to measure the three-directional acceleration input signal. An unidirectional acceleration sensor is installed in the center of the body roof which is used to measure the vertical acceleration output of the whole body coordinate. A total of five sensors are arranged and the channel to be measured is 13 which are used to capture the landing impact response. The unidirectional acceleration sensor installed on the center of the body roof is used to test the acceleration response along the direction of gravity. It is shown as Fig. 28. Each of the four foot pads has a three-directional acceleration sensor installed, and it is shown in Fig. 29.
Fig. 26Force sensor on universal joint on primary pillar
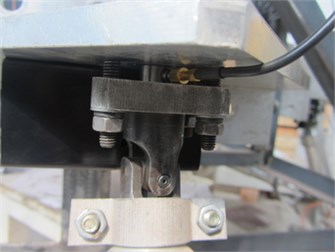
Fig. 27Strain gauge on secondary pillar
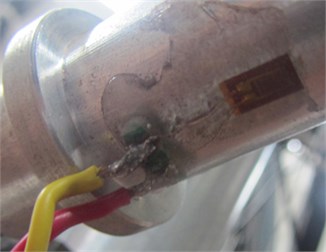
Fig. 28Acceleration sensor on the top center of body
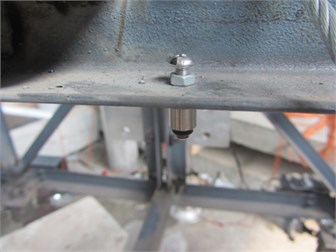
Fig. 29Three-directional acceleration sensor on foot pad
6.2. Primary/Secondary pillar buffer process test scheme
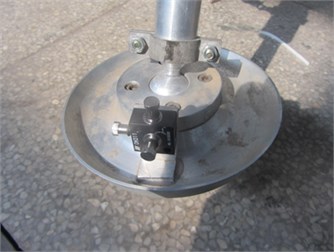
In the landing process of the lander prototype, it is necessary to measure the buffer process of each couple of the four primary/secondary pillars. Pull-wire displacement sensor could measure the buffer process of the primary/secondary pillar. Each couple of buffer mechanism needs three pull-wire displacement sensors (one for primary pillar, two for secondary pillars), four sets of buffer mechanism need 12 pull-wire displacement sensors in total, and test channel is 12 as well. Pull-wire displacement sensor is DH801 – 750 which is provided by Donghua Test. Between each primary pillar and each secondary pillar, pull-wire displacement sensor is installed, which could be used to measure the buffer compression process of the lander buffer mechanism. Fig. 30 shows the pull-wire displacement sensor installed on the primary pillar. Fig. 31 shows the pull-wire displacement sensor installed on secondary pillar.
Fig. 30Pull-wire displacement sensor on primary pillar
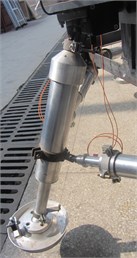
Fig. 31Pull-wire displacement sensor on secondary pillar
6.3. Release and landing location measurement of prototype
When the test prototype is released, the prototype would swing to its lowest point which is also the initial position. The distance between the earth’s gravitational acceleration direction and the intersection of the foot pad bottom center lines could be measured by tape ruler in advance. After the measurement, the distance could be controlled by adjusting the length of the swing rod, which could control the moment when the prototype arrives at the initial location. Initial pull angle of swing rod should be able to guarantee the release speed between 0.9 m/s-1.1 m/s. Initial angle could be adjusted in advance, and fixed by electromagnet. After landing, the minimum distance between the body bottom center and simulated surface has to be measured, and so do the sinking depth of four pads and gliding distance. The three parameters could be measured by steel ruler or tape ruler.
7. Verification analysis of the lunar lander scale model
After the test design, the test component needs to be manufactured. Then the test system needs to be debugged. When all the preparation work for test system has been done, some particular condition needs to be verified to test its correctness and rationality. In this test, the test condition would be like this: the lunar lander scale model and relative horizontal moon surface, and the four leg would land at the same time. This test condition would be used to test that if the system could meet the requirements of test; especially if the lunar lander scale model prototype could meet the buffer requirement. Then come up with the improvement scheme for the design of the lunar lander scale model according to the test results of the test condition. Table 4 shows the soft landing impact test condition of lunar lander.
Table 4Soft landing impact test condition of lunar lander
Landing mode | Release height (m) | Vertical speed (m/s) | Horizontal speed (m/s) | Initial Angle of pitch (°) | Touchdown sequence of landing legs | Slope on lunar surface (°) | Gravitatio-nal field |
Free fall | 1 | 4.4 | 0 | 0 | At the same time touch down | 0 | Earth |
7.1. Acceleration response analysis on top of body
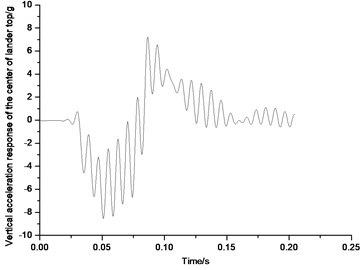
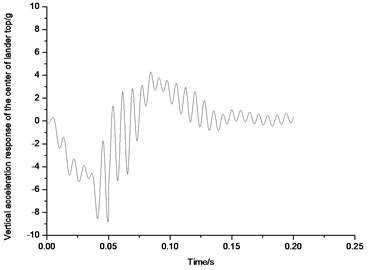
Fig. 31 shows the vertical acceleration response of the center of lander roof. The unit is g which represents gravitational acceleration. Due to the influence of high frequency response of structure, relevant result has been processed. Original results curves have been spectral processed by fast Fourier transform, and then 80 Hz frequency is used to filter the original data. The acceleration time domain curves of the center point of the body roof fluctuate sharply, and its amplitude change is not big, so the impact load is approximately 10 g. Generally, it is safe for the lander internal structure and interior instruments if the landing impact load maintains fewer than 10 g [18, 19]. As shown in Fig. 32, acceleration response of lander prototype peaks 7.4 g in 0.09 s and then attenuates. Thus, the buffer structure of lunar lander scale model could meet the buffer requirements. The buffer performance of the buffer material aluminum honeycomb also confirms that the chosen material could meet the buffer absorbing requirement in this test. According to the acceleration response of the lander body roof, both the buffer structure of the lander prototype and the buffer material meet the requirements.
Fig. 32Vertical acceleration response of the center of lander top
7.2. Force analysis of the primary pillar universal joint
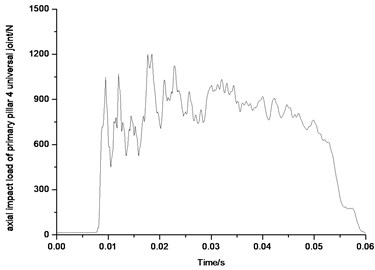
Figs. 33-36 show the force diagrams of the four primary pillars of the lunar lander scale model. Since the primary pillar would support impact load, only impact pressure is shown in the diagram. Also from 33 to from 36, the impact load peaks of four primary pillars universal joints are all more than 1200 N, in which axial impact load peak of universal joint of primary pillar 1 is 1400 N, axial impact load peak of universal joint of primary pillar 2 is 1480 N, axial impact load peak of universal joint of primary pillar 3 is 1600 N, axial impact load peak of universal joint of primary pillar 4 is 1250 N. The impact load supported by the four primary pillar universal joints happens mainly from 0.01 s to 0.05 s, and then attenuates to 0 after 0.05 s gradually. The loads on the four primary pillars is basically uniformly which correspond to the actual landing situation.
Fig. 33Axial impact load of primary pillar 1 universal joint
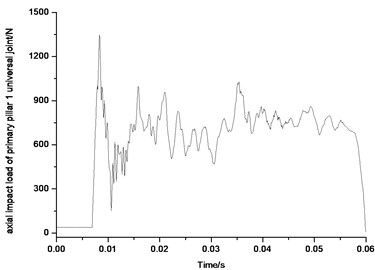
Fig. 34Axial impact load of primary pillar 2 universal joint
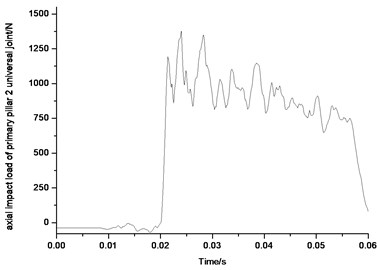
Fig. 35Axial impact load of primary pillar 3 universal joint
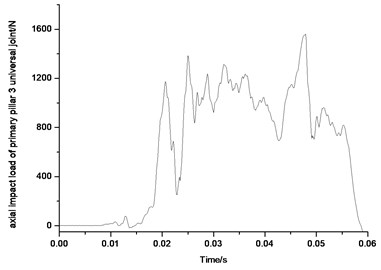
Fig. 36Axial impact load of primary pillar 4 universal joint
7.3. Buffer process analysis on the primary/secondary pillar
Figs. 37-40, four groups of buffer process diagram of lunar lander scale model prototype have been shown which include buffer process of primary pillar and buffer process of secondary pillar. Generally, buffer process of the lunar lander equals to crushing buffer capacity of aluminum honeycomb material, which could also be understood as impact energy absorption in the process of landing.
Fig. 37Buffer stroke of buffer institution 1
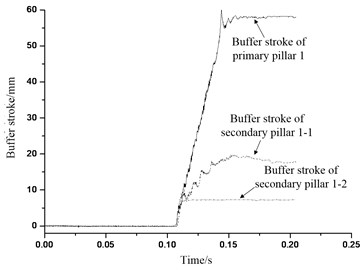
Fig. 38Buffer stroke of buffer institution 2
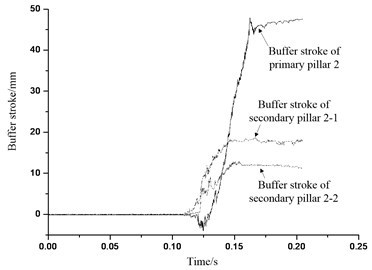
Fig. 39Buffer stroke of buffer institution 3
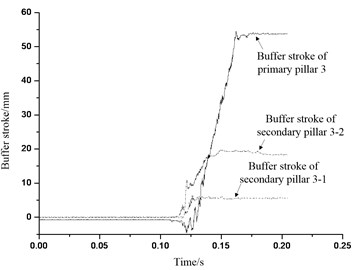
Fig. 40Buffer stroke of buffer institution 4
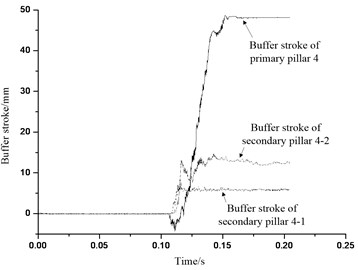
From Figs. 37-40, it can be seen that aluminum honeycomb materials of the primary pillar begins to absorb energy in 0.10 seconds. In the test, length of the primary pillar weak honeycomb is 67 mm, and the buffer process of the primary pillar 1 and primary pillar 3 are 60 mm, and buffer process of the primary pillar 2 and primary pillar 4 are 50 mm with 74.6 % deformation. According to study on the quasi-static crushing test in last chapter for the aluminum honeycomb, the maximum crushing capacity for weak honeycomb is 55 mm which means 82 % of deformation. In the buffer process of the primary pillar 1 and primary 3 aluminum honeycomb, weak honeycomb has been compressed overall to the maximum compression amount 55 mm, and then the strong honeycomb has also been compressed a little to 5 mm compression amount. After the primary 1 and primary 3 are tested and taken out, the actual value has been measured, and they are well matched. Based on the analysis above, during the process of landing with four legs landing at the same time, it can be concluded that primary pillar weak honeycomb is in crushing buffer all the time, and strong honeycomb doesn’t get deformation buffer basically. Also, according to the design requirements of lunar lander buffer mechanism and selection requirements of aluminum honeycomb buffer material: primary pillar is mainly used to absorb vertical surface landing impact load and energy, and the absorption part consists of two different aluminum honeycomb core structures with different intensity which corresponding to particular honeycomb crushing load and buffer process, and we call them weak honeycomb and strong honeycomb; Weak honeycomb design has to make the landing load and energy be absorbed exactly in ideal landing velocity with four legs landing at the same time, and strong honeycomb design is mainly used to absorb the additional impact energy in other landing gesture with certain resistance to crash energy absorption ability. Therefore, the primary pillar and aluminum honeycomb buffer material are able to meet the requirements of the test design.
From Figs. 37-40, buffer process of secondary pillar are all positive which indicates the pillar is in tensile state, thus the secondary pillar would in tensile buffer which matches the strain analysis results in last section. The lengths of secondary pillar honeycomb used in the test are all 67 mm. Table 5 shows the data statistical analysis of the secondary pillar buffer process and honeycomb buffer deformation. It is can be seen that secondary pillar tensile buffer aluminum honeycomb works for buffer functionality in landing process. When the lander is landing, along with the compression buffer is the primary pillar weak honeycomb, the center of gravity of lander will move downward, so the spreading radius of the landing legs would increase, and so does the angle between the landing legs and body, all of which would make the secondary pillar stretch longer, thus the buffer of secondary pillar would be buffer of the tensile honeycomb. According to Figs. 37-40 and Table 5, the buffer process of secondary pillar meets the actual condition of the landing situation for the lander with four legs landing at the same time.
Table 5Buffer stroke of secondary pillar and honeycomb buffer deformation
Name | Secondary pillar 1-1 | Secondary pillar 1-2 | Secondary pillar 2-1 | Secondary pillar 2-2 |
Buffer process (mm) | 19 | 8 | 18 | 12 |
Deformation (%) | 28.3 % | 11.9 % | 26.8 % | 17.9 % |
Secondary pillar 3-1 | Secondary pillar 3-2 | Secondary pillar 4-1 | Secondary pillar 4-2 | |
Buffer process (mm) | 5 | 20 | 6 | 14 |
Deformation (%) | 7.4 % | 29.8 % | 8.9 % | 20.8 % |
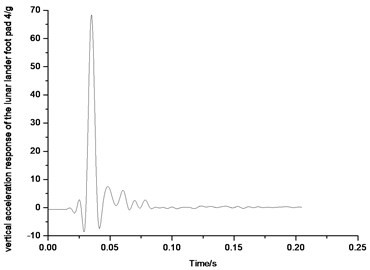
7.4. Acceleration response analysis for the foot pad
Fig. 41-44 show the diagram of the vertical acceleration response of four foot pads on the lunar lander scale prototype. The original test results have been processed by Fourier transform. The 80 Hz frequency has been chosen to filter the original data. As the figure shows, overload along with the vertical direction of the foot pad is big, and every maximum overload of the four foot pads is more than 70 g. The lander prototype foot pad designed for the test is made of aluminum alloy which could be seen as rigid body approximately. In the process of landing, foot pad is the first part to be contact with the lunar soil, so the impact would be transferred through the foot pad. The overload along with the vertical direction of the foot pad in the process of landing could be seen as a kind of physical phenomenon, which is a wide range of dynamic response of the vibration force applied from the lunar soil to foot pad. In order to avoid the larger overload of the foot pad during the landing process which would lead to the stress concentration phenomenon in the ball hinged joint connection between the foot pad and primary pillar and failure instability of the ball hinged connection, the buffer design should be considered in the foot pad structure. It is suggested to use aluminum honeycomb sandwich panel structure for foot pad bottom. In the process of impact touchdown, the aluminum honeycomb deformation could absorb the impact energy to reduce the larger overload issue of the foot pad.
Fig. 41Vertical acceleration response of the lunar lander foot pad 1
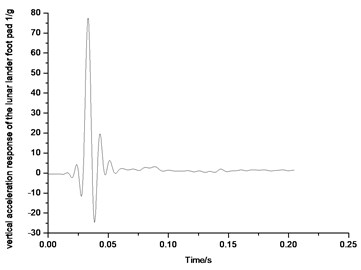
Fig. 42Vertical acceleration response of the lunar lander foot pad 2
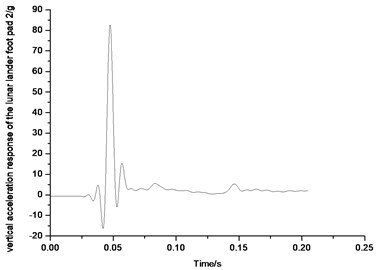
Fig. 43Vertical acceleration response of the lunar lander foot pad 3
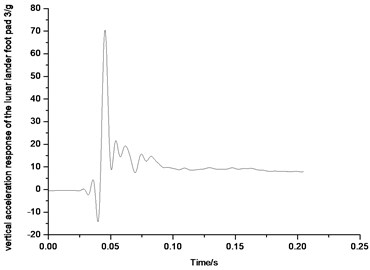
Fig. 44Vertical acceleration response of the lunar lander foot pad 4
7.5. Axial stress analysis of secondary pillar
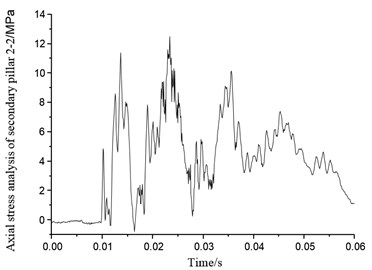
Figs. 45-52 show eight secondary pillar axial stress variation of four groups of buffering mechanism of the lunar lander scaled model. Secondary buffer pillar consists of stretching honeycomb and compression buffer honeycomb which can provide support against both axial tensile and compression impact. When the stress is positive, secondary pillar is under tensile force, so that the honeycomb buffer deformation would work as cushion. When stress goes to negative, the secondary pillar is under compression force, compression honeycomb deformation can act as a cushion as well. From Figs. 45-52, it can be seen that most of the secondary pillar stress is positive, which also means it is tension that secondary pillar mainly takes in the condition of horizontal lunar surface with four legs landing simultaneously, so tensile honeycomb deformation is the main part that resists the impact. Axial stress of secondary pillar 1-1 in buffer mechanism 1 reaches to peak 9 MPa at 0.01 second, and axial stress of secondary pillar 1-2 reaches to peak 11 MPa. Axial stress of secondary pillar 2-1 and 2-2 reach to peaks 5 MPa and 7.2 MPa separately. Peak axial stress of secondary pillar 3-1 in buffer mechanism 3 is 8.1 MPa, which means it only has little stress change, on the other hand, peak axial stress of secondary pillar 3-2 reaches to 12 MPa which reflects quite obvious change. Though axial peak stress of secondary pillar 4-1 of buffer mechanism 4 reaches to 15 MPa, it falls down to round 3 MPa after 0.025 s. Axial stress of secondary pillar 4-2 reaches up to 13 MPa which fluctuates drastically. On the analysis of above, axial stress of secondary pillar matches the real landing situation on lunar surface in which four legs touch down simultaneously.
Fig. 45Axial stress of secondary pillar 1-1
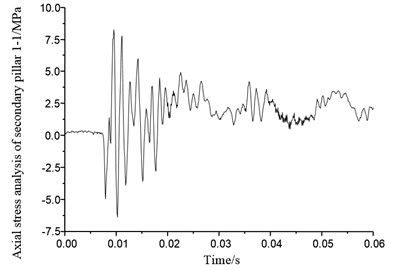
Fig. 46Axial stress of secondary pillar 1-2
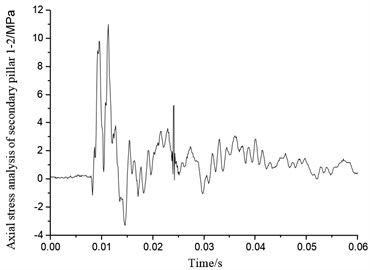
Fig. 47Axial stress of secondary pillar 2-1
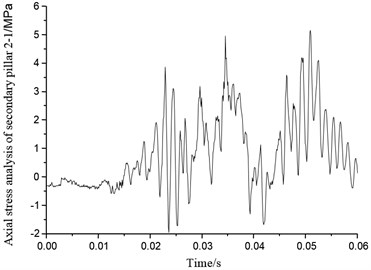
Fig. 48Axial stress of secondary pillar 2-2
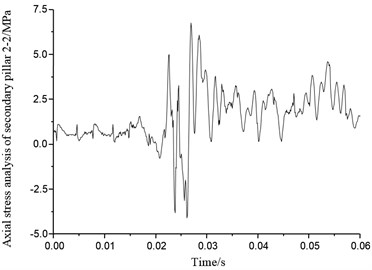
Fig. 49Axial stress of secondary pillar 3-1
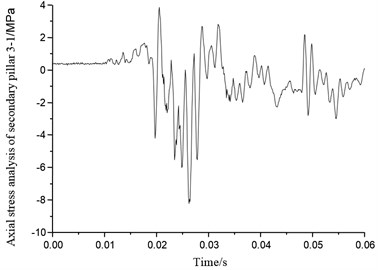
Fig. 50Axial stress of secondary pillar 3-2
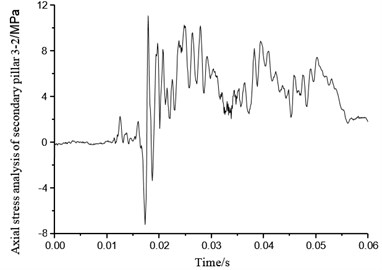
Fig. 51Axial stress of secondary pillar 4-1
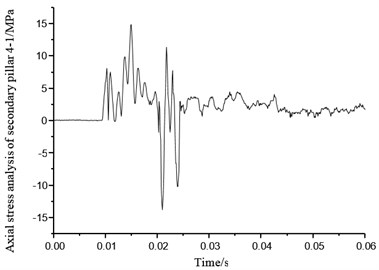
Fig. 52Axial stress of secondary pillar 2-2
8. Coupling effect analysis of the soft landing performance caused by the lunar terrain and yaw angle
This test conducts the soft landing impact test system for lunar lander scale model, and studies 6 kinds of typical soft landing conditions for the lander in three different typical terrains. On the basis of not being destructed and unstable, the vertical acceleration response of the top center of the body has been tested. Both lunar terrain and lunar lander yaw angle has been considered in the analysis of soft landing performance. And the lander’s yaw angles are typical 0° and (2-2 landing mode) and 45° (the 1-2-1 landing mode) respectively.
This analysis uses three typical lunar terrains: level lunar surface; slope terrain on lunar surface (horizontal velocity of lander along with the lunar surface); downhill terrain on lunar surface (horizontal velocity of lunar lander along with downhill terrain). In each terrain, the lunar lander landing legs uses 2-2 and 1-2-1 symmetric modes to land on moon. Thus there are 6 kinds of soft landing conditions. Fig. 53 and 54 show the 2-2 and 1-2-1 landing conditions of the lander along the uphill, and the other two kinds of terrains are similar with that in uphill. 6 soft landing conditions initial parameters of lunar lander are shown in Table 6.
Fig. 53Landing conditions of the lander along the uphill as 2-2
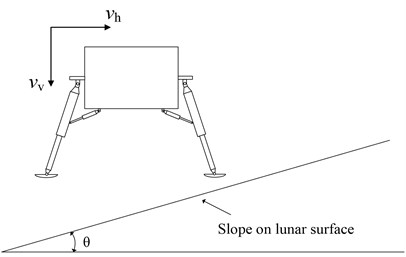
Fig. 54Landing conditions of the lander along the uphill as 1-2-1
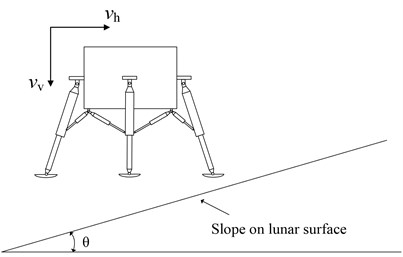
Table 6Initial parameters in soft landing conditions
Release height (m) | Horizontal velocity (m/s) | Initial angle of pitch (°) | Slope on lunar surface (°) | Gravitational field |
1 | 1 | 0 | 9 | earth |
8.1. Landing impact analysis on level terrain on lunar surface
Fig. 55 shows the vertical acceleration response on the top center of the lunar lander landing on the level lunar surface in 2-2 mode. Given that the influence of high frequency response of the structure, the test results are disposed, and the original curves have been disposed too by fast Fourier transform. 80 Hz frequency is used to filter the wave. Also, all the following measured acceleration response data are disposed by 80 Hz filter. Fig. 56 shows the vertical acceleration response on the top center of the lunar lander landing on the level lunar surface in 1-2-1 mode.
From Fig. 55 and 56, it can be seen that when the lunar lander lands on lunar surface in 2-2 mode, the maximum of acceleration response on the top center of the body would be approximate 6.5 g; when the lunar lander lands on lunar surface in 1-2-1 symmetric mode, the acceleration response on the top center of the body would be approximate 5.3 g. Thus, when the lunar lander lands on level lunar surface, 1-2-1 mode would have smaller peak value than that in 2-2 mode which would lead to a better buffer performance. That’s the reason that 1-2-1 mode is a better recommendation.
Fig. 55Vertical acceleration response of the top center of body in 2-2 mode
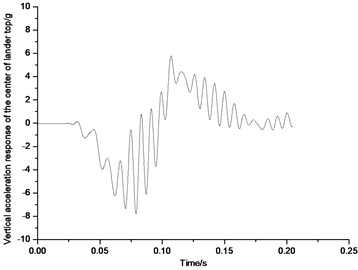
Fig. 56Vertical acceleration response of the top center of body in 1-2-1 mode
8.2. Landing impact analysis on the uphill terrain on lunar surface
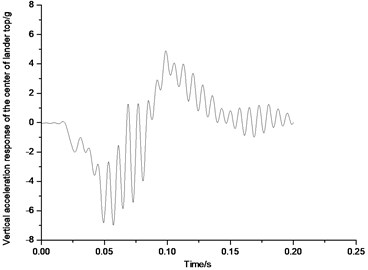
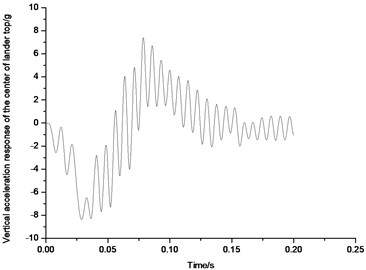
Fig. 57 and 58 show the acceleration response on the top center of the lunar lander landing on the uphill lunar surface in 2-2 mode and 1-2-1 symmetric mode. From Fig. 57, it can be seen that when the lunar lander lands on uphill lunar surface in 2-2 mode, the maximum of acceleration response on the top center of the body would be approximate 8.6 g; And from Fig. 58, when the lunar lander lands on uphill lunar surface in 1-2-1 symmetric mode, the maximum acceleration response on the top center of the body would be approximate 7.7 g. Thus, when the lunar lander lands on uphill lunar surface, 1-2-1 mode would have smaller peak value than that in 2-2 mode. That’s the reason that 1-2-1 mode is a better recommendation in uphill lunar surface.
Fig. 57Acceleration response of the top center of body in 2-2 mode
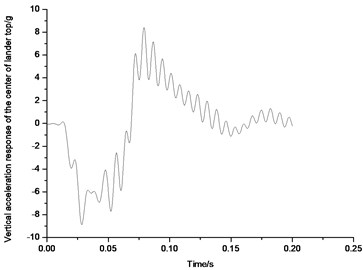
Fig. 58Acceleration response of the top center of body in 1-2-1 mode
8.3. Landing impact analysis on the downhill terrain on lunar surface
Fig. 59 and 60 show the acceleration response on the top center of the lunar lander landing on the downhill lunar surface in 2-2 symmetric mode and 1-2-1 symmetric mode. From Fig. 59, it can be seen that when the lunar lander lands on downhill lunar surface in 2-2 mode, the maximum of acceleration response on the top center of the body would be approximate 5.1 g; And from Fig. 60, when the lunar lander lands on downhill lunar surface in 1-2-1 symmetric mode, the maximum acceleration response on the top center of the body would be approximate 4.3 g. Thus, when the lunar lander lands on downhill lunar surface, 1-2-1 mode would have smaller peak value than that in 2-2 mode. That’s why 1-2-1 mode is a better recommendation in uphill lunar surface.
Fig. 59Acceleration response of the top center of body in 2-2 mode
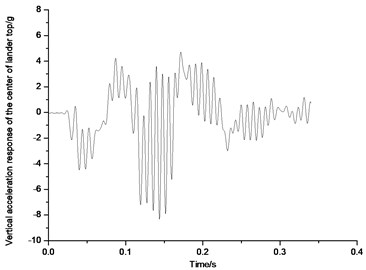
Fig. 60Acceleration response of the top center of body in 1-2-1 mode
9. Conclusion
In this paper, a set of dynamic test system has been developed for testing soft landing impact; a lunar lander scale model prototype has been designed according to a certain type of lunar lander; simulated lunar soil has been conducted by tephros; parameters adjustment and verification test have been completed for the scale lander and also tested the soft landing impact. The results of the study show that:
1) The test system could simulate the soft landing process of the lander completely; the simulated lunar soil conducted in this test could simulate shallow soil of lunar surface; the scale lander designed in this test has stable and smooth landing and buffer performance, also the overload is less than the safety index.
2) Rigid foot pad has huge impact overload during landing process; it is suggested to use aluminum honeycomb sandwich panel structure for the foot bottom; in the touchdown impact, the aluminum honeycomb deformation would absorb the impact energy partially to reduce the overload of foot pad and resolve this problem.
3) The overload of body would be smaller if the lander uses 1-2-1 symmetric mode rather than 2-2 mode; the overload has the lowest value when lander moves along the downhill direction, and level surface would have medium value, and the maximum would appear in the uphill direction. Therefore, moving along downhill of lunar surface with 1-2-1 mode would lead to the best situation.
References
-
Ulysse J. Blancbard Evaluation of a full-scale lunar-gravity simulator by comparison of landing-impact tests of a full-scale and a 1/6-scale model. NASA TN D-4474.
-
Chu Gui-Bo Lunar probe technology. Beijing, China Science and Technology Press, 2007, p. 2-13.
-
Blanchard U. J. Characteristics of a lunar landing configuration having various multiple-leg landing-gear arrangements. NASA-TN-D-2027 64N14981.
-
Blanchard U. J. Full-scale dynamic landing-impact investigation of a prototype lunar module landing gear. NASA TN D-5029.
-
Huey D. C., Robert W. H., George W. B. Technique for the simulation of lunar and planetary gravitational fields including pilot model studies. NASA TN D-2415.
-
Karen E. J. A survey of research performed at NASA Langley research center's impact dynamic research facility. AIAA 2003-1896.
-
Wang Shaochun, Deng Zongquan, Hu Ming, et al. An experimental method for simulating lunar lander low gravitation landing. Journal of Shanghai Jiaotong University, Vol. 39, Issue 6, 2005, p. 989-992, (in Chinese).
-
Zhu Wang, Yang Jianzhong Modeling and simulation of landing leg for the lunar landing gear system. Journal of Astronautics, Vol. 29, Issue 6, 2008, p. 1723-1728, (in Chinese).
-
Blancbard U. J. Model investigation of technique for conducting full-scale landing-impact tests at simulated lunar gravity. NASA TN D-2586.
-
Walton W. C., Here R. W., Leonard H. W. Studies of touchdown stability for lunar landing vehicles. J. Spacecraft, Vol. 1, Issue 5, 1964, p. 552-556.
-
Wan Junlin Investigation on the soft-landing dynamics for lunar lander and the key technologies. Nanjing, Nanjing University of Aeronautics and Astronautics, 2010.
-
Jinbao Chen, Hong Nie, Zemei Zhang, Lichun Li Finite element linear static structural analysis and modal analysis for Lunar Lander. Journal of Vibroengineering, Vol. 16, Issue 1, 2014, p. 399-406.
-
Wang Anliu Investigation on the soft-landing dynamics and semi-active control for Lunar Lander. Nanjing, Nanjing University of Aeronautics and Astronautics, 2012.
-
Qing Lin, Hong Nie, Jie Ren, et al. Investigation on design and reliability analysis of a new deployable and lockable mechanism. Acta Astronautica, Vol. 73, Issue 9, 2013, p. 183-192.
-
Lin Qing, Nie Hong, Chen Jinbao, et al. Design and deploying kinematic analysis of a new deployable and lockable soft-landing mechanism. J. Astronaut, Vol. 32, Issue 5, 2011, p. 975-981, (in Chinese).
-
Ying Zhang Analysis and research of buffer materials of the Lunar Lander soft landing system. Nanjing, Nanjing University of Aeronautics and Astronautics, 2008.
-
Zheng Yongchun Development of lunar soil stimulants and characteristics of microwave radiation of lunar regolith. Institute of Geochemistry Chinese Academy of Sciences, 2005.
-
Sperling F. B. The surveyor shock absorber. AIAA N50-17368.
-
Taylor I. Investigation of the application of airbag to provide soft landing. AIAA Aerodynamic Decelerator Systems Technology Conference and Seminar, Boston, New Jersey, 2001, p. 2001-2045.
About this article

