Abstract
Strong wave-induced currents frequently develop at Haeundae Beach, Korea. Rip currents at the beach have threatened safety of swimmers in water. Near-shore currents at Haeundae Beach during a high wave time were measured on 4 June 2008 by using drogues equipped with GPS. The current field during measurement period showed westward flow along shoreline. Major driving force of the measured currents is thought to be the wave-induced force, and the tide-induced force was the second important driving force at the time. The wave-induced current field at the time is quantitatively described by using a numerical modelling system CST3D which adopts rearrangement of driving wave-induced forces, and the PESM for computation of advection terms. The computed wave-induced current field agrees reasonably well with the drogue measurements. The numerical model predicts development of rip current around the beach centre for S wave case, the result of which could be used for warning of possible rip current development at the site.
1. Introduction
Numerical modelling of wave-induced current involves two elements, i.e. the element for providing external driving force distribution due to wave-induced radiation stress gradients, and the element for modelling flow at coastal region which includes surf zone and shallow water.
Wave-induced external forces are obtained in either a wave-period-average manner or a wave-phase-resolving manner.
Wave-period-average manner usually solves computation of non-reflective wave field. Variety of numerical methods of this manner has been developed. SWAN [1], and STWAVE [2] simulate wave transformation by solving wave action balance equation on spectral domain.
Wave-phase-resolving manner is again classified into semi-depth-integrated approach or fully three-dimensional computational fluid dynamics (CFD) approach. The latter CFD approach has not been used for simulation of coastal wave-induced current at real field of complicated geography which involves heavy computational load, while Kolokythas and Dimas [3] three-dimensionally simulated alongshore current over a constant slope bed by using “large wave simulation”.
Mild-slope equations or Boussinesq equations are typical semi-depth-integrated, wave-phase-resolving methods, and provides driving force field for partially-reflected waves [4-6]. However, this time-consuming wave-phase-resolving manner need not be used for simulation of coastal wave-induced current where wave reflection is not significant.
Wave-induced flow-driving forces are highly concentrated around surf zone between breaker line and shoreline. Discontinuity exists in the driving forces across the breaker, and horizontal and vertical turbulent mixings are also strong within surf zone due to wave breaking. When cross-shore flow or sediment transport in a vertical domain is of interest, an adequate tool is required to express the vertical mixing effect [7]. When horizontal flow or circulation is of interest, horizontal turbulent eddy viscosity distribution is required for simulation. In this study, we concentrate on simulation of plane circulation around pocket-shaped Haeundae Beach. Longuet-Higgins [8] assumed that horizontal turbulent eddy viscosity is proportional to the distance from shoreline and square-root of the water depth, and obtained good agreement between his theory and measured alongshore flow profile. Later Kim [9] introduced an engineering method of driving force smoothing to replace the horizontal eddy viscosity, which makes use of the grid number resolving the surf zone width. Kim’s approach was successfully applied to alongshore current experiments of a straight beach, and a detached breakwater. Cui and Tang [10] summed up individual radiation stresses deduced from the parabolic mild-slope equation for numerical study of random-wave-induced current at Leadbetter Beach. Theoretical and field studies on turbulence characteristics due to wave breaking, and engineering methodology to incorporate them in modelling procedure is still ongoing [11-12].
Modelling wave-induced current flow at coastal zone is a special computational fluid dynamics (CFD) area. Coastal area has relatively shallow water depth, and mild-sloped seabed. Water level gradient is also mostly very small. There have been trials to simulate wave-induced current field in a general horizontal two-dimensional domain [13-14], which solve depth-average continuity and momentum equations, and are considered more general than 1-line or N-line model types. O’Connor et al. grouped long-term wave conditions at a site into two representative wave conditions, and applied their numerical model system to the site. Two different wave directions produced much different wave-induced current patterns, which explained seasonal bathymetric change at the site.
To obtain three-dimensional flow information, fixed z-grid, or moving sigma-grid in the vertical direction has been used, see existing packages like EFDC [15], DELFT3D [16], ADCIRC [17]. The sigma-grid has shown strong merit to handle coastal flows at shallow water depth.
The governing momentum equations in Eulerian form include advection terms, dispersion terms, and other terms like pressure gradient terms and momentum source or sink terms. Numerical schemes for advection equation, and dispersion equation could be separately described.
Dispersion equation has been relatively satisfactorily solved by using the FTCS scheme, the ADI scheme, or the Crank-Nicolson scheme, confining our interest to the finite difference method.
On the other hand, solving advection equation is accompanied by inevitable numerical diffusion. Advection schemes include the upwind scheme, the Lax-Wendroff scheme [18], the TVD scheme [19]. Some Lagrangian techniques, e.g. MAC method [20-21], have been adopted within Eulerian grid system to mitigate this problem. Trials are ongoing to reduce the numerical diffusion during solution of advection equation. PESM method was proposed by Kim et al. [22], which improved accuracy and stability of the upwind scheme for two and three-dimensional domains.
In this study a recently developed numerical model system, CST3D, is used. The system adopts the SWAN module for computation of the wave field at the site, the method of spreading wave breaking-induced driving force of Kim, and the PESM to compute advection equation.
Haeundae Beach is a 80 m wide, 1.5 km long, sandy beach in south-east Korea. Shoreline of the beach has been in almost equilibrium state for long time until about 2000, but has seriously retreated since then. Even in equilibrium state the shoreline proceeds and retreats repeatedly, depending on seasonal offshore wave climate. National and regional governments are trying to recover the shoreline to the original place for live tourism and protection of onshore territory. Another issue exists in relation to the beach, i.e. occasional unpredictable rip currents develop around the coast, and threaten swimmer’s safety.
Haeundae Beach has a pocket shape, and most part of the shore is mildly circular. The beach faces the open sea in the south-east direction on a coarse scale, while it faces the sea in the south direction on a fine scale, see Fig. 1.
Bed material at the beach is mostly sand. Median diameter of the bed material at the beach is between 270 and 640 μm, average median diameter is about 300 μm, and it is poorly sorted with average sorting of 1.4 Ф. The median diameter of bed grain size gets smaller as the water deepens across shoreline. Some parts of the beach are covered with rocks.
Fig. 1Map of study area, Haeundae beach
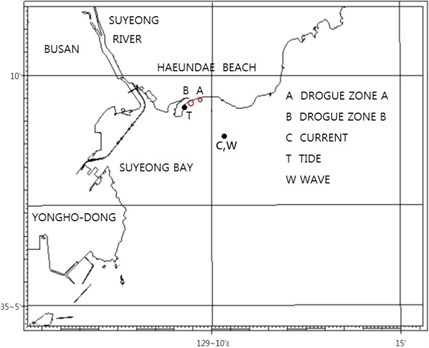
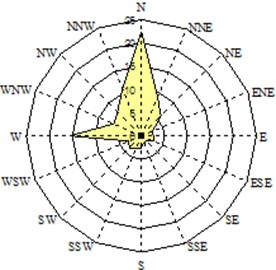
Waves penetrate into the beach from S, SE, and E. Waves from W or SW are blocked by Yongho-Dong (Fig. 1). S waves are common in summer season, and SE waves are common in winter season, see Fig. 2. High waves generate strong wave-induced alongshore current, and cause significant morphological change of the beach.
Fig. 2Seasonal wave characteristics – wave height and direction
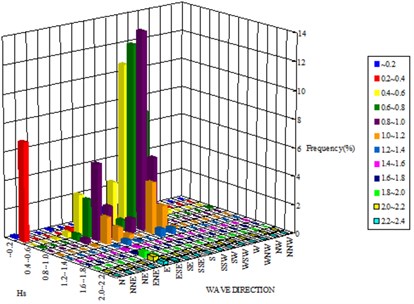
a) Summer season (29 June 2007 – 6 August 2007)
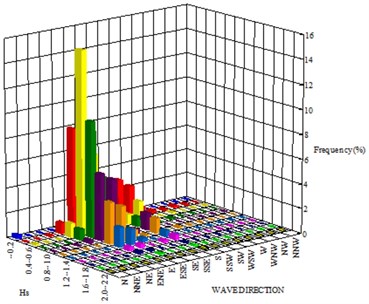
b) Winter season (2 October 2007 – 12 November 2007)
Haeundae Coast has a mean tidal range of 1.3 m, and the maximum tidal current speed during mean tidal range period is about 20 cm/s at 20 m water depth, see Busan City [23]. Even though tidal current near the beach is not strong, it is believed that the tidal system affects movement of fine bed material, and contributes to formation of long-term morphological equilibrium at the site.
Winds from N or NW are strong during winter, and don’t much influence hydrodynamics at the beach, while winds from S or SE during summer season take important roles on morphological change at the beach. Fig. 3 shows wind roses at two specific seasons: N wind is dominant in winter. Occasionally strong wind develops during typhoons at this area.
Normally the wave-induced current at the coast is expected in western direction for E or SE incident waves, and eastward direction for S incident waves. No waves from W approach Haeundae Beach due to its geography. The circulation pattern around the beach sometimes includes complicated rip currents. The reasons for that may include asymmetric plane geography, and non-smooth non-erodible rocky bed around the beach, see Fig. 1. Rocky bed surface at shallow area doesn’t allow erosion, but rocky surface temporarily allows sand deposition at calm condition.
Fig. 3Seasonal wind characteristics-wind speed and direction water
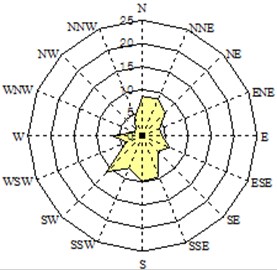
a) Summer season (1 June 2007 – 27 June 2007)
b) Winter season (28 September 2007 – 31 October 2007)
Sophisticated and comprehensive measurements have not yet been systematically undertaken at the site to understand characteristics of the wave-induced current at the site. Sand budget needs to be studied in parallel by surveying of sediment fluxes across boundary lines of the study domain to foresee long term bathymetric change of the beach. It will also provide a clue about the fate of artificially-nourished sand along the beach.
Accurate prediction of the bathymetric change of the beach requires accurate prediction of the flow field including the wave-induced current and tidal current prior to computation of sediment transport. Forecasting of the rip current strength and location is also important for swimmers to get early warning of floating away from the shore.
Like other coastal zones many external forces may drive the current of a specific time at Haeundae Beach. The forces include tidal force, wave-induced force, wind-induced force, and storm surge-induced force. Tidal current field is more or less regular, and predictable with high accuracy. On the other hand, wave-induced current and wind-induced current are non-periodic. Wave-induced current speed depends on wave power, and wind-induced current speed depends on wind speed. The resultant current at a site reflects all these factors. Strictly speaking these factors don’t work linearly, so that separation of measured current vectors into individual components, i.e. tidal, wave-induced, wind-induced components, and ocean currents may not be possible. However, we assume linearity between the current components as the first step.
Research works on rip current and its danger at Haeundae Beach have recently started. Kim et al. [24] used a depth-average numerical model to simulate rip current at Haeundae Beach. They showed a field rip current photograph, ADCP measurements at a point, and numerical model results, but their comparison of model results and measurements are quite qualitative, and thorough temporal and spatial analysis lacks.
Chun et al. [7] developed a three-dimensional numerical model to calculate rip currents. They validated their model against a laboratory experimental case, and Haeundae field conditions. They showed their model results, and concluded that the numerical model can reproduce the current field at Haeundae Beach more accurately, if tidal current is additionally considered to the wave-induced current. They didn’t present quantitative comparison due to lack of field measurements.
Lee et al. [25] proposed a site-specific index for prediction of rip current generation at Haeundae Beach, which is a modification of an existing index for rip current generation at other places. Their new index involves physical parameters, and was verified against some field occurrence number of actual rip current at Haeundae Beach. They did not pay attention to specific locations of rip current.
Kim et al. [26] conducted a wide range of research work on Haeundae Beach problems. They carried out laboratory experiments and numerical modelling on rip current generation and bathymetric change at the beach. They also proposed countermeasures to mitigate serious erosion problem of the beach. They applied the numerical model to a few conditions at Haeundae Beach. Comparison of their numerical model results and hydraulic laboratory experimental results was not carried out in their work.
In the present study drogues were deployed at several near-shore points along the beach at 15:00, 4 April 2008 during a high wave period to figure out strength and distribution of the wave-induced current along the beach. A numerical model system is then used to reproduce the measured alongshore current field which is mainly composed of wave-induced current and tidal current. The model results also explain the spatial distribution of the wave-induced current at the beach of the survey time. The model then demonstrates existence of rip current for a fictitious case with S waves.
2. Measuring currents at Haeundae beach by using drogues
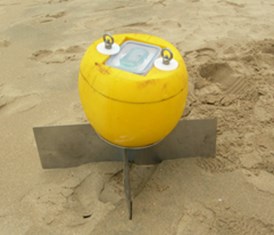
Drogues are adequate to measure sub-surface current, although they measure currents of a fixed depth only where veins are placed. They are also affected by wind to some extent because of floating buoy composing the drogue. Drogues were manufactured using small buoys, GPS, veins, and weights, and were deployed at several positions in two zones (Fig. 1) along Haeundae Beach at 15:00, 4 June 2008 during a low pressure period to measure near-shore currents, see Figs. 4 and 5. Wave and wind were measured simultaneously with the drogues so that measured currents could be explained with driving forces. Tidal current at 20 m deep water and tidal level were measured in 2007, and the data were transformed into the harmonic constants.
Fig. 4GPS-equipped drogue manufactured for present survey
Drogues were deployed at positions of about 4 m water depth, and all of them landed onshore after some time. GPS data of a drogue show time-series positions in a Lagrangian manner, and were converted into average current vectors, see Fig. 5. Then the average current vectors are split into two components, i.e. the alongshore and cross-shore components, see Table 1. The magnitude of the alongshore components of near-shore currents was between 11 to 26 cm/s, which is thought significant.
Table 1Alongshore component of measured field current at Haeundae at 15:00, 4 June 2008
Zone | A | B | |||||||
Position | 1 | 2 | 3 | 4 | 5 | 6 | 7 | 8 | 9 |
Speed (cm/s) | 12 | 17 | 17 | 15 | 15 | 11 | 26 | 21 | 15 |
Average (cm/s) | 15 | 17 | |||||||
Waves were continuously measured at St. W including the time of the drogue survey, 15:00 of 4 June 2008, see Fig. 1. The significant wave height from 12:00 to 15:00 4 June 2008 of was 2.0 m, the peak wave period was 6.0 s, and the main deep offshore wave direction was from SE, i.e. heading towards 135 degree counterclockwise from East. The offshore SE waves refracted to SSE at 20 m water depth [23].
Fig. 5Measured drogue tracks at Haeundae Beach at 15:00 of 4 June 2008
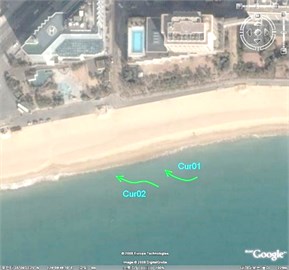
a) Zone A
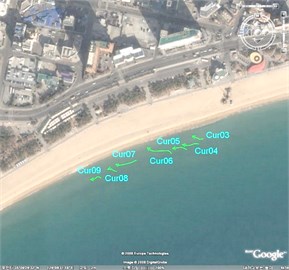
b) Zone B
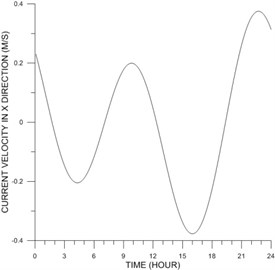
Water level, and offshore current were measured at St. T, and St. C (Fig. 1) for a month period in 2007. After filtering and harmonic analysis, the measured records were converted to harmonic constants of tide and tidal current at the stations, see Tables 2 and 3. At 15:00 4 June 2008 tidal current was westward, and tide was at the beginning of flooding phase, see Figs. 6 and 7. Usually tidal currents at very shallow zone are weaker than those at deeper waters.
Fig. 6Time-series of tidal level at St. T on 4 June 2008 based on harmonic constants
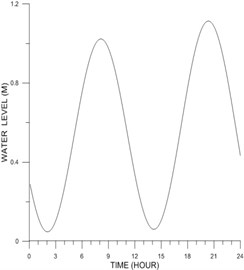
Fig. 7Time-series of x-component of tidal current at St. C on 4 June 2008 based on harmonic constants
Winds were simultaneously measured at Busan Tidal Station with drogue survey, see Fig. 1. Measured wind speed between 12:00 and 15:00 of 4 June 2008 was 2.6-3.2 m/s, and the direction was NE. The measured wind speed at the survey time is considered relatively small, and the effect of wind on the near-shore current at the time is ignored here.
The major driving force of the measured currents by using drogues at the survey time is considered to be the wave-induced force. Tide-induced force may be the second driving force of the field current for the measured period at the site.
Table 2Harmonic constants of tidal level at St. T based on measurements from 2 October 2007 to 12 November 2007
Constituent | Amplitude (cm) | Modified Phase Lag, g (deg) |
M2 | 34 | 224.9 |
S2 | 18 | 253.8 |
K1 | 3 | 96.8 |
O1 | 1 | 104.3 |
Table 3Harmonic constants of tidal current at St. C based on measurements from 2 October 2007 to 12 November 2007
Constituent | -Component | -Compoment | ||
Amplitude (cm/s) | Modified Phase Lag, g (deg) | Amplitude (cm/s) | Modified Phase Lag, g (deg) | |
M2 | 20 | 287.2 | 3 | 235.1 |
S2 | 9 | 308.4 | 2 | 272.4 |
K1 | 6 | 213.6 | 2 | 237.6 |
O1 | 6 | 166.0 | 2 | 170.0 |
3. Numerical modeling of wave-induced current field at Haeundae beach
A coastal flow model has common aspects, e.g. free surface exists, bed slope is mild, and flow is turbulent. A coastal flow model is specified by dimensions of governing equation, grid type, numerical schemes adopted, program language, parallelism type, application area, physics included, and driving forces of interest.
In this study a recently-developed, free-downloadable numerical model system, CST3D system [27], is adopted to reproduce the measured field currents, and to understand characteristics of the wave-induced current at Haeundae Beach. The model system is composed of a wave module, an external driving force module, a flow module, and a sediment transport module. The sediment transport module remained inactivated for the present problem. The system uses orthogonal curvilinear grid in horizontal domain, and sigma grid in vertical direction.
Model application strategy is important to obtain final meaningful model results which can explain field current well. First, driving forces should be carefully examined at the beginning stage of modelling: there could be several physical factors to affect field coastal current at a specific time and place. Importance of wind-induced force, tide-induced force, density-induced forces may differ place by place. Whether contributions of several physical factors to the flow are linear should also be considered.
Fig. 8Computed wave vector field around Haeundae at 15:00 of 4 June 2008 (arrow direction: wave direction; arrow length: significant wave height)
The wave module of the system is the open software, SWAN v40.91ABC [1]. The SWAN solves wave field on frequency domain, and incorporates wave-current interaction. The field wave conditions at the survey period were: the significant wave height was 2.0 m, the peak wave period was 6.0 s, and the main wave direction at offshore deep water was SE. Waves refract as they approach shallow water, and the wave direction of the incident waves at the survey time at the station of 20 m depth was SSE [23]. Computed wave vectors for the conditions corresponding to the field survey time are shown in Fig. 8. The waves undergo transformation due to non-even bottom geometry like submerged rocks, get focused behind shoals, and get broken at shallow water depth as in Fig. 8. Then, spatial gradient of wave energy constitutes the driving forces of the wave-induced current.
The depth-integrated wave-induced driving force components for monochromatic waves are obtained from the following equations:
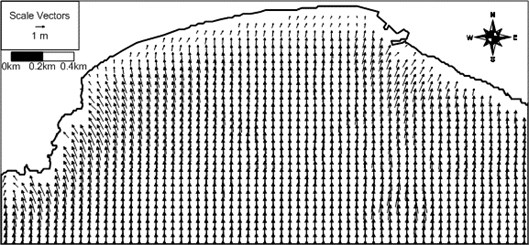
where , are the wave-induced driving force terms in the x and y directions, respectively; is the fluid density; , , are the depth-integrated radiation thrust components acting normally in the direction, acting normally in the direction, acting tangentially in the or direction, respectively; is the ratio of group celerity and phase speed; is the wave energy per unit area ); is the wave number; is the water depth; and is the wave progress angle counterclockwise from the axis [14, 28-30]. The driving forces for random waves should then be computed from summation of individual forces for each wave spectral component from the wave-induced force module, WIF in the CST3D system. In the present study a monochromatic wave condition with the significant wave height and the peak wave period is used for ease of computation. Lateral mixing, or turbulent mixing due to wave breaking influence the spatial distribution of the driving forces (Longuet-Higgins [28]). Horizontal turbulent mixing is often expressed as horizontal dispersion terms with large dispersion coefficients, which may cause difficulties in numerical computation. Instead of the horizontal dispersion terms, the spatial distribution of the driving forces are obtained by Kim’s method [9] in this module. The above driving forces are non-evenly distributed in the water column [7]. However, the vertical distribution of the forces is close to uniform, if waves are shallow water waves. Wave-induced current was obtained after 60 minutes execution of the flow model with steady wave-induced force, when bay-size oscillation almost decayed. The computed wave-induced driving force vector field in the domain at the survey time is shown in Fig. 9. The wave-induced driving forces push water body towards onshore within and near the surf zone.
Fig. 9Computed wave-induced force vector field around Haeundae at 15:00 of 4 June 2008 (arrow direction: force direction; arrow length: force magnitude)
Wave-induced current is then computed from the flow module, FLOW, in CST3D system. The flow module solves continuity equation and three momentum equations during the internal mode:
where , , are the local coordinate transform parameters; is the new vertical coordinate (); is the water level; is the water depth; , , are the fluid velocities in the and and axis, respectively; is the pressure; , , are the spatial advection terms in the , and directions, respectively; is the Coriolis coefficient; , , are the forces including Coriolis force, gradient of water level, pressure gradient; , , are the dispersion terms in the , and directions, respectively; and are the external driving forces over fluid density in the and directions, respectively; and is the acceleration due to gravity. When multi-layers of fluid are chosen, the above primitive equations are solved in the internal mode. Each Eq. (4)-(6) is split into two by adopting the operator splitting method [31]:
Eqs. (11)-(13) and (14)-(16) are solved alternately: Eqs. (11)-(13) are solved by PESM [22], and Eqs. (14)-(16) are solved by the forward-time central-space (FTCS) scheme. Introducing assumption of hydrostatic pressure distribution, the above equations are depth-integrated, and transformed into the shallow water equations, which are solved in the external mode.
Driving forces of the flow could be external forces in domain or boundary assignment of water level or fluid fluxes across open boundary lines. The flow module solves the wave-period-average water level, and the two depth-average horizontal momentum equations during so-called external stage, and solves the three-dimensional momentum equation later during the internal stage, if more than one layer are chosen to resolve the water depth. One layer is chosen for the present simulation. An option of the model system to consider interaction between the wave module and the flow module with repeated exchange of information is not adopted for this study.
Fig. 10Computed wave-induced current vector field around Haeundae at 15:00 of 4 June 2008 (arrow direction: current direction; arrow length: current speed)
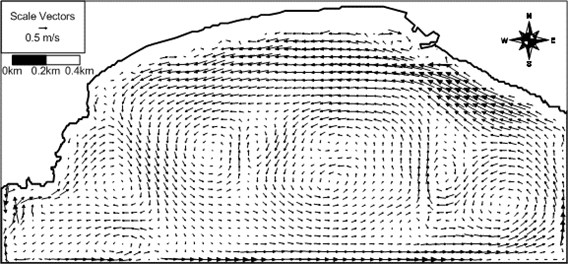
Fig. 11Computed wave-induced set-up contours at 15:00 of 4 June 2008
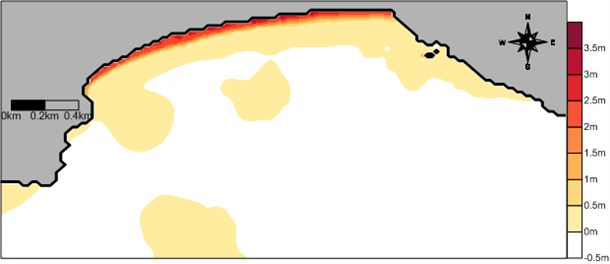
The wave-induced current can be simulated with the tidal current if proper boundary conditions are provided. However, because of uncertainty of the wave-induced set-up along the open boundary lines in the computational domain, it is not desirable to compute the wave-induced current with the tidal current which is mainly driven from boundary conditions assigning time-series of the water level. Thus, the tidal current is simulated from the open boundary condition, separately from the wave-induced current in the present study. For simulation of the wave-induced current we surround the main computation domain by land boundary. In this case model results only far from the fictitious land boundary are considered meaningful. Similar situations exist for laboratory experiment of the wave-induced current. Computed wave-induced current vector field in the domain at the survey time is shown in Fig. 10. The overall computed wave-induced current direction along the shoreline at the specific time is mostly westward, which agrees with field drogue measurements. The computed wave-induced current speeds at several measurement points in both Zones A and B also agree reasonably well with measurements with a bit large magnitude, see Table 4. The magnitudes of the computed wave-induced current speeds are similar to the measured current speeds at the field, which was generated by not only the wave-induced forces, but also tide-induced forces. Thus, we need to examine the magnitude of tidal current component. The computed water level contours at the same time is shown in Fig. 11. The computed set-up level is high along shoreline where waves break.
Table 4Comparison of measured and computed alongshore current speeds at two zones
Zone | A | B |
Average measured speed | 15 | 17 |
Average computed speed | 30 | 25 |
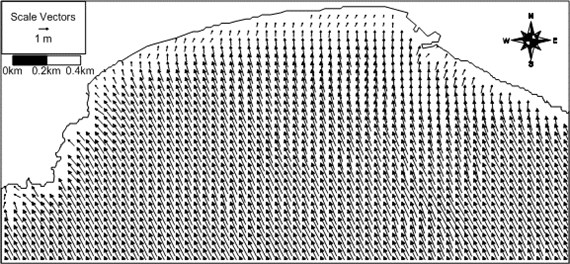
The computed tidal current vector field at Haeundae Beach at 15:00, 4 June 2008 is shown in Fig. 12. The tidal current direction is westward, and its speed decreases from 30 cm/s to 0 cm/s from 15 m depth to the shore. The tidal current speeds at the locations where drogues were deployed are around 5 cm/s, which are relatively small compared to the wave-induced current speeds in the surf zone. Therefore, the computed wave-induced currents mostly explain the measured current speeds at the survey time even without consideration of tidal current.
Fig. 12Computed tidal current vector field around Haeundae at 15:00 of 4 June 2008 (arrow direction: current direction; arrow length: current speed)
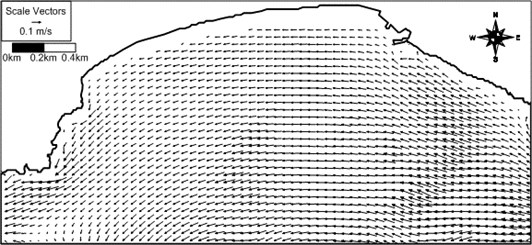
Fig. 13Computed wave vector field around Haeundae for artificial case with S waves
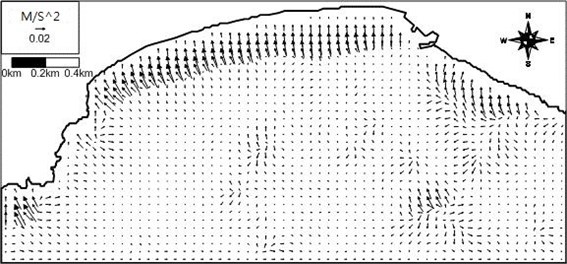
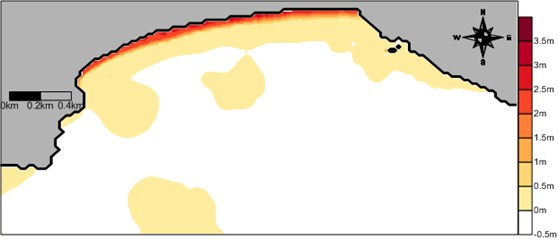
In order to see the effect of the incident wave direction on the wave-induced current field the model system is applied to the same conditions as the above application except the wave direction of S for examination of a different wave direction. The computed wave field, wave-induced driving force field, wave-induced current field, and wave-induced set-up contours are shown in Figs. 13-16. Differently from the previous case, rip currents of maximum 50 cm/s develop for S waves at a location in front of the Busan Aquarium situated on the western part of the beach. The computed rip current proceeds by several hundred meters until it encounters the model land boundary. Appearance of rip current for different wave direction may demonstrate that the wave-induced current field is sensitive to the wave direction. The present results could be used for prediction of rip current location and strength at Haeundae Beach in the future. The present study results could also be used for prediction of morphological change at Haeundae Beach.
Fig. 14Compuetd wave-induced force vector field around Haeundae for artificial case with S waves
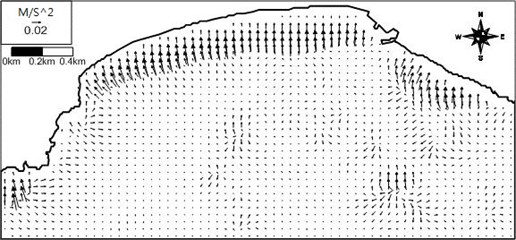
Fig. 15Computed wave-induced current vector field around Haeundae for artificial case with S waves
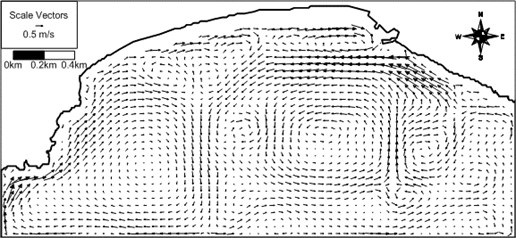
Fig. 16Computed wave-induced set-up contours around Haeundae for artificial case with S waves
4. Conclusions
Currents were measured along the west part of Haeundae Beach in a Lagrangian way using drogues. The magnitude of measured alongshore current speeds was up to 26 cm/s. Main component of the field currents are thought to be the wave-induced current component. Measured currents also include tidal current component as a minor one.
Cross-shore components of the measured current vectors were all in the onshore direction. This onshore movement of drogues may have been influenced by the mass transport due to wave breaking. However, quantitative analysis of the magnitude of the onshore speed of drogues remains as future work which may involve more detailed measurements.
Numerical model CST3D includes a spreading algorithm of the wave-induced driving forces, and an accurate scheme, PESM, for computation of advection, and was adopted for this study. Numerical modelling provided the snap-shot of the wave-induced current field at the survey time, the background wave field, and the wave-induced force field at the same time. The modeling results demonstrate that the SSE waves with the near-shore wave height of 2.0 m and the peak wave period of 6.0 s generate significantly strong westward wave-induced current along the shoreline, which agree well with drogue measurements. The model system was applied to a fictitious case with S waves, and the results show that rip current develops in front of the beach.
The littoral drift at Haeundae may also be westward for incident waves of SE direction following the wave-induced current direction. The long-term balance of the coastal geometry or the shoreline shape could be simulated by using the present wave and flow model results in the future. It is believed that the present model system and its application procedure could be used for simulation of wave-induced current fields at any other wave-dominant beaches like Haeundae beach.
References
-
The SWAN Team. SWAN implementation manual. Delft University of Technology, 2013.
-
Smith J. M., Sherlock A. R., Resio D. T. STWAVE: Steady-state spectral wave model user’s manual for STWAVE version 3.0.1. Report ERDC/CHL SR-01-1.
-
Kolokythas G. A., Dimas A. A. Three-dimensional modelling of wave-induced currents in the surf zone. Proceedings of Coastal Dynamics, 2013, p. 979-990.
-
Copeland G. J. M. A practical alternative to the mild-slope wave equation. Coastal Engineering, Vol. 9, 1985, p. 125-149.
-
Li S., Shibayama T. Calculation of wave-induced longshore current in surf zone by using Boussinesq equations. Coastal Engineering 2000, 2001, p. 334-345.
-
Fang K., Yin J., Zou Z., Liu Z. Boussinesq modeling of rip currents on barred beach. Procedia Engineering, Vol. 24, 2011, p. 573-578.
-
Chun J., Ahn K., Suh K. D., Kang T. S. Calculation of rip currents using a three-dimensional nearshore current model. Proceedings of Coastal Dynamics, 2013, p. 363-374.
-
Longuet-Higgins M. S., Stewart R. W. Radiation stresses in water waves; a physical discussion, with applications. Deep Sea Research, Vol. 11, 1964, p. 529-562.
-
Kim H. Practical spreading of driving forces for wave-driven currents. Ocean Engineering, Vol. 31, 2004, p. 435-453.
-
Cui L., Tang J. Numerical study on random waves and wave-induced long-shore currents at Leadbetter beach. Journal of Marine Science and Technology, Vol. 19, Issue 2, 2011, p. 222-230.
-
Fedderson F., Trowbridge J. H. The effect of wave breaking on surf-zone turbulence and alongshore currents: a modeling study. Journal of Physical Oceanography, Vol. 35, 2005, p. 2187-2203.
-
Suzuki N., Hara T., Sullivan P. P. Impact of breaking wave form drag on near-surface turbulence and drag coefficient over young seas at high winds. Journal of Physical Oceanography, Vol. 43, 2013, p. 324-343.
-
O’Connor B. A., Kim H., Yum K. D. Modelling siltation at Chukphyon Harbour, Korea. Computer Modelling of Seas and Coastal Regions, 1992, p. 397-410.
-
Kim H. Three-dimensional sediment transport model. Ph. D. Thesis, The University of Liverpool, UK, 1993.
-
Hamrick J. M. The environmental fluid dynamics code theory and computation. Hydrodynamics and mass transport, Tetra Tech, Vol. 1, 2007.
-
Deltares, Delft3d-Flow: Simulation of Multi-Dimensional Hydrodynamic Flows and Transport Phenomena Including Sediments. User Manual, Hydro-Morphodynamics, Version 3.15.33641, 2014.
-
Luettich R., Westerink J. Formulation and numerical implementation of the 2D/3D ADCIRC finite element model version 44.XX. University of North California, 2004.
-
Lax P. D., Wendroff B. Systems of conservation laws. Communications on Pure and Applied Mathematics, Vol. 13, 1960, p. 217-237.
-
Harten A. High resolution schemes for hyperbolic conservation laws. Journal of Computational Physics, Vol. 135, 1983, p. 260-278.
-
Harlow F. H., Welch J. E. Numerical calculation of time-dependent viscous incompressible flow of fluid with free surface. The Physics of Fluids, Vol. 8, 1965, p. 2182-2189.
-
Bidoae R. Eulerian Lagragian marker and micro cell numerical simulation method for free surface flows. 6th International Conference Hydraulic Machinery and Hydrodynamics, Timisoara, Romania, 2004, p. 579-586.
-
Kim H., Ahn J., Jang C., Jin J., Jung B. Extension of piecewise exact solution method for two- and three-dimensional fluid flows. Journal of Vibroengineering, Vol. 15, 2013, p. 1243-1254.
-
Busan City. Basic design report: management of Haeundae Beach. Seil Engineering, 2009.
-
Kim I. C., Lee J. L., Lee J. Y. Verification of rip current simulation using a two-dimensional predictive model, Haecum. Journal of Coastal Research, Special Issue 65, 2013, p. 726-730.
-
Lee J. Y., Jun K. C., Lee S. C., Lee J. L. A study on a predictive index for dangerous rip current generation at Haeundae beach. Journal of Coastal Research, Vol. 65, 2013, p. 754-759.
-
Kim K. H., Shin S., Widayati A. Y. Q. W. Mitigation measures for beach erosion and rip current. Journal of Coastal Research, Vol. 65, 2013, p. 290-295.
-
Kim H. User manual of CST3D-2013-v1 haksan media. 2013, (in Korean).
-
Longuet-Higgins M. S. Longshore currents generated by obliquely incident sea waves: 1. Journal of Geophysical Research, Vol. 7, Issue 33, 1970, p. 6778-6789.
-
Longuet-Higgins M. S., Stewart R. W. Radiation stresses in water waves; a physical discussion, with applications. Deep Sea Research, Vol. 11, 1964, p. 529-562.
-
Stive M. J. F., Wind H. G. A study of radiation stress and set-up in the nearshore region. Coastal Engineering, Vol. 6, 1982, p. 1-25.
-
Harwood R. C. Operator splitting method and applications for semilinear parabolic partial differential equations. Ph.D. Thesis, Washington State University, 2011.
About this article

This work has been funded by Korea Ministry of Oceans and Fisheries through the Korea Institute of Marine Science and Technology under research contract “MIDAS”, 2014, and “Marine and Environmental Prediction System (MEPS)”, 2013.
