Abstract
To obtain the spectrum of impulse response from impact test, the paper proposes an approach based on envelope of cross-correlation function. This is achieved by correlating the impulse response and reference single-harmonic signals. An envelope of cross-correlation makes it possible to detect and identify the harmonics of impulse response. The presented method gives a possibility to point the frequency value of the harmonic component of an impulse response signal independently of the commonly used fast Fourier transform. Its main advantage over the fast Fourier transform is that the spectral resolution does not depend on duration of the impulse response.
1. Introduction
It is well known that using fast Fourier transform (FFT) for spectrum analysis will give an immediate frequency profile of recorded signals. When analyzing signals using the transform, spectral resolution is fixed as an inverse of the duration of the analyzed signal and, as a result, it fails to meet the requirements of research. For impulse response signals, the record length is often below one second, which results in a spectral resolution within a few or even tens of Hz. The above can be especially noted for very short-time impulse responses. One of the ways of making it possible to increase frequency resolution is interpolation. It improves the resolution by a few orders, depending on the interpolation method, window used and noise present in the spectrum [1, 2]. In order to avoid limitation in frequency resolution using FFT, Cawley and Adams [3] investigated that problem and showed that it was possible to obtain frequency resolution of one-tenth of the spacing between the frequency points produced by the Fourier transform. Also, zero-padding is commonly used for improving frequency estimation [4, 5].
There are a great number of engineering applications of correlation function [6]. Looking for its new applications, the cross-correlation function has been utilized to correlate real-measured signal and a single-harmonic signal generated by software. Also, the Hilbert transform was used to obtain the envelope of the cross-correlation function [7, 8]. In particular cases, for stationary signals, experimental results have shown a linear shape of the envelope. It is observed when correlated signals have a common frequency value [9]. This effect is well noted and very sensitive to generated single harmonic signal frequency. This paper describes a method of reading a particular frequency of the harmonic developed on the basis of the cross-correlation function and its envelope.
Using the method presented in the paper it is also possible to obtain different frequency resolution from that obtained by using FFT. Frequency resolution can be variable, adjusted by the user of the method.
2. Methodology
Preliminary studies based on numerical calculations have shown that an envelope of the cross-correlation function of two harmonic processes with one of them being damped, decays exponentially. In addition, the equality of the frequencies of the harmonics creates the highest position of the envelope plot in comparison to the non-equality of the frequencies. Apart from analyzed signal , the method presented here requires a series of harmonic signals generated as follows:
where and are an integer value (index) and frequency resolution respectively. After correlating both the input and the generated signals, the plot position of the envelope of the cross-correlation indicates a detection and eventual identification of the harmonic. This phenomenon is easy to detect and the determination of common frequency is swift. As a result, the envelope plot can be effectively used to identify the harmonics incorporated in recorded signals with no need for the Fourier transform. The frequency value of the harmonic in the input signal can be determined using the envelope plot. Studying the envelopes, we obtain both and values of signal used for calculations. Thus, formula () indicates the frequency of the identified harmonic. Apart from cross-correlation envelope plots, indicator is used to express envelope position numerically. As a result, it is possible to present a plot of changes in values for a frequency span in which the impulse response has been recorded. indicator is described as follows:
where is the cross-correlation envelope, is the sampling period and stands for the number of samples. Thus, a plot of changes of indicator can be prepared. The plot now can be called a spectrum.
3. Spectrum of impulse response of SDOF system obtained by indicator
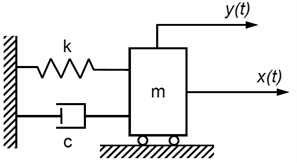
To illustrate the proposed method for obtaining the spectrum a numerical example of a single degree-of-freedom (SDOF) system under an impulse load is considered. It is shown in Fig. 1. The form of frequency response of SDOF system is as follows [6]:
in which undamped natural frequency and damping ratio .
Fig. 1SDOF system: m – mass, c – damping coefficient, k – stiffness
For 1, the impulse response function of the system described above is given by the inverse Fourier transform of Eq. (3) as follows [6]:
where , and damped natural frequency .
In the example taken into consideration mass and damping coefficient and stiffness are equal 1 kg and 50 Ns/m and 650000 N/m, respectively. The value of damped natural frequency was calculated and equal to 128.25 Hz. Also, impulse response was generated by sampling frequency equal to 4000 Hz and number of samples 1024. The impulse responses of considered system is shown in Fig. 2.
Fig. 2Impulse response of SDOF system
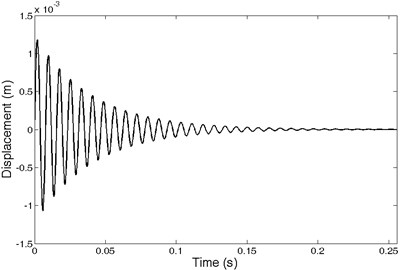
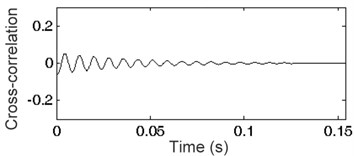
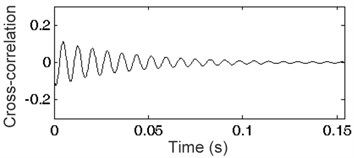
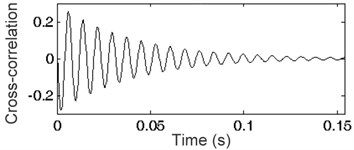
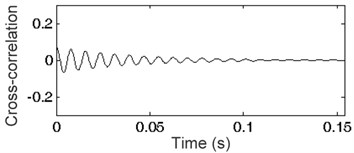
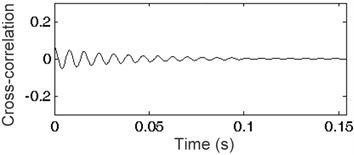
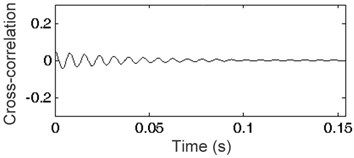
Fig. 3Cross-correlation functions: a) i= 110, b) i= 120, c) i= 128, d) i= 145, e) i= 150, f) i= 155
a)
b)
c)
d)
e)
f)
Fig. 3 presents cross-correlation functions of impulse response and harmonic signals generated for frequency resolution 1 Hz ( 1) as well as 110, 120, 128, 145, 150 and 155 Eq. (1). A set of envelopes of the cross-correlation function is shown in Fig. 4. The envelope marked in bold represents the frequency of generated harmonic signal equal to the frequency of the harmonic existing in the analyzed impulse response. Any other frequency of signal will always result in placing the envelope below the bold line. This phenomenon and the methodology described in Section 2 were applied for impulse responses of the SDOF system. The spectrum of impulse response of the SDOF system obtained by cross-correlation and its envelope are presented in Fig. 5 as a plot of indicator (see Section 2). The maximum of the indicator plot shows the frequency existing in the impulse response. The parameter of generated signal can be changed to acquire the required frequency resolution. The frequency found at the maximum value of indicator depends on the frequency resolution used in the method. The results are given in Table 1. High accuracy amounting to a few hundredths of Hz was obtained.
Fig. 4Envelopes of cross-correlation functions
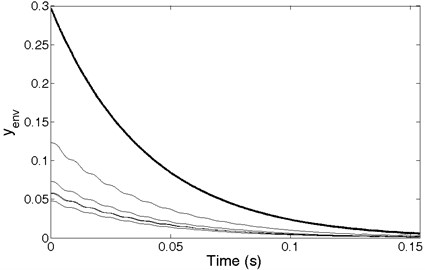
Fig. 5Spectrum of impulse responses of SDOF system obtained using Se indicator
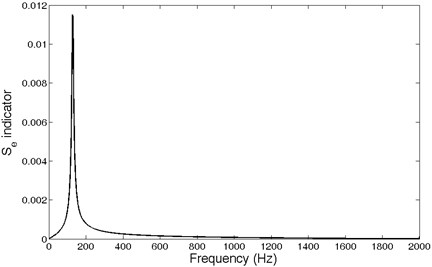
Table 1Frequency resolution and frequency readout using cross-correlation envelope method
Frequency resolution (Hz) | Frequency readout (Hz) | Percentage error between theoretical (128.25 Hz) and readout frequency (%) |
4.00 | 128.00 | 0.19 |
2.00 | 128.00 | 0.19 |
1.00 | 128.00 | 0.19 |
0.50 | 128.50 | 0.19 |
0.20 | 128.40 | 0.12 |
0.10 | 128.30 | 0.04 |
Using FFT, an analysis of generated impulse response of SDOF system has its spectral resolution equal to 3.9 Hz. Frequency readout is 128.90 Hz. Thus, it is percentage error between theoretical and readout frequency equal to 0.51 %. The cross-correlation envelope method even for the nearly same spectral resolution (4 Hz) has an error over two times less.
4. Results for real measurements
In this section, frequency identification based on the cross-correlation envelope method (CCEM) is applied to analyze an acoustic impulse response from impulse test of a rotor blade.
The performed impact test provides vibroacoustical signal rich in useful information in the process of servicing the object under consideration. In performed impact test, spectral analysis is resulting the spectrum in which we can find out natural frequencies of the blade. This is the base for diagnosing the defects, particularly cracks where natural frequencies are changeable. Thus, dynamic properties of the tested system are provided.
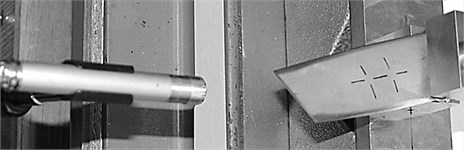
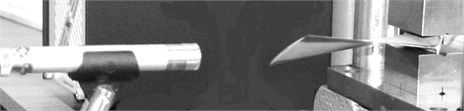
The measurement has been performed using ½-inch free-field microphone, lightweight impact hammer (low head mass, 2 grams) and a two-channel acquisition system. An appropriate blade mounting system having a mounting holder was used. The blade was put into excitation at the centre of the blade body using the impact hammer and an impact has been carried out manually. The microphone has been placed opposite the blade tip as shown in Fig. 6. Signals acquisition has been executed automatically by triggering the measurement. The obtained impulse response is shown in Fig. 7.
Fig. 6The microphone-blade system: a) top view; b) lateral view
a)
b)
Fig. 7Acoustic impulse response (IR) of rotor blade
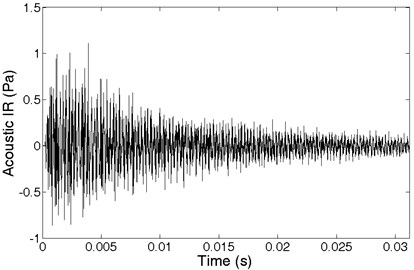
Fig. 8Impulse response spectrum obtained using FFT
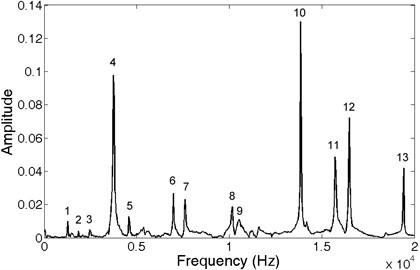
The impulse response from the rotor blade has been recorded within 0.0312 sec (2048 samples recorded, sampling rate over 65 kHz). Thus, the frequency resolution obtained using FFT is 32 Hz. However, using CCEM, the method has its own spectrum resolution independent of the duration of the analyzed signal. The spectra of blade impulse response obtained using FFT and CCEM are presented in Figs. 8-10 respectively.
Fig. 9Spectrum of blade impulse response obtained using CCEM for frequency resolution 32 Hz
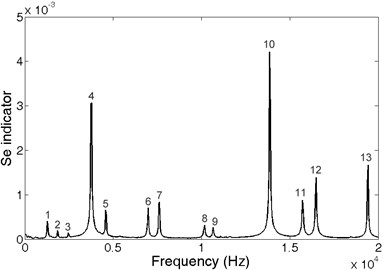
Fig. 10Spectrum of blade impulse response obtained using CCEM for frequency resolution 1 Hz
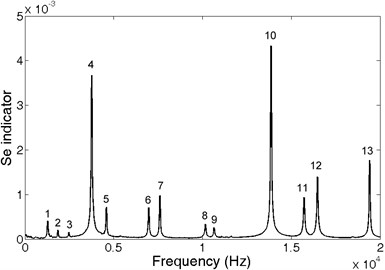
Table 2Frequencies obtained by CCEM and FFT
Peak number | Frequency obtained using FFT (Hz) | Frequency obtained using CCEM by frequency resolution 32 Hz | Frequency obtained using CCEM by frequency resolution 1 Hz |
1 | 1280 | 1280 | 1281 |
2 | 1856 | 1856 | 1858 |
3 | 2464 | 2464 | 2472 |
4 | 3744 | 3744 | 3760 |
5 | 4576 | 4576 | 4587 |
6 | 6976 | 6976 | 6973 |
7 | 7616 | 7616 | 7601 |
8 | 10176 | 10176 | 10166 |
9 | 10528 | 10656 | 10653 |
10 | 13856 | 13856 | 13862 |
11 | 15712 | 15712 | 15724 |
12 | 16480 | 16480 | 16475 |
13 | 19424 | 19424 | 19415 |
Table 2 shows a list of frequencies obtained using FFT and also the results of the CCEM by frequency resolution of 32 Hz and 1 Hz. Except peak No. 9, the maximum shift between methods is for peak No. 4 by CCEM resolution of 1 Hz and equals 16 Hz (0.4 %, re. FFT).
Taking into the consideration results presented in Section 3, we can conclude that results obtained using CCEM by the resolution of 1 Hz are more reliable than results obtained using FFT by the unchangeable resolution of 32 Hz. Thus, CCEM method can provide much more accurate measurement of natural frequencies than fast Fourier transform when using impact tests and obtaining impulse response.
5. Conclusions
The paper describes the use of cross-correlation function and its envelope for obtaining impulse response spectrum with controllable resolution. The approach shows a possibility to detect and finally to identify frequencies without any use of the Fourier transform, which means without any limitation of frequency resolution dependent on length of the signal to be analyzed. An illustrative example for the SDOF system has shown that in comparison with FFT, the proposed approach gives better results. The method proposed gives a possibility to obtain a controllable spectral resolution independent of the recorded signal length. The cross-correlation envelope method can be used as a complementary method for accurate detection of natural frequencies using impulse tests, e.g. for diagnosing. The spectral resolution can reach tenths of Hz for exceptionally short impulse responses when FFT resolution is often equal to few dozen of Hz.
References
-
Gasior M. Improving frequency resolution of discrete spectra. Ph. D. thesis, AGH University of Science and Technology, Krakow, Poland, 2006.
-
Gasior M. Improving Frequency Resolution of Discrete Spectra – Algorithms of Three-Node Interpolation. Academic Publishing, 2010.
-
Cawley P., Adams R. D. Improved frequency resolution from transient tests with short record lengths. Journal of Sound and Vibration, Vol. 64, 1979, p. 123-132.
-
Quinn B. G. Recent advances in rapid frequency estimation. Digital Signal Processing, Vol. 19, 2009, p. 942-948.
-
Dunne J. F. A fast time-domain integration method for computing non-stationary response histories of linear oscillators with discrete-time random forcing. Journal of Sound and Vibration, Vol. 254, 2002, p. 635-676.
-
Bendat J. S., Piersol A. G. Engineering Applications of Correlation and Spectral Analysis. Wiley-Interscience, New York, 1980.
-
Thrane N. The Hilbert Transform, Technical Review 3. Brüel&Kjær, Naerum, Denmark, 1984.
-
Thrane N., Wismer J., Konstantin-Hansen H., Gade S. Practical use of the Hilbert transform, Application Note. Brüel&Kjær, Naerum, Denmark, 1999.
-
Kotowski A. Reading the frequency of harmonics by cross-correlation function and its envelope. 6th International Conference Mechatronic Systems and Materials, 2010.
About this article

This work was supported by Bialystok University of Technology under work No. S/WM/1/2012.
