Abstract
Previously, many isolation systems with friction action are designed ignoring the variability of friction coefficient. By taking a rolling-damper isolation system as the study object, this paper analyzed the effects of non-uniform distribution of rolling friction coefficient on its isolation performance through a compiled computer program. The results show that the errors associated with the maximum structural relative displacement, acceleration and residual displacement due to ignoring the friction variability are sequentially growing, and this rule is weakened by the damper. Under the condition of large friction variability and little damper action, the calculation of the maximum structural relative displacement and acceleration should consider the friction variability. When the structural residual displacement is concerned, the variability of rolling friction coefficient should be fully considered regardless of friction variability degree.
1. Introduction
Seismic damage has been commonly observed in general structures such as buildings and bridges [1-3]. Isolation devices have been considered as an effective method to mitigate the seismic damage and thus are widely used all over the world. However, there are limitations for the traditional isolation devices, e.g. laminated rubber bearing and lead rubber bearing. In UK, Monfared investigated many base isolation systems from the historical evidences up to 2012, which presented a comparative perspective of different methods based on their compatibility, efficiency, benefits and weaknesses of each base isolation system, and the results showed that the effectiveness of a base-isolated system depended on the characteristics of the input excitations as well as the properties of the isolation devices and the superstructure [4]. When the actual earthquake differs from the design earthquake, which is true for most of the cases, traditional isolation devices may cause a significant deformation and transmit a large force to the isolation structure. Therefore, seismic damage still appears in the isolation structure and even sympathetic vibration may happen [5].
To improve the isolation performance, many researchers have paid attention to the new rolling-based isolation method. In India, Jangid and Londhe developed a theoretical formulation to obtain seismic responses of a multistory building supported by elliptical rolling rods in 1998, which were quite effective in reducing the seismic response of the system without undergoing large base displacements [6]. In 2000, Jangid investigated the stochastic response to the earthquake motion of flexible multi-storey shear type buildings isolated by rolling rods with a re-centering device, indicating that the rolling rods were quite effective in reducing the stochastic response of the structure against the earthquake excitation [7]. In USA, George C. Lee proposed a roller seismic isolation bearing for use in highway bridges in 2010, which utilized a rolling mechanism to achieve the seismic isolation and had a zero post-elastic stiffness under horizontal ground motions, a self-centering capability, and unique friction devices for supplemental energy dissipation. After investigating seismic behaviors of the proposed bearing through parametric studies, George C. Lee suspected there were something wrong with the calculation method in AASHTO Specifications and suggested further investigations [8, 9]. In Portugal, Luís Guerreiro carried out a seismic test and a numerical modeling of a rolling-ball isolation system to protect some light structures in 2007, and the results showed an effective reduction of the acceleration levels induced in the isolation structures [10]. In Japan, Kurita developed a new device for seismic response reduction, and the peak acceleration amplitude was decreased by about 50-90 % [11]. In 2012, Nanda in India considered that the base isolation in the form of pure friction (P-F), among all other isolation methods developed so far, was the simplest one, which could be easily applied to low cost brick masonry buildings. Furthermore, the P-F isolation was one of the best alternatives for reducing earthquake energy transmission to superstructure during strong earthquake [12].
In all these studies, the seismic force of structure was controlled to be a small value by setting the rolling-friction isolation device, which was usually the friction force, however, the relative displacement was large [5]. Therefore, restoring-force devices, e.g. spring or sloping surface, were considered to add to the pure-rolling isolation device, which could decrease the relative displacement and residual displacement of the isolation structure. However, if the ratio of the restoring-force device to the pure-rolling device isn’t reasonable, there will be some limitations as well as the traditional isolation devices [4, 5]. On the other hand, as the damper can decrease the relative displacement and have no natural vibration period, the rolling-friction isolation device has been improved by adding the damper instead of the restoring-force devices [13]. However, this improvement assumed the rolling friction coefficient as a fixed value to simplify the calculation process [14, 15], i.e., the distribution of the rolling friction coefficient on the whole contact surface was absolutely uniform, which was opposite to the reality. In fact, there is different variability of rolling friction coefficient on the contact surface according to its current construction level. Hence, it is desirable to know whether the results, including the structural acceleration, relative displacement and residual displacement, based on the initial presumption of uniform friction are safe, and what the corresponding errors are. By taking a rolling-damper isolation system as the study object, this paper analyzes the effects of different non-uniform distributions of rolling friction coefficient on its isolation performance under different earthquake motions through a compiled computer program.
2. Calculation process
2.1. Structural model
In 2013, Wei, the author himself, compiled a computer program to investigate calculation methods of rolling-based isolation systems [13]. In this paper, this computer program is used to analyze the seismic performance of a rolling-damper isolation system as shown in Fig. 1, and the isolated structure is built as one rigid body since the stiffness of isolation device is much less than that of structure [13]. The structure mass is set to be 300 t in this paper, and the damping constants adopt 100, 200, 300, 400 and 500 kN·s/m, respectively.
Fig. 1A rolling-damper isolation system
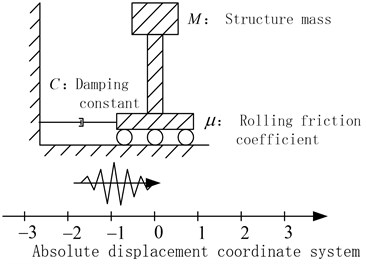
Fig. 2Three cases of rolling friction coefficient distribution (average value: 0.005)
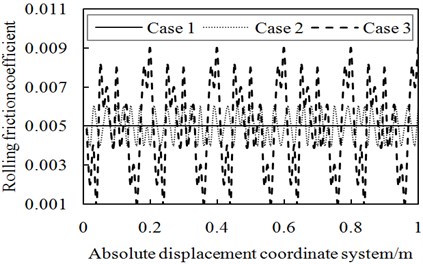
In Fig. 2, as for the average rolling friction coefficient of 0.005 on the contact surface of Fig. 1, there are three cases of rolling friction coefficient distribution:
Case 1 (uniform friction distribution): rolling friction coefficient, along with the different position of contact surface, doesn’t change, which is consistent with the traditional assumptions that the rolling friction coefficient is simplified as a fixed value whether the friction distribution on the contact surface is uniform or not.
Case 2 (slightly non-uniform friction distribution): as the position of contact surface changes, rolling friction coefficient slightly varies around its mean value and the variation range is –0.001~0.001, which corresponds to the perfect construction level.
Case 3 (significantly non-uniform friction distribution): in terms of the rolling friction coefficient on the poorly constructed contact surface, there is a wide range of fluctuation around the average rolling friction coefficient and the variation range is –0.004~0.004.
In this paper, the contact surface of the isolated structure in Fig. 1 adopts 6 average rolling friction coefficients respectively, including 0.005, 0.010, 0.015, 0.020, 0.025 and 0.030. And for each average rolling friction coefficient, there are three cases of friction distribution with the same variation range as shown in Fig. 2. Hence, eighteen cases are obtained in Table 1.
Table 1Eighteen distributions of rolling friction coefficient
Rolling friction coefficient | Rolling friction coefficient | ||||
Average value | Cases | Variation coefficient | Average value | Cases | Variation coefficient |
0.005 | Case 1 | 0 | 0.020 | Case 1 | 0 |
Case 2 | 0.163 | Case 2 | 0.041 | ||
Case 3 | 0.471 | Case 3 | 0.118 | ||
0.010 | Case 1 | 0 | 0.025 | Case 1 | 0 |
Case 2 | 0.082 | Case 2 | 0.033 | ||
Case 3 | 0.236 | Case 3 | 0.094 | ||
0.015 | Case 1 | 0 | 0.030 | Case 1 | 0 |
Case 2 | 0.054 | Case 2 | 0.027 | ||
Case 3 | 0.157 | Case 3 | 0.079 | ||
2.2. Earthquake input
As for each response spectrum for soil profile I, II, III, and IV in Chinese criteria as shown in Fig. 3(a) (JTJ 004-89) [16], one accelerogram is generated by Simqke procedure to be the ground motion input of the structural model [17]. One representative ground motion out of four is shown in Fig. 3(b). Other motions are not presented due to the similarity to Fig. 3(b). In the latter analysis, each accelerogram’s peak ground accelerations (PGA) are adjusted to be 0.2, 0.4, 0.6 and 0.8 g, respectively.
Fig. 3Earthquake input
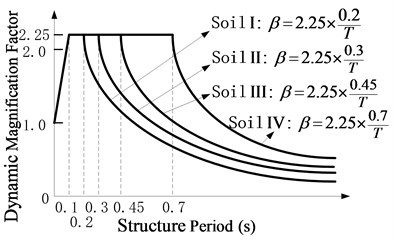
a) Elastic response spectrum for the soil profile I, II, III, and IV in Chinese criteria (JTJ 004-89)
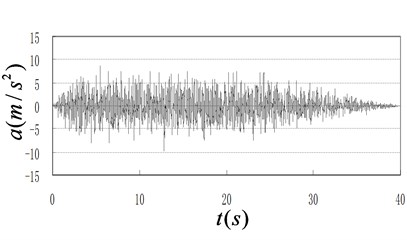
b) A representative accelerogram corresponding to the elastic response spectrum of the soil profile I
2.3. Calculation cases
In the foregoing descriptions, there are 5 damping constants, 6 average rolling friction coefficients (18 friction distributions), 4 soil profile accelerograms and 4 PGA. The combination rule of these parameters is shown in Table 2, and 1440 cases are generated for further calculation.
Table 2Combination rule of the structural parameters
Rolling friction coefficient | Damping constants | Accelerograms | PGA | |
One average value | Case 1 | Combined with the same damping constant | Subjected to the same accelerogram | With the same PGA |
Case 2 | ||||
Case 3 | ||||
In terms of each combination corresponding to cases 2 and 3 of each average rolling friction coefficient in Table 2, the real spatial distribution of rolling friction coefficient is strictly considered in the calculation process, and the ratios of their results to the counterpart of case 1 will be analyzed to express the effects of variability of rolling friction coefficient on seismic performance in the followed sections 3, 4 and 5. The ratios of their results include the structural maximum acceleration, maximum relative displacement and residual displacement. As for each result, the influence factors are shown in the first row of Table 2, i.e. the variability of rolling friction coefficient, damping constant and different ground motions. They are all described and discussed in the followed sections 3, 4 and 5.
Fig. 4Effects of rolling friction coefficient on structural maximum acceleration
a) Influence of variability of rolling friction coefficient
b) Influence of average rolling friction coefficient
3. Structural maximum acceleration
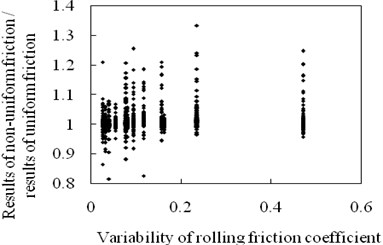
3.1. Effects of variability of rolling friction coefficient on structural maximum acceleration
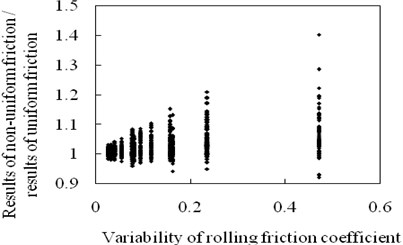
Fig. 4(a) represents the influence of variability of rolling friction coefficient on structural maximum acceleration for all cases in section 2.3. As the friction variability increases, the range of the ratios of the calculation results of the non-uniform friction cases to that of the uniform friction cases becomes wider and worse. The maximum ratio reaches 1.4 when the variability of rolling friction coefficient is 0.471. In this condition, if rolling friction coefficient is simplified as a mean value, ignoring its variability, to calculate the seismic response of the isolation system, the structural maximum acceleration is 40 percent less than the exact one. Hence, it is necessary to fully consider the variability of rolling friction coefficient when calculating the structural maximum acceleration. For the rolling isolation system, the maximum acceleration applied to the structure is , where , , are defined as the gravity acceleration, the absolute velocity of the ground and structure, respectively, and , , have been defined in Fig. 1. As the rolling friction coefficient at any position of the contact surface varies around its mean value of due to the friction variability, the structural acceleration within any time step changes around . Hence, the structural maximum acceleration of must change around . Moreover, the larger the friction variability is, the wider the range of the ratio of to should be. Therefore, the rule in Fig. 4(a) is reasonable.
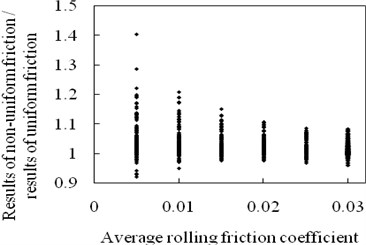
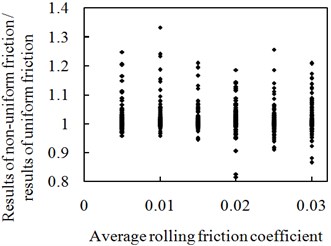
According to the current construction level of contact surface, the amplitude of the rolling friction coefficient can be controlled within a certain range regardless of what its mean value is. Hence, as the average rolling friction coefficient increases, the corresponding variability and ratio of to are both becoming less, which is demonstrated by Fig. 4(b).
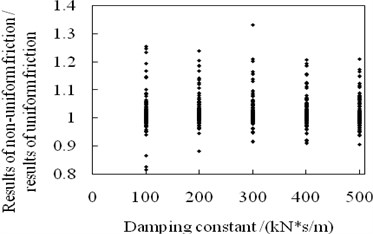
3.2. Effects of damping constant on structural maximum acceleration
In Fig. 5, as the damping constant increases, the range of the ratios of the calculation results of the non-uniform friction cases to that of the uniform friction cases becomes narrower. The maximum ratio is constantly below 1.2 when the damping constant is beyond 300 kN·s/m.
This rule can be explained in theory based on the discussion of section 3.1:
1) If increases, will increase rapidly resulting in the decreasing of . Hence, the variable trends of is always opposite to , which decreases the increment of .
2) If decreases, the variable trends of is also opposite to , which decreases the reduction of .
Therefore, the influence rule of variability of rolling friction coefficient on structural maximum acceleration shown in section 3.1 is weakened by the increment of damping constant.
Fig. 5Effects of damping constant on structural maximum acceleration
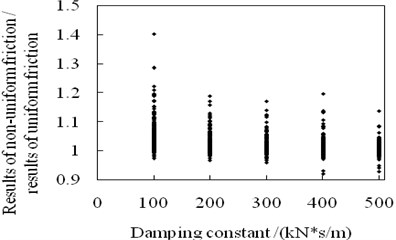
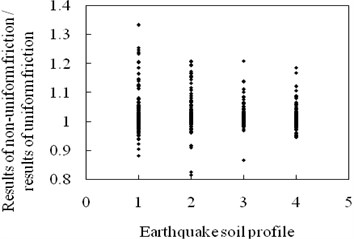
Fig. 6Effects of ground motions on structural maximum acceleration
a) Influence of earthquake soil profile
b) Influence of PGA
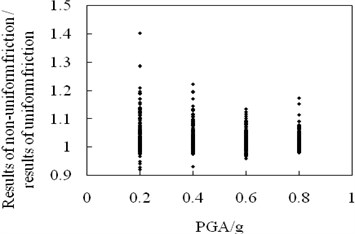
3.3. Effects of different ground motions on structural maximum acceleration
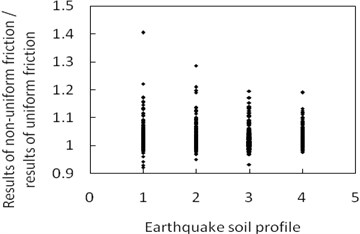
In Fig. 6(a) and (b), as the earthquake soil profile number and PGA increase, the overall rules are that the ratios of the structural maximum acceleration of the non-uniform friction cases to that of the uniform friction cases decrease.
Based on the mechanics, uniform motion in the same direction can strengthen the damper action and weaken the influence of friction variability. As the earthquake soil profile increases, the duration of the ground moving towards the same direction becomes larger. Moreover, the increasing of PGA indicates that the moving displacement of the ground during the same time increases. In these two conditions, the effects of variability of rolling friction coefficient on the structural maximum accelaration decrease. However, this rule is often destroyed by the detailed accelerogram shape, resulting in a few special points in Fig. 6(a) and (b).
4. Structural maximum relative displacement
4.1. Effects of variability of rolling friction coefficient on structural maximum relative displacement
In Fig. 7(a), as the variability of rolling friction coefficient increases, the overall rules are that the ratios of the structural maximum acceleration of the non-uniform friction cases to that of the uniform friction cases increase. When the variability of rolling friction coefficient is 0.471, the maximum ratio reaches 1.26, i.e., the structural maximum relative displacement calculated by ignoring friction variability is 26 percent less than the exact one. Hence, it is better to consider the variability of rolling friction coefficient to avoid unsafe results in calculating the structural maximum relative displacement.
In Fig. 1, when the ground velocity is larger than the structural velocity , the structural acceleration makes the structure have the tendency of moving forward, and there are two possibilities:
1) Under the condition that the moving structure is on the left of its origin position, if the rolling friction coefficient on the contact surface increases, the structural acceleration will increase to decrease the structural relative displacement. Otherwise, the structural relative displacement will increase.
2) If the moving structure is on the right of its origin position, the structural relative displacement will change in a direction opposite to (1) along with the increasing or decreasing of the rolling friction coefficient on the contact surface.
Fig. 7Effects of rolling friction coefficient on structural maximum relative displacement
a) Influence of variability of rolling friction coefficient
b) Influence of average rolling friction coefficient
As for the cases of and , the similar results are obtained. In summary, the variability of rolling friction coefficient can increase or decrease the structural relative displacement under different conditions. And as the friction variability increases, the influence degree will be more significant, resulting in a wider range of the displacement ratio as shown in Fig. 7(a).
For the general contact surface construction, as the average rolling friction coefficient increases, its friction variability decreases, and thus the corresponding range of the displacement ratios in Fig. 7(b) becomes narrower.
4.2. Effects of damping constant on structural maximum relative displacement
Based on the discussion of section 3.2, the damper can weaken the influence of the friction variability on the structural acceleration and thus the structural relative displacement. Therefore, as the damping constant increases, the range of the ratios of the structural maximum relative displacement of the non-uniform friction distribution cases to that of the uniform friction distribution cases are becoming less as shown in Fig. 8. However, this rule is not very obvious.
Fig. 8Effects of damping constant on structural maximum relative displacement
4.3. Effects of different ground motions on structural maximum relative displacement
In Fig. 9(a) and (b), as the earthquake soil profile number and PGA increase, the displacement ratios decrease. The discussion in section 3.3 has given the reason that the more uniform motion in the same direction, caused by the increasing of the earthquake soil profile number and PGA, can strengthen the damper action and weaken the influence of friction variability.
Fig. 9Effects of ground motions on structural maximum relative displacement
a) Influence of earthquake soil profile
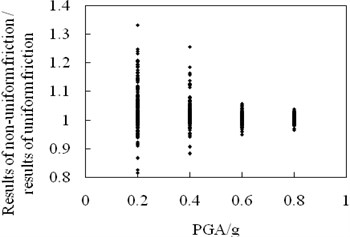
b) Influence of PGA
5. Structural residual displacement
5.1. Effects of variability of rolling friction coefficient on structural residual displacement
Fig. 10(a) represents the influence of friction variability on the ratios of the structural residual displacement corresponding to the non-uniform friction cases to that of the uniform friction cases. As the variability of rolling friction coefficient increases, the range of main ratios in Fig. 10(a2) is becoming wide while all cases in Fig. 10(a2) have many special points resulting in much wider range. A special point even reaches 30, which indicates that the calculated structural residual displacement is 3000 percent less than the exact one if rolling friction coefficient is simplified as a mean value, ignoring its variability, to calculate the seismic response of the isolation system. Hence, it has to fully consider the variability of rolling friction coefficient when calculating the structural residual displacement. Any simplification of friction distribution will possibly cause significant errors. Because the structural residual displacement is just a special relative displacement when the structure stops moving, effects of variability of rolling friction coefficient on structural relative displacement will naturally influence the structural residual displacement. In addition, the structural motion direction, after the ground motion just stops, will also influence the structural residual displacement:
1) If the structure is moving away from the origin position, the structural residual displacement will change opposite to the variation trends of the rolling friction coefficient.
2) Otherwise, the structural residual displacement will change as well as the variable trends of the rolling friction coefficient.
Based on these influence factors, effects of variability of rolling friction coefficient on structural residual displacement are much larger than that on the structural maximum relative displacement.
As the mean value of rolling friction coefficient increases, its friction variability and the corresponding range of the main ratios in Fig. 10(b) are both reduced. However, the maximum ratio, associated with the average rolling friction coefficient of 0.03, still reaches 15.0.
Fig. 10Effects of rolling friction coefficient on structural residual displacement
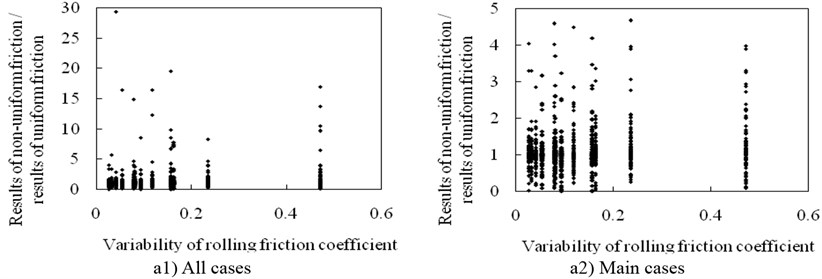
a) Influence of variability of rolling friction coefficient
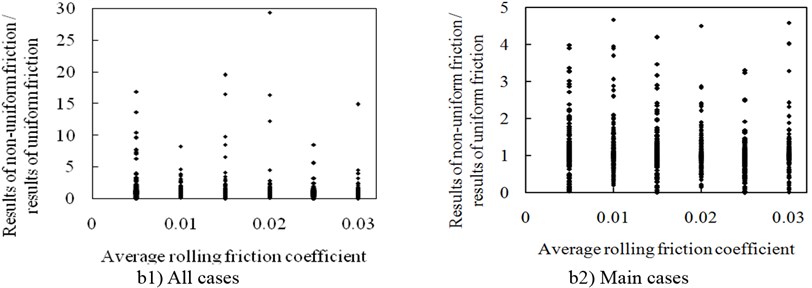
b) Influence of average rolling friction coefficient
5.2. Effects of other factors on structural residual displacement
As neither the damper nor the earthquake soil profile and PGA has the function of restoring the structure to the original position, they don’t have obvious influence on the range of the ratios of the structural residual displacement of the non-uniform friction distribution cases to that of the uniform friction distribution cases. Therefore, the corresponding figures are not presented herein.
6. Conclusions
By taking a rolling-damper isolation system under different ground motions as the study object, this paper analyzes the effects of non-uniform distribution of rolling friction coefficient on its isolation performance through a compiled computer program, and obtains the following conclusions:
1) The errors, due to ignoring non-uniform friction distribution, associated with the maximum structural relative displacement, acceleration and residual displacement are sequentially growing for the same variability of rolling friction coefficient, and this influence rule is weakened by the damper.
2) As for the cases of little friction variability and of large friction variability with large damper action, the maximum structural relative displacement and acceleration can be calculated ignoring non-uniform friction distribution, however, the calculation process of the structural residual displacement has to fully consider the influence of friction variability.
3) When the variability of rolling friction coefficient is large and the damping constant is little, the influence of non-uniform friction distribution should be fully considered to obtain the exact and safe results for all kinds of the structural seismic responses.
In this paper, as the earthquake acted on the rolling-damper isolation system, whose predominant periods are from 0.1 s~0.7 s and PGA are from 0.2 g~0.8 g, contains the characteristics of common earthquake, the induced conclusions are basically reliable and applicable to the similar isolation systems subjected to other common earthquakes.
Previously, many similar isolation systems are designed ignoring the variability of rolling friction coefficient. Based on the conclusions, however, these systems’ design results may be unsafe and needs to be re-examined. Furthermore, in the future, it is desirable to carry out more extensive research on the effects of non-uniform distribution of rolling friction coefficient on other isolation systems with friction action.
Note that the above conclusions are often destroyed by the detailed accelerogram shape, resulting in a few special points in Figs. 4-10. The relation between the structural response and the detailed accelerogram shape is a definitely difficult and unsolved problem, which is being studied by some researchers. Therefore, it is an interesting issue to study the combined effects of the friction variability and the detailed accelerogram shape on the isolation performance in the future.
References
-
Yang M. G., Li C. Y., Chen Z. Q. A new simple non-linear hysteretic model for MR damper and verification of seismic response reduction experiment. Engineering Structures, Vol. 52, Issue 4, 2013, p. 434-445.
-
Wei B. Study of the applicability of modal pushover analysis on irregular continuous bridges. Structural Engineering International, Vol. 21, Issue 2, 2011, p. 233-237.
-
Wei B., Xia Y., Liu W. A. Lateral vibration analysis of continuous bridges utilizing equal displacement rule. Latin American Journal of Solids and Structures, Vol. 11, Issue 1, 2014, p. 75-91.
-
Monfared H., Shirvani A., Nwaubani S. An investigation into the seismic base isolation from practical perspective. International Journal of Civil and Structural Engineering, Vol. 3, Issue 3, 2012, p. 451-463.
-
Wei B., Dai G. L., Wen Y., Xia Y. Seismic performance of an isolation system of rolling friction with spring. Journal of Central South University, Vol. 21, Issue 4, 2014, p. 1518-1525.
-
Jangid R. S., Londhe Y. B. Effectiveness of elliptical rolling rods for base isolation. Journal of Structural Engineering, Vol. 124, Issue 4, 1998, p. 469-472.
-
Jangid R. S. Stochastic seismic response of structures isolated by rolling rods. Engineering Structures, Vol. 22, Issue 8, 2000, p. 937-946.
-
Ou Y. C., Song J. W., Lee G. C. A parametric study of seismic behavior of roller seismic isolation bearings for highway bridges. Earthquake Engineering and Structure Dynamics, Vol. 39, Issue 5, 2010, p. 541-559.
-
Lee G. C., Ou Y. C., Niu T. C., Song J. W., Liang Z. Characterization of a roller seismic isolation bearing with supplemental energy dissipation for highway bridges. Journal of Structural Engineering, Vol. 136, Issue 5, 2010, p. 502-510.
-
Guerreiro L., Azevedo J., Muhr A. H. Seismic tests and numerical modeling of a rolling-ball isolation system. Journal of Earthquake Engineering, Vol. 11, Issue 1, 2007, p. 49-66.
-
Kurita K., Aoki S., Nakanishi Y., Tominaga K., Kanazawa M. Fundamental characteristics of reduction system for seismic response using friction force. Journal of Civil Engineering and Architecture, Vol. 5, Issue 11, 2011, p. 1042-1047.
-
Nanda R. P., Agarwal P., Shrikhande M. Base isolation system suitable for masonry buildings. Asian Journal of Civil Engineering, Building and Housing, Vol. 13, Issue 2, 2012, p. 195-202.
-
Wei B., Cui R. B., Dai G. L. Seismic performance of a rolling-damper isolation system. Journal of Vibroengineering, Vol. 15, Issue 3, 2013, p. 1504-1512.
-
Wang Y. J., Wei Q. C., Shi J., Long X. Y. Resonance characteristics of two-span continuous beam under moving high speed trains. Latin American Journal of Solids and Structures, Vol. 7, Issue 2, 2010, p. 185-199.
-
Harvey P. S., Gavin H. P. Double rolling isolation systems: a mathematical model and experimental validation. International Journal of Non-Linear Mechanics, Vol. 61, Issue 1, 2014, p. 80-92.
-
Standard of the Ministry of Communications of P. R. China. JTJ004-89 Specifications of Earthquake Resistant Design for Highway Engineering. China Communications Press, Beijing, 1989, (in Chinese).
-
Fahjan Y., Ozdemir Z. Scaling of earthquake accelerograms for non-linear dynamic analysis to match the earthquake design spectra. The 14th World Conference on Earthquake Engineering, Chinese Society for Earthquake Engineering, 2008.
About this article

This research is jointly supported by the National Natural Science Foundations of China under grant No. 51308549, 51378504 and 51108460, and the Scientific Research and Development Program of China Railway Corporation under grant No. 2013G002-A. The above support is greatly appreciated.
