Abstract
To estimate the earthquake damages of a large subway station built in soft ground, a soil-underground structure static and dynamic coupling interaction model is advanced with the strong nonlinear properties of soil modeled by a developed viscous-plastic constitutive model. The numerical modeling results show that the large underground structure in soft site has a large vertical relative deformation during the horizontal earthquake, which could be larger than its horizontal relative deformation. The dynamic deformation responses of the components near to the middle span of the underground structure are obviously larger those of the other components at the side spans, which means that these components near to the middle span are more apt to be damaged in horizontal earthquake. According to the horizontal relative deformation and the seismic damage process of the large underground structure, which limited elastic working state and the limited elastic-plastic working state are determined, and the maximal interlayer displacement angles are suggested to be 1/430 for the limited elastic working state and 1/185 for the limited elastic-plastic working state. In addition, the seismic soil pressure coefficients on the upper side wall have significant changes. To the large underground structure shown in this paper, the seismic soil pressure coefficients on the top half of the upper side wall should be defined alone in its seismic design.
1. Introduction
Urban railway transmit system has developed and acted as the main urban transmit tools in many cities such as New York, Paris, London, Moscow, and so on, and it has been looked as the more effective method to solve the urban traffic congestion for the large cities. With the rapid development of urban railway transit system in many large cities of word, the subway underground structures should not only undertake the basic functions of urban traffic but also satisfy the needs of urban business development, which is also the most important method to solve the budget deficit problems caused by the operation of urban railway transmit system. As a result, the structural styles of the subway underground structure become more and more complicated. Some engineering problems must be studied in time to satisfy the development of the urban railway transmit system, one of which is the seismic damage mechanics of these large underground structures for the subway stations.
In 1995 Kobe earthquake, the subway underground structures were damaged seriously [1-3]. Since then the seismic response of subway underground structure has been studied in further. For examples, some model tests have been done to estimate the seismic responses of subway underground structure [4-6]. However, model test isn’t a quantitative way to solve this problem. Numerical method is an effective method to estimate the nonlinear seismic response of large underground structure built in complicated foundation. Finite Element Method (FEM) has been used mainly to simulate the soil-underground structure nonlinear dynamic interaction [7-8].
However, many existed studies have mainly focused on the small underground structures built in stable site. In addition, some important effects have not been considered in these studies effectively, such as the dynamic contact behaviors on the interfaces between the soil and the structure, the nonlinear characteristics of the surrounding soil, the limited working state in different earthquake intensity, and so on. Accordingly, to the large underground structures built for the subway stations, we haven’t comprehend its seismic damage mechanics completely, which makes the great difficult to its seismic design by using the existed seismic design methods which have advanced just for the small and simple underground structure.
This paper therefore aims to estimate the seismic deformation and damage of a large underground structure built in soft site with irregular shape of transverse cross section. By this study, the seismic deformation characteristics of a large underground structure are analyzed in detail and some new findings are made by the FEM modeling. Then, its seismic damage conditions in different intensity earthquakes are compared and the different limited working states are decided firstly by the horizontal relative deformation and the seismic damages of the underground structure together. At last, the dynamic soil pressure responses on the side wall are also shown and the coefficients of dynamic earth pressure are also suggested for two different seismic limited working states. Some new findings in this paper can help us to comprehend the seismic damage mechanics of the large underground structures used in urban railway transmit system, and some conclusions can be referenced or used directly in their seismic design.
2. Constitutive model developed for soft soil
2.1. Yield function
Based on the generalized plasticity theory, the damage surface function for soil can be expressed as:
where, – effective mean normal stress, – deviatoric stress tensor, , – model parameters used to definite the dimension of the damage surface, – model parameters used to definite the dimension of the damage surface.
The yield function for the soil under cyclic loadings can be expressed as:
where, – kinematic deviatoric tensor defining the coordinates of the yield surface center in deviatoric stress subspace, – model parameters related to the dimension of the yield surface, – model parameters related to the dimension of the yield surface.
Fig. 1Yield surface in principal stress space and deviatoric plane
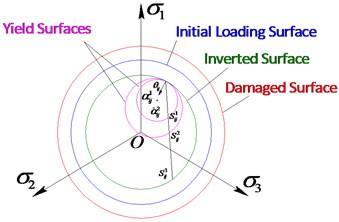
a) Deviatoric plane
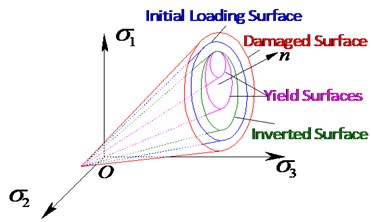
b) Effective principal stress space
The adopted yield function plotted in stress space forms a conical surface with its apex at point alone the hydrostatic axis, shown as Fig. 1. The flow rule for this model is based on the associated flow rule which assumes that the increment of plastic strain is coincident with the outward normal of the yield surface.
2.2. Hardening rule
According to the method developed by Wang et al. [9], the increment of the three hardening parameters in Eq. (2) are deduced to decide the sharp of the next yield surface. Generally, the hardening rule specifies the modification of the yield condition in the course of plastic flow. During the initial loading process, the isotropic hardening rule is used to model the continuous changing of the yield surface. Therefore, all the active yield surfaces have a same center in deviatoric stress subspace, and their dimensions change consecutively. The increment of hardening parameters to decide the dimension of the next yield surface is deduced and expressed as:
The deviatoric kinematic hardening rule is adopted to model the change of the yield surface for the soils under cyclic loading. The multi-yield surface concept is adopted herein to allow all yield surfaces translating in stress space with the stress point without changing in form, and they consecutively touch and push each other but cannot intersect. Therefore, the prior yield surface is defined as the reversed yield surface as soon as the loading reverses. Then, in the following loading process, all the active yield surfaces are tangent with the reversed yield surface at the reversed stress point and change along the direction defined from the center of the reversed yield surface in deviatoric stress subspace to the reversed stress point. Accordingly, the increment of the hardening parameters to decide the dimension of the next yield surface is given as:
where:
However, when the stress point lies outside the reversed yield surface, the isotropic hardening rule is used again to model the change of the next yield surface utile the unloading condition happening again and the kinematic deviatoric tensor remains on the hydrostatic axis at this time. The increment of the hardening parameters to decide the dimension of the active yield surface can be calculated by Eqs. (3)-(4). By the above hardening rule defined, the yield surface can expanded continuously after every loading increment.
2.3. Parameter identification
The initial shear modulus and bulk modulus are related to wave velocity and decided by:
where, is the mass density of soil, and are the shear and compression wave velocity respectively.
The parameter and can be decided by Mises’ damage condition and given by:
where, is the internal friction angle, is the cohesion of soil.
Under the irregular cyclic loading, the elastoplastic tangent modulus for soft soil is given as:
where, is the radius of the active yield surface in deviatoric stress plane, and is the radius of the corresponding damage surface in deviatoric stress plane and given by:
The plastic modulus can be given by:
At last, the constitutive equation can be written in incremental form as:
where is the deformation tensor, and the deviatoric deformation tensor.
Table 1Geology conditions of the site and model parameters of soils
Layer No. | Soil types | Thickness (m) | (MPa) | (kg/m3) | (°) | (MPa) | (m/s) | (m/s) | |
1 | Mucky soil | 5.5 | 25.0 | 1.92 | 12.6 | 3.5 | 0.49 | 114 | 198 |
2 | Silty clay | 16.5 | 47.9 | 1.87 | 12.0 | 2.7 | 0.49 | 160 | 277 |
3 | Silty sand | 17.0 | 105.8 | 1.90 | 35.0 | 4.2 | 0.49 | 236 | 410 |
4 | Clay | 21.0 | 126.3 | 2.02 | 21.0 | 5.3 | 0.49 | 250 | 433 |
The above constitutive model to evaluate the dynamic nonlinear characteristics of soft soil has been verified in tests [10]. To simulate the nonlinear deformation of the soil ground around the underground structure, this model has been implanted into the software Abaqus as a subroutine in Fortran computer language by author. The main model parameters are shown in Table 1. In Table 1, is the Poisson’s ratio of soil, and is the Young’s modulus of soil.
3. Modeling on the soil-underground structure interaction system
3.1. Dynamic contact between soil and underground structure
To evaluate the dynamic soil pressure on the side wall of the large underground structure, the dynamic contact mechanical model and the equilibrium equations can be established and solved by using different dynamic contact algorithms such as Lagrangian Multiplier Method and Penalty Function Method. These simulation methods are very practical in simulating the dynamic contact such as the large displacement sliding and separating on the interfaces between two different materials.
In the normal direction of interface, the normal contact compressive stress transfers mutually by the contact constraint. The nodes of element on the surface satisfy the Hooke Law and Harmonize Condition of Displacement. If the master surface is separated from the slaver surface, the contact constraint will be canceled and the contact boundary condition on the interfaces will be transformed to the common free boundary.
In the tangential direction of interface, the Tangential Contact Shear Stress (TCSS) is also transferred. If the value of TCSS is more than the critical value of the shear stress , slipping should taken place on the interface. The Coulomb’s Friction Law is used to simulate the tangential mechanics behaviors and can be expressed as:
where, is the friction coefficient between the soil and concrete, which is set to be 0.4 in this paper, is the normal contact stress on the interface.
3.2. Damage constitutive model for concrete
To investigate the seismic damage of the underground structure, the plastic damage constitutive model advanced by Lee Jeeho et al. [11] is used to model the nonlinear dynamic properties of concrete. The strength level of the concrete is C30, which model parameters are given in Table 2. It should be explained here that the tensile fractures have appeared on the surface of concrete structure when the tensile damage factor and the concrete has been damaged completely by the tensile stress after .
Table 2Model parameters for the concrete No. C30
Model parameters | Parameter values | Model parameter | Parameter values |
Elastic modulus (MPa) | 3.0×10⁴ | Initial yield tensile stress (MPa) | 2.4 |
Initial yield compressive stress (MPa) | 13.0 | Poisson‘s ratio | 0.15 |
Ultimate compressive stress (MPa) | 24.1 | Density (kg/m3) | 2450 |
Divergence angle (°) | 36.31 |
Table 3Relationship between the compressive stress and the compressive damage factor for the concrete
Plastic strain (%) | 0.0 | 0.12 | 0.16 | 0.20 | 0.24 | 0.36 | 0.50 | 1.00 |
Compressive stress (MPa) | 24.0 | 32.36 | 31.7 | 30.4 | 28.5 | 21.9 | 14.9 | 2.95 |
Damage factor | 0.0 | 0.3412 | 0.4267 | 0.5012 | 0.5660 | 0.7140 | 0.8243 | 0.9691 |
Table 3 shows the relationship between the compressive stress and the compressive damage factor for concrete C30. Table 4 shows the relationship between the tension stress and the tension damage factor for concrete C30.
Table 4Relationship between the tension stress and the tension damage factor for the concrete
Cracking displacement (mm) | 0.0 | 0.066 | 0.123 | 0.173 | 0.220 | 0.308 | 0.351 | 0.394 | 0.438 | 0.482 |
Tensile stress (MPa) | 2.4 | 1.617 | 1.084 | 0.726 | 0.487 | 0.219 | 0.147 | 0.098 | 0.066 | 0.042 |
Damage factor | 0.0 | 0.381 | 0.617 | 0.763 | 0.853 | 0.944 | 0.965 | 0.978 | 0.987 | 0.992 |
3.3. Earthquake waves inputted from bedrock
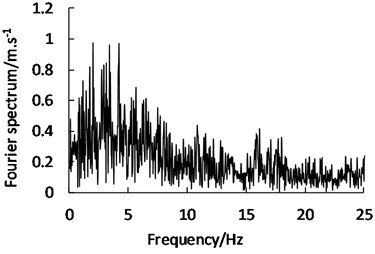
The strong ground motion recorded in 1995 Kobe earthquake (KB wave) and the Nanjing artificial earthquake wave (NJ wave) are used as the inputted ground motions from the bedrock in the horizontal direction. KB wave was recorded during the Kobe earthquake in Jan 17, 1995. It is a representative near-field earthquake wave with the epicentral distance being 0.4 km, which main frequency ranges of vibration are from 0.5 to 4 Hz. The NJ wave is calculated by software COMPSYN which has been developed by Institute of Engineering Mechanics (IEM), China Earthquake Administration. NJ wave belongs to a medium-field earthquake wave with the main frequency of vibration ranging from 0.7 to 8 Hz. Fig. 2 and Fig. 3 show the original acceleration time-histories and the Fourier spectra of these two earthquake waves.
Fig. 2Earthquake waves used as the ground motions inputted from bedrock
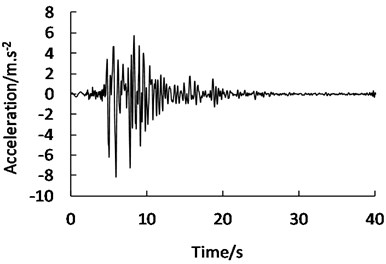
a) KB wave
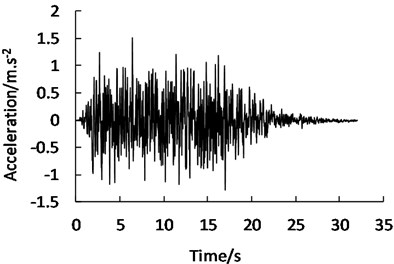
b) NJ wave
Fig. 3Fourier spectra of the two earthquake waves
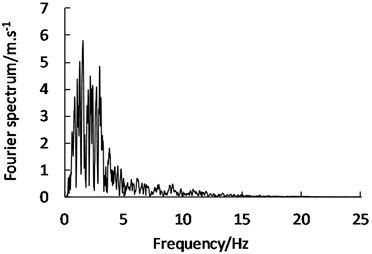
a) KB wave
b) NJ wave
3.4. Finite element meshes
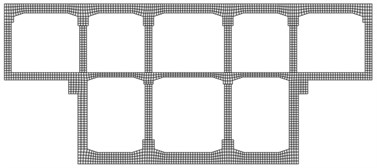
The dimensions of the large subway underground structure are shown in Fig. 4. The whole interaction system is meshed by using four-node plane strain elements except the steels meshed by the two-node beam elements. The stiffness discount method is used to equal the three-dimensional middle columns to be a 2-D continuous wall with 0.8 m in thickness. The equivalent elastic modulus of concrete for the columns is about 3.85×10³ MPa. The reinforcing steels are implanted into the concrete and the sliding between concrete and steel is neglected. The equivalent elastic modulus of steel is 1.2×10⁶ MPa for 2-D model. The finite-element meshes of the interaction system are shown in Fig. 5.
The standard calculated module of software Abaqus 6.10 is used to analyze this dynamic problem. Arbitrary Lagrangian Eulerian (ALE) adaptive meshing method is used to maintain a high-quality mesh throughout an analysis, even when large deformations or losses of soil occur, by allowing the mesh to move independently of the material.
Fig. 4Cross sectional dimensions of the large subway underground structure
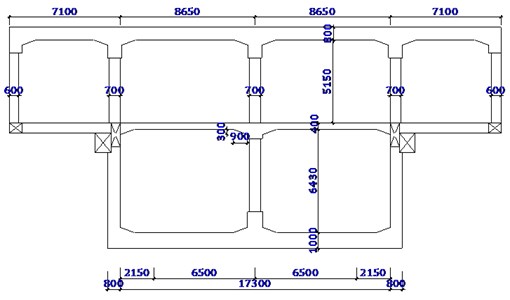
Fig. 5Finite-element meshing plan of the soil-structure interaction system
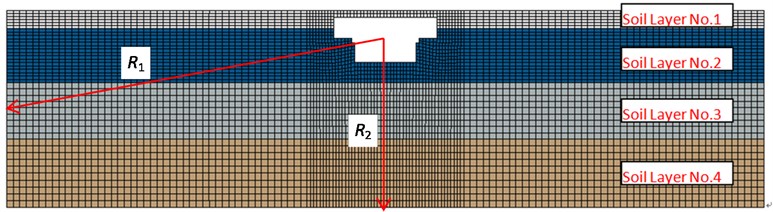
a) Finite-element meshes of soil foundation
b) Finite-element meshes of subway station
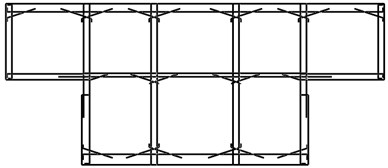
c) Finite-element meshes of reinforcing steels
4. Results and analysis
4.1. Deformation responses of the interaction system
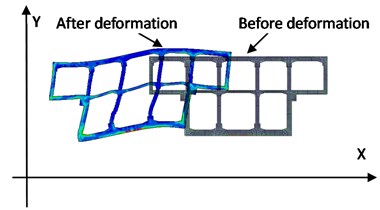
When the relative Interlayer Horizontal Displacement (IHD) between the top and the bottom of underground structure comes to be the maximum value, the dynamic deformation shape of the whole underground structure amplified by 50 times is shown in Fig. 6. By Fig. 6, the underground structure has large relative IHD in the horizontal earthquake, and the IHD of the under layer is also obvious larger than that of the upper layer, which should be mainly caused by the different lateral stiffness of the underground structure for different layer. However, the large vertical relative deformation response of the underground structure has also been found in Fig. 6 in the horizontal earthquake, which isn’t consist with the assumptive fixed bearing in vertical direction at the bottom in the simplified seismic design method for the general underground structure. According to this new finding, the large vertical relative deformation response should also be considered in the horizontal seismic design of the large underground structure.
In addition, according to Fig. 6, the dynamic deformation responses of components near to the middle span of the structure are obviously larger those of the other components at the side spans. Especially, the bending deformations at the bottom end of columns in the bottom layer are larger obviously than those of other components.
Fig. 6Dynamic deformation shape of the large underground structure when PGA = 2.0 m/s2
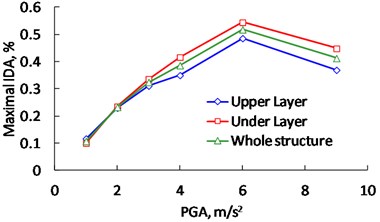
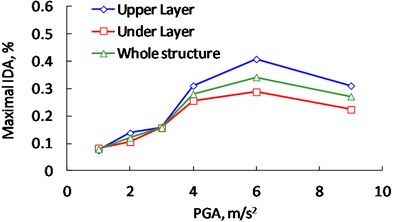
For different PGA of inputted ground motions, the change rules of the Interlayer Displacement Angles (IDA) are similarity. Fig. 7 shows only the relationship between the maximal IDA of underground structure and the PGA of inputted ground motions when KB wave is inputted from bedrock. By Fig. 7(a), the maximal IDAs remain increasing linearly with the PGA changing from 1.0 m/s2 to 6.0 m/s2. When the PGA is 6.0 m/s2, the maximal IDA reaches to be 1/185 for the under layer and 1/206 for the upper layer. However, the maximal IDA decreases with the inputted PAG changing from 6.0 m/s2 to 9.0 m/s2. This change may be caused by the earthquake damages of soils under the structure. That is to say, when the inputted PGA is 9.0 m/s2, the soils under the underground structure should be soften so seriously that it becomes a natural isolation layer to the seismic responses of the underground structure. The advanced research about this problem should be done in further to explain this phenomenon. In addition, when the inputted PGA is larger than 2.0 m/s2, the maximal IDA of under layer becomes more and more larger than those of the upper layer, which proves that the inputted PGA has more effect on the seismic responses of under layer.
Fig. 7Relationship between the maximal IDA of underground and the inputted PGA
a) To the right
b) To the left
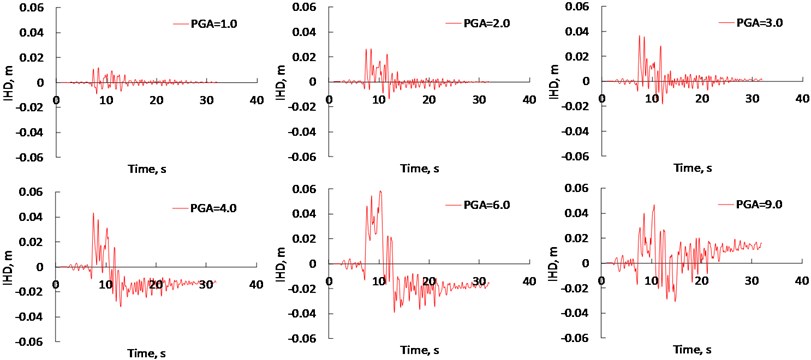
Fig. 8 shows the time-histories of IHD with different inputted PGAs of KB wave. By Fig. 8, when the inputted PGA is smaller or equal to 2.0 m/s2, the IHD of underground structure at the end of earthquake return to zero, which means that the underground structure have no residual horizontal deformation. However, when the inputted PGA is larger than 2.0 m/s2, the IHD of underground structure at the end of earthquake cannot return to initial condition, which means that the underground structure have obvious plastic deformation during the earthquake. This kind of residual deformation should induced larger residual seismic forces remaining in the underground structure after strong earthquake.
According to above analysis, we can use the maximal IDA as the suggested IDA for the elastic working state of this large underground structure when the inputted PGA is 2.0 m/s2, which value is about 1/430. Compared with the suggested elastic IDA for different kinds of structures in China Code for Seismic Design of Buildings, the earthquake resistant behavior of the large underground structure is better than that of the general reinforced concrete structures.
Fig. 8Time histories of interlayer horizontal displacement for different inputted PGA
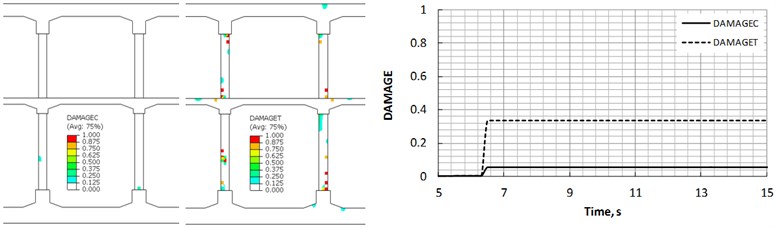
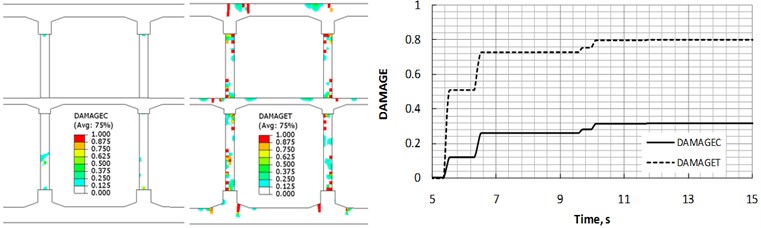
4.2. Earthquake damages of the large underground structure
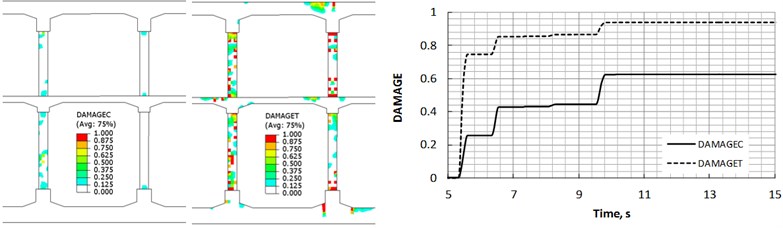
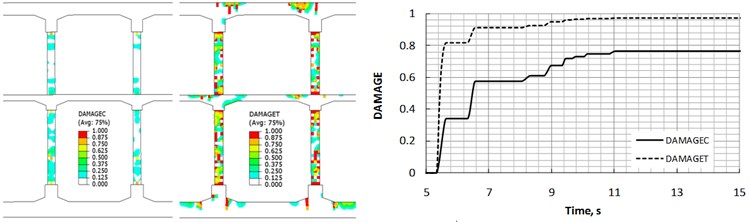
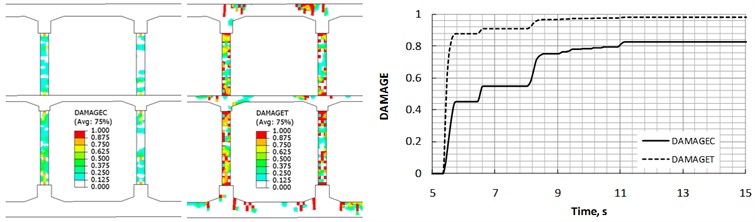
Since the components near to the middle span of the underground structure maybe damaged more seriously than the other components, Fig. 9 shows the seismic damages of the middle columns and the middle slabs only. By Fig. 9, the tension damages take place firstly, and then the compressive damages take place in sequent. With the PGA increasing, the damage degree of the underground structure aggravates obviously. By Fig. 9(a), when the PGA is 1.0 m/s2, the whole structure remains in undamaged state except several points on the surface of columns are damaged by tension stress slightly. However, by Fig. 9(b), when the PGA is 2.0 m/s2, serious tension damages have taken place at the ends of the columns and slabs. The slightly compressive damages also have taken place at the left columns.
When the PGA is 3.0 m/s2, the severe tension damages have extended to the whole ends of right columns in the upper layer. When the PGA increases to 4.0 m/s2, the whole bodies of columns have been damaged by tension stress and the middle slabs are also damaged by tension stress at their upper sides. In addition, the compressive damages have taken place at the most cross sections of the columns. In general, the compressive damages of the columns in under layer are more seriously than those of columns in upper layer. With the PGA increasing to 6.0 m/s2, the whole bodies of columns on the left side have not only been almost damaged by the compressive stress but also been damaged completely by the tension stress. In addition, the top middle slabs are also damaged seriously at their upper side by tension stress. As a whole, the columns in under layer are damaged more severely than those in upper layer.
By Fig. 9 and Fig.8 together, we can make the following conclusions firstly: When the PGA is 6.0 m/s2, the underground structure should be working in the limited elastic-plastic state. When the PGA is 2.0 m/s2, the underground structure should be working in the limited elastic state. Accordingly, to the large underground structure shown in this paper, the suggested limited elastic IDA is about 1/430 and the limited elastic-plastic IDA is about 1/185.
Fig. 9Earthquake damages of large underground structure with different inputted PGA
a) PGA 1.0 m/s2
b) PGA 2.0 m/s2
c) PGA 3.0 m/s2
d) PGA 4.0 m/s2
e) PGA 6.0 m/s2
4.3. Dynamic contact responses on the side wall
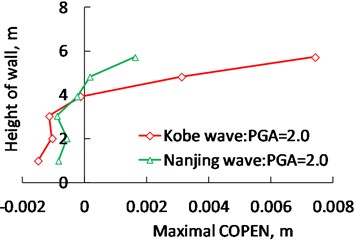
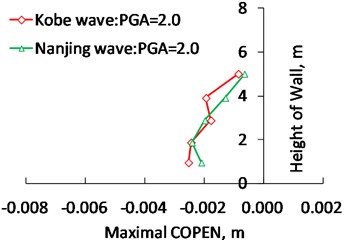
Since the underground structure is buried deeply in the soils, the contact interfaces between the soils and the underground structure will probably separate from each other during the strong earthquake, which will affect the deliver process of interaction force between soil and structure. Accordingly, Fig. 10 shows the time histories of interaction force on the top of upper side wall. The contact opening (COPEN) on the interfaces between soil and side wall are also shown in Fig. 11 when the PGA is 2.0 m/s2. It should be explained here that the value of COPEN should be positive if the soils separate from the structure.
Fig. 10Time histories of contact press between the soil and the top part of upper wall
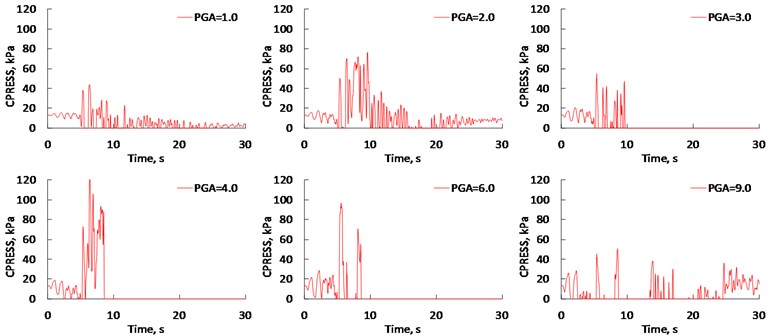
Fig. 11The values of COPEN on the side walls of underground structure
a) Upper side wall
b) Under side wall
By Fig. 10, when the PGA is smaller or equal to 2.0 m/s2, the contact response between soil and the top part of side wall covert from contacting to separating in turn. However, with the PGA increasing from 2.0 m/s2 to 6.0 m/s2, the soil separates from the top part of side wall always after some time during the earthquake. By Fig. 11, the soil separates from the top part of upper side wall and the separated area distributes from the top to the 2/3 height of the upper side wall when the inputted PGA is 2.0 m/s2. However, the separation didn’t take place between the soil and the under wall during the whole process of earthquake with different inputting PGA.
As far as the horizontal earthquake is concerned, the dynamic earth pressures on the side walls are very important loads in the seismic design of the underground structure. Accordingly, Fig. 12 shows the maximal static-dynamic coupling earth pressures on the walls of structure. In general, the maximal soil pressures have rising tendency with the PGA increasing. Especially, the maximal soil pressures on the upper wall increase obviously, which means that the PGA has more effect on the maximal dynamic earth pressure response on the upper side wall of the large underground structure.
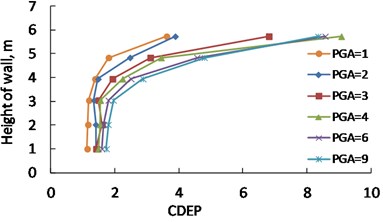
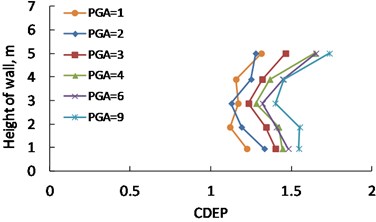
Fig. 13 shows the ratios of the maximal static-dynamic coupling earth pressure to the initial static earth pressure, which is also defined as the Coefficient of Dynamic Earth Pressure (CDEP) in this paper. By Fig. 13(a), the CDEPs increase quickly from the middle part to the top of the upper side wall. To the under wall, the CDEPs change in a limited range from 1.15 to 1.8 along the whole height by Fig. 13(b). Accordingly, when the pseudo-static calculated method is used for the seismic design of underground structure, the CDEPs at the top of upper side wall should be considered separately.
Fig. 12The static-dynamic coupling earth pressures on the side walls
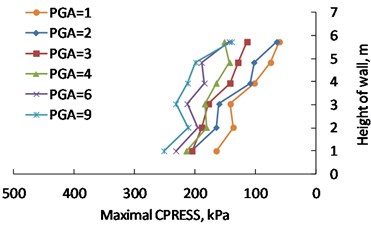
a) Upper side wall
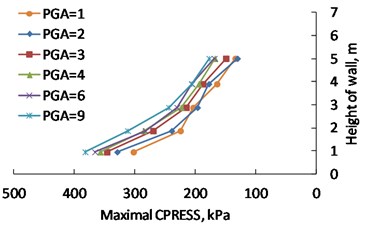
b) Under side wall
Fig. 13Ratios of the static-dynamic coupling earth pressure to the static earth pressure
a) Upper side wall
b) Under side wall
To the large underground structure remaining in limited elastic state when the PGA is 2.0 m/s2, the CDEP change from 1.14 to 1.20 for the lower half of the upper wall and from 1.20 to 3.62 for the top half of the upper wall. To the under wall, the CDEPs change from 1.12 to 1.31. As far as the earthquake safety is concerned, the upper limit is suggested to be used as the CDEP when the underground structure remaining in limited elastic state. Accordingly, the CDEPs are suggested to be 1.20 for the lower half of upper wall and 2.4 for the top half of upper wall and 1.3 for the whole under wall.
To the underground structure working in limited elastic-plastic state when the PGA is 6.0 m/s2, the CDEPs change from 1.6 to 1.8 for the lower half of the upper wall and from 1.8 to 8.6 for the top half of the upper wall. To the under wall, the CDEP changes from 1.32 to 1.65. As far as the earthquake safety and the engineering economy are concerned together, the average value between the upper limit and the lower limit of the change range is suggested to be used as the suggested CDEP when the underground structure remaining in limited elastic-plastic state. Accordingly, the CDEP are suggested to be 1.7 for the lower half of upper wall and 5.2 for the top half of upper wall and 1.5 for the whole under wall.
5. Conclusions
With the dynamic contact on the interfaces between soil and concrete, the strong nonlinear properties of materials and the spectrum characteristics of the inputted ground motions, the FEM simulation model for estimating the soil-underground structure static and dynamic coupling interaction system is made.
By this FEM modeling, the different limited working states of the large underground structure are decided firstly according to the horizontal relative deformation and the seismic damages of underground structure together. The maximal interlayer displacement angles are suggested to be 1/430 for the limited elastic working state and 1/185 for the limited elastic-plastic working state. Compared with the suggested values for the different kinds of structures in China Code for Seismic Design of Buildings, the earthquake resistant behavior of this large underground structure is better than that of the general reinforced concrete structures.
The seismic damages of this large underground structure are also analyzed. It proves that the columns are more apt to be damaged than the walls and the slabs. In general, the components at or near to the mid-span of the structure are damaged more severely than the others. In addition, the under layer is damaged more seriously than the upper layer and the bottoms of column are damaged more severely than the top of columns.
In addition, at the top of upper side wall, the soil separate from the upper side wall of the structure obviously during the strong earthquake and the separation area is about from the top to the 2/3 height of the upper wall. By the results, the Coefficients of Dynamic Earth Pressure (CDEP) are also suggested for two different limited working states. To limited elastic working state, the CDEPs are suggested to be 1.20 for the lower half of the upper wall and 2.4 for the top half of the upper wall and 1.3 for the whole under wall. To the limited elastic-plastic working state, the CDEP are suggested to be 1.7 for the lower half of the upper wall and 5.2 for the top half of the upper wall and 1.5 for the whole under wall.
References
-
Huo H., Bobet A., Fernández G., Ramírez J. Load transfer mechanisms between underground structure and surrounding ground: evaluation of the failure of the daikai station. Journal Geotechnical Geoenvironment Engineering, Vol. 131, 2005, p. 1522-1533.
-
Zhuang Haiyang, Cheng Shaoge, Chen Guoxing Numerical emulation and analysis on the earthquake damages of Dakai subway station caused by the Kobe earthquake. Rock and Soil Mechanics, Vol. 29, Issue 1, 2008, p. 245-250.
-
Huo Hongbin, Bobet Antonio Seismic design of cut and cover rectangular tunnels-evaluation of observed behavior of Dakai station during Kobe earthquake, 1995. Proceedings of 1st World Forum of Chinese Scholars in Geotechnical Engineering, Tongji University, Shanghai, 2013, p. 456-466.
-
Chen G. X., Wang Z. H., Zuo X., et al. Shaking table test on the seismic failure characteristics of a subway station structure on liquefiable ground. Earthquake Engineering and Structural Dynamics, Vol. 42, Issue 10, 2013, p. 1489-1507.
-
Zhuang Haiyang, Chen Guoxing, Du Xiuli, Li Liang, Zuo Xi Analysis on the earthquake response of subway station built in liquefaction soils by large-scale shaking table testing. Earthquake Engineering and Engineering Vibration, Vol. 27, Issue 4, 2007, p. 94-97.
-
Wang Ming-Wu, Susumu I. A. I. Dynamic centrifuge tests for seismic responses of underground steel structures in the liquefiable soils. Journal of Hunan University (Natrual Sciences), Vol. 35, Issue 11, 2008, p. 45-48.
-
Jun Seong Choi, Lee Jong She, Jae Min Kim Nonlinear earthquake response analysis of 2-D underground structures with soil-structure interaction including separation and sliding at interface. 15th ASCE Engineering Mechanics Conference, Columbia University, USA, 2002, p. 1-8.
-
Berna Unutmaz 3D liquefaction assessment of soils surrounding circular tunnels. Tunnelling and Underground Space Technology, Vol. 40, 2014, p. 85-94.
-
Wang Jianhua, Yao Minglun Elastoplastic simulation of the cyclic undrained behavior of soft clays. Chinese Journal of Geotechnical Engineering, Vol. 18, Issue 3, 1996, p. 11-18.
-
Zhuang Hai-yang, Chen Guo-xing Father analysis on the dynamic viscous-plastic memorial nested yield surface model of soil. Rock and Soil Mechanics, Vol. 30, Issue 1, 2009, p. 118-122.
-
Lee Jeeho, Gregory L. Fenves Plastic-damage model for cyclic loading of concrete structures. Journal of Engineering Mechanics, Vol. 124, Issue 4, 1998, p. 892-900.
About this article

This research work is supported by the research projects from National Natural Science Foundation of China (Grant No. 51278246). These supports are gratefully acknowledged. All statements, results and conclusions are those of the authors and do not necessarily reflect the views of NSFC.
