Abstract
This study reveals the existence of mode tracking errors in the flutter analysis based on the piecewise quadratic interpolation of aerodynamic forces. To solve the problem, a predictor-corrector scheme for mode tracking is added into the piecewise quadratic interpolation method. Numerical results indicate that method proposed provides right and accurate mode tracking.
1. Introduction
The linear flutter analysis of the subsonic aeroelastic systems is a dynamic aeroelastic stability problem and the dynamic equation used for flutter analysis can be obtained via the modal approach. Then, the stability boundary of the aeroelastic system is determined by solving the nonlinear quadratic eigenvalue problem of the dynamic equation. Most methods for flutter analysis require the interpolation of aerodynamic forces in frequency domain and the iteration procedure for solving nonlinear eigenvalue problems [1-3]. However, the iteration method used for solving the flutter equation not only increases the calculation time but also probably causes the problems with convergence. Goodman [4] proposed an excellent approach to converting the problem of flutter analysis to a piecewise linear quadratic eigenvalue problem. In his study, the reduced frequency range are divided into 1 segments with break points so that the functional relation between the generalized aerodynamic force and the reduced frequencies can be expressed approximately using the piecewise quadratic interpolation (PQI). The approach, however, does not impose any constraints on the first-order derivative of the interpolation functions so that the eigenvalues may be discontinuous on the segment boundaries, exhibiting gaps or overlaps. Eller [5] proposed an improved method by dividing the reduced frequency range into 2 segments with 1 break points, keeping the continuity of the first-order derivative of interpolation functions on the segment boundaries. The PQI method in Eller’s scheme is C1 continuous on the stability boundary, providing an inherent facility to reduce the possible discontinuities at large damping values to arbitrarily small levels. Therefore, neither mode tracking nor blending of roots is required. However, because the construction of the interpolation function of the generalized aerodynamic force depends on the choice of the reduced frequencies, if they are not chosen properly and the number of segments is not large enough, a sudden jump of structural modes may occur. The main reason for such a phenomenon is that two or even more roots are kept in the same segment but not sorted. If these roots are not tracked effectively, the flutter mode may not be determined accurately.
The objective of this study is to make a study on the flutter analysis of the aircraft model with closely spaced modes. Firstly, the methodology of the PQI of the generalized aerodynamic forces is introduced. Then, a Predictor-Corrector scheme based on the perturbation theory of eigenvalues [6] is developed for tracking the modal damping and frequency of the PQI’s flutter solution. To verify the accuracy of the Predictor-Corrector-based mode tracking and the flutter solution, a comparison between the PQI method and the P-K method is illustrated through a 15-degree sweptback wing model. At last, the PQI-based flutter analysis method with mode tracking is applied for flutter analysis of a complicated aircraft model with closely spaced modes.
2. Methodology of the piecewise quadratic interpolation based flutter analysis
2.1. Piecewise quadratic interpolation of the generalized aerodynamic forces
The dynamic equation used for flutter analysis can be transformed into the following equation by using the Laplace transform [7]:
where , , and are the generalized mass, damping and stiffness matrices, respectively. , , and are the reference length of half-chord, air density and the flow speed, respectively. The generalized aerodynamic force depends on the eigenvalue , and can be computed via the doublet-lattice method [8]. The complex eigenvalue can be written as where is the damping and is the reduced frequency.
Because is a nonlinear asymmetric matrix, the direct solution of Eq. (1) can be computed by using the iterative methods. Typically, the eigenvalue problem is solved by introducing a parameter and computing the generalized aerodynamic force . Combing with a search or optimization procedure, the linear eigenvalues are computed and the eigenvalues equal to the parameter are saved as the solutions of the nonlinear Eq. (1). However, the iteration method not only increases the calculation time but also probably causes the problems with convergence. To improve the efficiency of the solution procedure, in this study, the relationship between and is approximated by the following piecewise quadratic function:
where , , are the complex-valued coefficient matrices. and are the number of segments and the breakpoint of the reduced frequency range. The advantage of the piecewise quadratic function of is that it converts the problem of nonlinear iteration procedure into a piecewise, linear quadratic eigenvalue problem. Moreover, because the Eq. (2) fulfills the Cauchy-Riemann equation [9] [defined in Eq. (3)], Eq. (2) can be constructed along the imaginary axis over the full complex plane. At the same time, it can be seen that Eq. (2) provides a second-order approximation of the variation with :
The procedure of piecewise quadratic interpolation of aerodynamic forces can be illustrated as follows. At first, the generalized aerodynamic matrices are computed at different reduced frequencies (1, 2,…, ) by using the doublet-lattice method. Then, the 1 breakpoints for the piecewise interpolation are chosen as:
For each segment, three conditions must be satisfied. At first, the generalized aerodynamic forces on the boundaries must be matched exactly. Then, the slope values on the boundaries need to be matched. At last, the discrete values are interpolated exactly. The mathematical descriptions of the three conditions can be written as follows:
For the first and last segment, the conditions are modified to interpolate the generalized aerodynamic forces at the first and last reduced frequencies, respectively. For the first segment, the first condition [defined in Eq. (7)] is modified by the following formula:
For the last segment, the third condition [defined in Eq. (9)] replaced by:
Because the conditions are related between two neighboring segments, these conditions can be expressed in the matrix form by using the partitioning and assembly of matrices and the coefficient matrices (, , ) can be solved through the matrix transformation. For instance, the coefficient matrices (, , ) of Eq. (2) to be solved at the first and last segments can be written as:
where (, , ) are the coefficient matrices for the th segment, and are the row and column indexes in the matrix. is the generalized aerodynamic force at reduced frequency.
2.2. Predictor-corrector based mode tracking
Once the piecewise quadratic function of is available, Eq. (1) can be recast as:
Because is only valid within the th segment, the eigenvalues of Eq. (13) which yield the condition of is kept. If there is no any eigenvalue satisfying the condition, it needs to continue to solve the eigenvalues by using the next segment function of until the corresponding eigenvalues of each mode at a given flow speed are obtained. The process is implemented repeatedly at each flow speed and the flutter boundary and mechanism can be determined by drawing the - and - diagrams. It is noted that if the corresponding eigenvalues of all modes with belong to different segments, the correspondence between the modes and eigenvalues due to the variation of flow speeds should be determined accurately. However, if there are two or even more eigenvalues kept in the same segment, then the mode tracking phenomenon will occur.
The issue of eigenvalue tracking can be handled by means of a Predictor-Corrector scheme which is based on the perturbation theory of eigenvalues. The forecast method is developed so as to track all modes during the flutter analysis. At the -th flow speed , the Predictor-Corrector scheme uses the eigenvalues and the corresponding left and right eigenvectors to estimate eigenvalues at the next flow speed . The estimated eigenvalues can be computed as follows:
where:
and are the left and right eigenvectors at the flow speed , respectively. Once the estimated eigenvalues are available, the eigenvalues can be sorted according to the estimated values. According to the minimal Euclidean metric between and , the correspondence between the modes and the eigenvalues can be determined accurately. The minimal Euclidean metric can be computed as follows:
where:
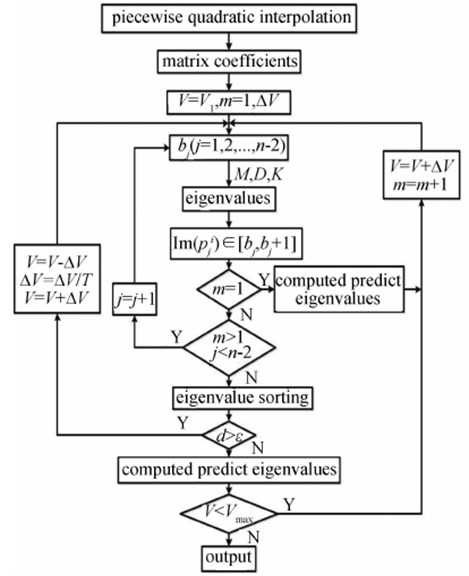
In order to avoid the failure of the mode tracking scheme when applied the case with a larger step size of the flow speed, a threshold level should be set such as 0.001. For the large step size of the flow speed, when , it is needed to decrease the step via the factor (), and recalculate the eigenvalues and sort them. The block diagram of the PQI method with predictor-corrector based mode tracking for flutter analysis is shown in Fig. 1.
3. Illustrative example
In this section, a 15-degree sweptback wing is illustrated as a test model to demonstrate the accuracy of the present PQI method with mode tracking in flutter analysis. Then, the present methodology is applied to predict the flutter boundary of an advanced fighter aircraft with closely spaced modes.
Fig. 1The flow diagram of the PQI method with mode tracking
3.1. Subsonic flutter analysis of a 15-degree sweptback wing
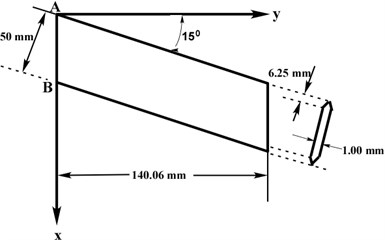
The 15-degree sweptback wing model is a standard example of flutter analysis in MSC Nastran. The modal parameters, such as the generalized mass, stiffness, and mode shapes were obtained from the MSC Nastran result file. The unsteady aerodynamic forces are computed by using the doublet-lattice method. Fig. 2 shows the configuration of the 15-degree sweptback wing model. For the flutter analysis of 15-degree sweptback wing model, the first four dominant modes were used. The mode shapes and natural frequencies of the four dominant modes are shown in Fig. 3.
Fig. 2Configuration of the 15-degree sweptback wing model
In the case study, the mode tracking problem and the accuracy of the PQI method with mode tracking are illustrated and verified The reduced frequency range is selected as 0.0-1.0 and divided into 50 segments to construct the piecewise quadratic function for each segment. The flow speed range for flutter analysis is from 10 m/s to 220 m/s and the step size of flow speed is 5 m/s. Fig. 4 shows the - and - diagrams computed via the PQI method without mode tracking. The computed dampings and frequencies of the second and third modes exchange each other all of a sudden. To clearly illustrate the reason for such a phenomenon, Table 1 gives the imaginary parts of the eigenvalues and the corresponding reduced frequency segments. As shown in Table 1, when the flow speed increases to 60 m/s, there are two roots with kept in the same reduced frequency segment (0.05-0.07) but not sorted. This phenomenon can also been found when the flow speed increases to 80 m/s, 85 m/s, and 90 m/s, respectively.
Fig. 3Four dominant natural modes of the 15-degree sweptback wing model
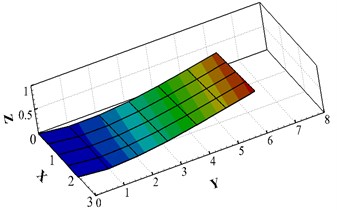
a) The first mode (bending), 34.24 Hz
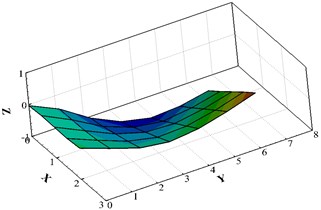
b) The second mode (torsion), 196.2 Hz
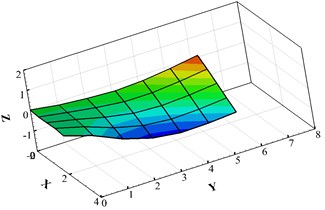
c) The third mode (torsion), 240.34 Hz
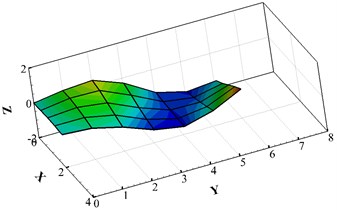
d) The fourth mode (bending), 563.01 Hz
Fig. 4The solutions of PQI method without mode tracking
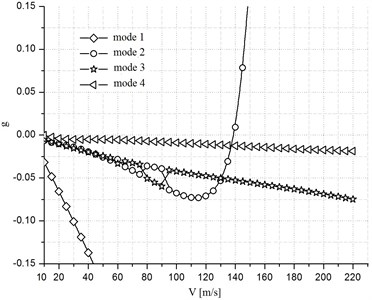
a)- plot
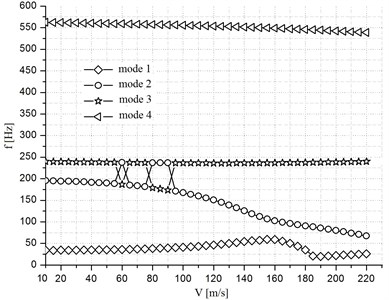
b)- plot
Fig. 5 shows the - and - diagrams computed by the PQI method with mode tracking and the results are also compared with the P-K method. As shown in Fig. 4, the mode tracking problem of the PQI method is well handled by using mode tracking. Moreover, Fig. 5 also illustrates that the flutter boundary predicted via the PQI method gets a good agreement with the P-K method. However, there are small disagreements between the solutions of the damping ratios when the flow speed is lower than 185 m/s. When the flow speed is equal or greater than 185 m/s, there is a sudden jump of the damping of first mode computed via the P-K method. The reason is that the computed damping and frequency of the mode 1 are exchanged with the aerodynamic lag roots all of a sudden [10]. In contrast to the P-K method, the PQI method tracks all eigenvalues very well. The reason is that the PQI method provides a second-order approximation of the variation with . It is noted that the eigenvalues with should be considered to be dubious regardless of the method of solution. Because it is difficult to extrapolate the strongly damped aerodynamic forces from the undamped aerodynamic forces via the piecewise quadratic interpolation.
Fig. 5The solutions of PQI method with mode tracking and PK method
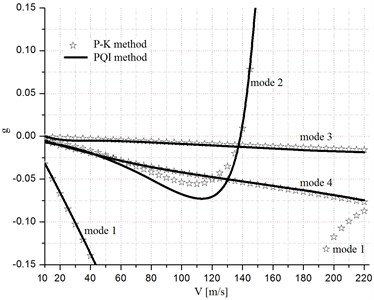
a)- plot
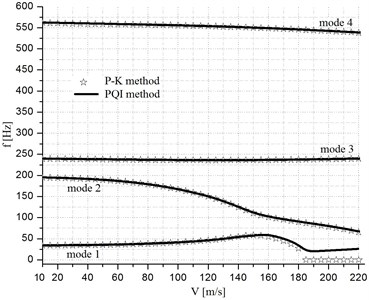
b)- plot
Table 2 gives the real and imaginary parts of the eigenvalues () where exceeds The variation of the imaginary part of the fourth diagonal element of the generalized aerodynamic forces with the increase of is shown in Fig. 6. For the case of 0, the aerodynamic forces are computed directly byusing the doublet-lattice method. For the case of 0, the aerodynamic forces are computed via Eq. (2). For the large damping values such as , there is a comparatively large deviation for the generalized aerodynamic forces. Therefore, for the large damping values, the aerodynamic forces should be computed directly via other methods, such as the computational fluid dynamics (CFD) method.
Table 1Reduced frequencies of mode tracking
Flow speed, m/s | ||||
60 | 80 | 85 | 90 | |
of mode 2 | 0.051 | 0.036 | 0.034 | 0.031 |
of mode 3 | 0.064 | 0.048 | 0.045 | 0.043 |
segment | 0.05-0.07 | 0.03-0.05 | 0.03-0.05 | 0.03-0.05 |
Table 2The eigenvalues of mode 1 at different flow speeds
Flow speed, m/s | ||||
185 | 200 | 210 | 220 | |
–0.4400 | –0.4895 | –0.5476 | –0.6200 | |
0.0192 | 0.0196 | 0.0204 | 0.0209 | |
3.2. Flutter analysis of the advanced fighter aircraft
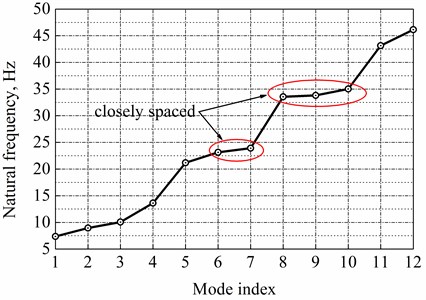
To verify the accuracy of the present PQI method with mode tracking in the practical engineering application, the flutter boundary of an Advanced Fighter Aircraft (AFA) with closely spaced modes is illustrated. Fig. 7 shows the configuration of the AFA model with control surfaces. It is a test bed for AeroServoelastic (ASE) analysis, and each wing of the AFA model has four control surfaces. The green-shaded areas of the AFA model denote the Leading-Edge Inboard (LEI) and Leading-Edge Outboard (LEO) control surfaces. The yellow-shaded areas denote the Trailing-Edge Inboard (TEI) and Trailing-Edge Outboard (TEO) control surfaces, respectively. The red–shaded area illustrates the tip ballast store of the AFA model. The finite element model of AFA is modeled for structural design optimization. The finite element model has an all movable horizontal tail and four control surfaces on each wing. The structural model consists of 1276 grid points and 4449 elements, and has 3761 free degrees of freedom with symmetric boundary conditions. Fig. 8 shows the finite element model of AFA, and more details on this model can be found in Ref [11-13]. In this study, the first 12 structural modes are chosen for flutter analysis. Fig. 9 shows the natural frequencies of the first 12 structural modes. As shown in the figure, the natural frequencies of the sixth and seventh modes are 23.149 Hz and 23.919 Hz, respectively. The frequency interval is merely 0.77 Hz. Moreover, the natural frequencies of eighth and ninth modes are 33.547 Hz and 33.818 Hz, respectively. The frequency interval of these two modes is only 0.271 Hz. Thus, this figure demonstrates that some of the modes are very close with each other. In this case, the closely spaced modes may induce the mode tracking problem during the flutter analysis.
Fig. 6Generalized aerodynamic forces vs. reduced frequency at different g
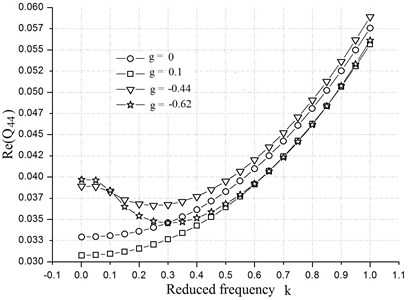
Fig. 7Configuration of the generic advanced fighter aircraft
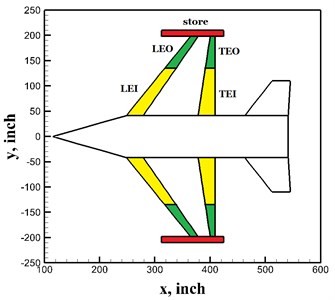
Fig. 8Finite element model of AFA
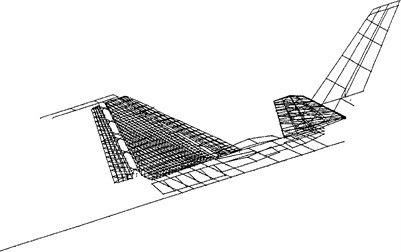
Fig. 9Natural frequencies of the generic advanced fighter aircraft
For the present test case, the reduced frequency range is 0.01-0.8 and the frequency range is divided into 60 segments to construct the piecewise quadratic functions. The range of the flow speeds for flutter analysis is from 120 m/s to 360 m/s and the step size is 5 m/s. Fig. 10 shows the - and - diagrams by the PQI method without mode tracking. As shown in the figure, the mode tracking problem occurs between the fifth and sixth modes and this phenomenon can also be found among mode 8, mode 9, and mode 10. From this figure, one can find that, for the AFA mode with closely spaced modes, the mode tracking problem is more serious. Fig. 11 shows the computed results with mode tracking scheme. As shown in this figure, by using the present mode tracking scheme, all of the structural modes can be tracked very well.
Fig. 10The solutions of the PQI method without mode tracking
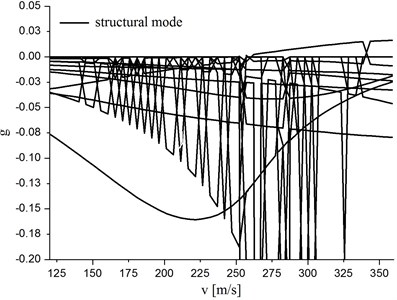
a)- plot
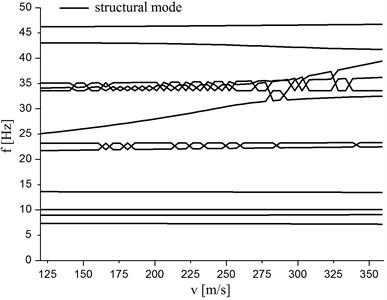
b)- plot
Fig. 11The solutions of the PQI method with mode tracking
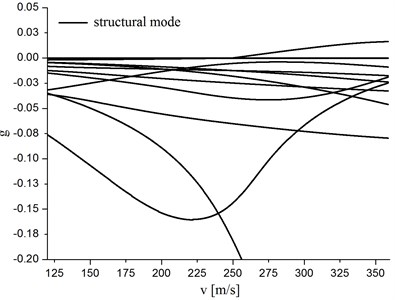
a)- plot
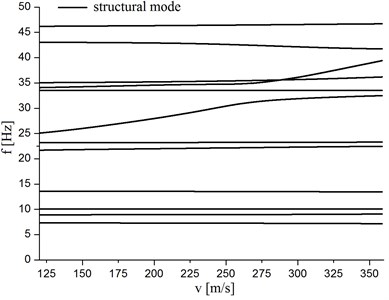
b)- plot
4. Conclusions
This paper presents the study on the flutter analysis and mode tracking of the aircraft model with closely spaced modes. By using the piecewise quadratic interpolation approach, the nonlinear eigenvalue problem is converted to a piecewise quadratic eigenvalue problem. To overcome the drawback of the piecewise quadratic interpolation method in mode tracking problem, a simplified predictor-corrector scheme is presented so as to tracking all structural modes of an aeroelastic system properly. To verify the accuracy of the present scheme, a 15-degree sweptback wing model is selected as the first test bed. The numerical results show that the present mode tracking scheme could track all modes efficiently. Moreover, a generic advanced fighter aircraft model with closely spaced modes is illustrated as the second test case. The numerical results show that the present mode tracking scheme can also be applied for flutter analysis of the practical engineering structures.
References
-
Rodden W. P., Johnson E. H. MSC Nastran v68 Aeroelastic Analysis User’s Guide. MSC Software Corporation, Los Angeles, 1994, p. 73-76.
-
Hassig H. J. An approximate true damping solution of the flutter equation by determinant iteration. Journal of Aircraft, Vol. 8, Issue 11, 1971, p. 885-889.
-
Yang Z., Gu Y. Unified flutter solution technique using matrix singularity indicators. Journal of Aircraft, Vol. 46, Issue 5, 2009, p. 1525-1532.
-
Goodman C. Accurate subcritical damping solution of flutter equation using piecewise aerodynamic function. Journal of Aircraft, Vol. 38, Issue 4, 2001, p. 755-763.
-
Eller D. Flutter equation as piecewise quadratic eigenvalue problem. Journal of Aircraft, Vol. 46, Issue 3, 2009, p. 1068-1070.
-
Chen P. C. A damping perturbation method for flutter solution: the g-method. AIAA Journal, Vol. 38, Issue 9, 2000, p. 1519-1524.
-
Guan D. Aeroelasticity Handbook of Aircraft. Beijing Aeronautical Industry Press, 1994, p. 126-134.
-
Albano E., Rodden W. P. A doublet-lattice method for calculating lift distributions on oscillating surfaces in subsonic flows. AIAA Journal, Vol. 7, Issue 2, 1969, p. 279-285.
-
Louis A., Pipes P. H. D. Applied mathematics for engineers and physicists. Mograw-hill Book Compaby, New York, 1946, p. 448-452.
-
ZAERO Version 8.2 Theoretical Manual. ZONA Technology Inc., 2008.
-
Karpel M., Moulin B., Idan M. Robust aeroservoelastic design with structural variations and modeling uncertainties. Journal of Aircraft, Vol. 40, Issue 5, 2003, p. 946-954.
-
Moulin B., Idan M., Karpel M. Aeroservoelastic structural and control optimization using robust design schemes. Journal of Guidance, Control, and Dynamics, Vol. 25, Issue 1, 2002, p. 152-159.
-
Karpel M. Modal-based enhancement of integrated structural design optimization schemes. Journal of Aircraft, Vol. 35, Issue 3, 1998, p. 437-444.
