Abstract
At present time the ultrasound imaging technique is widely used for qualitative evaluation of ocular tissue structure. Differential diagnosis of human eye tumors is one of the most important problems in ophthalmology in dealing with cancer prevention and diagnostics. Simple ultrasonic methods such as A scan and B scan images used in ophthalmology helps to identify intraocular tumors, but does not reflect the microstructure, does not allow them to differentiate. In this paper the new technique for tumours tissue structure evaluation using ultrasound spectral analysis is presented. Based on the obtained results, it can be said that RF ultrasound signals parameters (amplitude envelope, spectrum slope, spectrum intercept and momentary bandwidth) at the healthy tissue area and the area with the intraocular tumor – melanoma and hemangioma statistically are significantly different. This study has shown that the lower amplitude, lower spectral intercept, high spectral slope and high momentary bandwidth are typical for choroidal melanoma if compared with hemangioma or healthy tissues. This allows us to distinguish healthy tissues from the abnormal tumor tissues, to identify and differentiate chorioidal melanoma and hemangioma between each other. Application of spectral analysis using non-invasive ultrasound expert system, reliably reflects tissue microstructure, gives more information about tissue differences, allows to distinguish healthy tissues from the tumor to identify and differentiate tumors between each other.
1. Introduction
Intraocular tumors are called tumors of the inner eye coatings. These tumors are dangerous not only because of vision loss, but often because of threat for the patient's life. They are usually malignant [1-2].
Differential diagnosis of eye tumors is one of the most important problems in ophthalmology. Eye tumors, especially melanoma are very dangerous due to metastasis to other organs. Malignant tumors of the eye makes 0.2 percent of all malignant tumors diagnosed and is every a direct cause of death for every third patient [1-2].
Early detection of these lesions and accurate diagnosis leads to effective assistance. There are several pathologies similar to malignant tumors: choroidal naevus, hemangioma, subretinal hemorrhage, exudative macular degeneration, haemophthalmus. Early diagnosis and tissue characterization is crucial in order to apply the proper treatment, to predict course of disease and to prevent from patient's death [1-2].
The most common clinical use study assessing changes in the fundus of the eye is an optical-ophthalmoscopy-eye fundus examination and subjective visual evaluation performed with optical devices-ophthalmoscopes. This study is not sufficiently informative for differential diagnosis of intraocular tumors, because the size and structure of tumor tissue is not being evaluated. Digital optic examination of fundus of the eye and ultrasound methods are used to increase informativeness [1-2].
Ultrasonic methods stand out in ophthalmology with great informative value among the noninvasive methods. This is one of the main diagnostic methods for establishing the diagnosis of intraocular tumors [1, 3].
The first application of diagnostic ultrasound in the eye was reported by Mundt and Hughes in 1956. Their report described the use of industrial flaw detection equipment for A-mode examination of in vitro enucleated eyes and patients with intraocular tumors. Soon afterward, Oksala and Lehtinen of Finland described clinical examinations with a handheld A-mode transducer. A flurry of activity followed, primarily in Europe and the United States, to develop sonographic techniques for biometry, A-mode diagnosis, and B-mode visualization [4].
Ultrasound technology has been used in ophthalmology since D. Jackson Coleman, MD, and others described its use for the evaluation of ocular pathology in the late 1960s and early 1970s. When IOLs began to gain popularity later in the 1970s, cataract surgeons adopted ultrasound A-scans to measure the axial length of the eye for IOL power calculation. A-scan biometry became more accurate over time, with the addition of gates to take into account changes in the velocity of sound as it travels through the different media in the eye [4].
Independently, pioneering researchers converged on three important clinical applications of highfrequency B-mode imaging: these were in ophthalmology (Pavlin et al. 1990, Sherar et al. 1989), dermatology (Hoffmann et al. 1989, 1990) and intravascular ultrasound (Bom et al. 1989, Meyer et al. 1988, Nissen et al. 1990, Yock et al. 1989). Skin and intravascular applications began in the 20 MHz range, and ophthalmic applications centred in the 40 to 60 MHz range. In each case, unique instrumentation was created to address the specific needs of the applications. The ultrasonic visualisation of living tissue at microscopic resolution is referred to in the literature as “ultrasound backscatter microscopy” or “ultrasound biomicroscopy” [4].
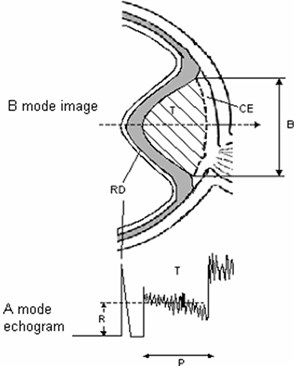
Ultrasound B-scan image carries information for determination of tumours shape, topography, tumour pervasion into the eye fundus Fig. 1 [1].
Eye tumour size, shape, present of retina detachment, vascular excavation are determined from the B-scan image. Key indicators for intraocular tumor differentiation – geometry of the tumor, size, shape – most commonly used in clinical practice, as well as blood flow, biochemical parameters and additional information is very important. These are the main parameters for clinical decision-making: diagnosis, prognosis and choosing the right tactics for treatment of the patient’s [1, 3, 5].
Fig. 1B – view of the eye tumour (above), A – echogram (below), T – tumour, RD – retinal detachment, CE – choroidal excavation, P – height of tumour, R – mean amplitude of reflected signal, B – base of the tumour
Simple ultrasonic methods such as A scan and B scan images used in ophthalmology helps to identify intraocular tumors, but does not reflect the microstructure, does not allow them to differentiate [1-3].
To get more information about tumor of the eye and its structure, methods and tools are required to obtain qualitatively new and valuable information [1-3].
Non-invasive ultrasound expert system is designed – consisting of specialized technical equipment – a radio frequency (RF) device to receive and collect RF from the inner eye tumors, and advanced software for data processing and parameterization [1-3].
Application of spectral analysis using non-invasive ultrasound expert system, reliably reflects tissue microstructure, allows to distinguish healthy tissues from the tumor, to identify and differentiate between each other [1, 6].
RF signal supplies a valuable information of a tissue morphology – shape, homogenity and structure [1, 3, 5].
Spectrum analysis of frequency-dependent backscattered radiofrequency (RF) data has been used to characterize tissue microstructures in the diagnosis of prostate cancer, ocular tumors, and cardiac abnormalities and to differentiate benign lymph nodes from malignant lymph nodes. It has been shown theoretically that the spectral parameters are related to tissue microstructural properties (e.g., effective acoustic scatterer size and concentration). Ultrasonic spectral analysis with a high frequency transducer has been used to detect microstructural changes induced by radiotherapy, photodynamic therapy and chemotherapy in tumor xenografts [7].
Spectrum analysis techniques were developed to measure reflective tissue properties over a range of frequencies and to quantitatively evaluate subresolution constituents in terms of their effective sizes, concentrations, and acoustic impedances. A striking example of this spectrum analysis technology was a study of malignant melanomas and detection of microarchitectural patterns that recognized lethal patterns with 98 % sensitivity. Other applications include tissue layer separation (e.g., choroid and sclera) and the monitoring of subtle changes in tissue microstructure induced by such treatment modalities as radiotherapy and intense therapeutic ultrasound [7].
The main parameters reflecting the structure of tumor is the amplitude envelope of RF signal, spectral slope, spectral intercept and the momentary bandwidth calculated after spectral analysis.
2. Objectives of the study
1. Collect ultrasound images and RF signals for comparative evaluation between healthy eye tissues and tissues with intraocular tumors: chorioidal melanoma and hemangioma.
2. The aim of this research is to compare parameters of ultrasound signals backscattered from healthy ocular tissues with intraocular tumor suspicious tissues using spectrum analysis of frequency-dependent backscattered radiofrequency (RF) for intraocular tumor characterization in vivo.
3. Methods and data
The study involved 30 people from 18 to 80 years attending in Hospital of Lithuanian University of Health Sciences Kaunas Eye Clinics consultation diagnostic department with suspected or diagnosed intraocular eye tumor – choroidal melanoma – 30 cases, with hemangioma – 12 cases and 60 cases with healthy eyes.
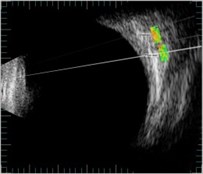
In both eyes of control group, the two ROI (rectangular regions of interest) were sellected and used to check if healthy tissues are similar statistically. In the eye with suspicious tissues two manners of ROI selections were done: selecting both ROI at the same direction of Bscan vector (b) and selecting each ROI at diferent Bscan vector (c) Fig. 2. Using these to types of tissues imaging could lead to the possility to check if parameters of backscattered signals from healthy tissues are influenced by acoustic properties of suspicious tissues.
Fig. 2ROI selection in B scan images of the eye: a) in eyes of control group; b) in suspicious eyes in one direction; c) in suspicious eyes in two directions. 1 – healthy tissue; 2 – plus tissue
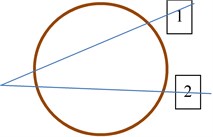
a)
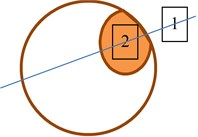
b)
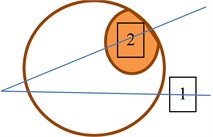
c)
All subjects underwent a detailed ophthalmic examination. Optical transparent assessment with a slit lamp. Eye fundus was photographed with digital ophtalmoscope Optomed Smartscope M3 – 1 data was stored in databases.
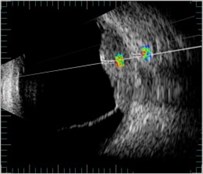
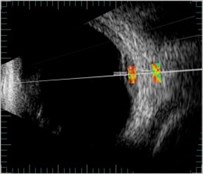
Ultrasound examination of eye of subjects was performed for evaluation of intraocular tissue structural parameters.The hardware and software system used for acquisition of ultrasound B scan raw signals is described by R. Jurkonis and co. in [8]. Briefly the hardware system could be specified as follow. The ultrasound B scan system is Mentor (Advent, Norwell, MA), with mechanical scanning transducer of 12 MHz, this original system is supplemented with signal acquisition system [9, 10]. System assures acquisition of raw ultrasound diagnostic signals with 250 MHz sampling frequency and 8 bits amplitude resolution. B scan raw signals were stored into database on computer hard disc and analyzed off-line. Analysis was performed by ophthalmologist using NICDIT v1.2 software. B scan raw signals were loaded into software reviewed and two regions of interest were selected manually. Both regions were of the same length (1.5 mm) in all analyzed cases. Example B scan images with selected regions are presented in Fig. 3. Two areas were investigated: healthy tissue area and area with intraocular tumors in the eye of different groups.
Fig. 3ROI selection in one direction of B scan images: a) in healthy (control) eye (id221); b) in melanoma eye (id176); c) in heamangioma eye (id288)
a)
b)
c)
The raw RF signals from selected regions were analysed in NICDIT v1.2 software algorithms.
Radiofrequency row signals where characterized with four parameters: signal envelope amplitude (V), intercept (dB) momentary bandwidtht (MHz) and slope (dB/MHz) of approximated backscattered spectra. The amplitude of a radio frequency echo signal distribution equals to the sum of the signals from each reflecting point in the radiation line. Power spectrum of the echo signal is calculated using the discrete Fourier transformation.
After analysis the noninvasive ultrasound tissue characterizing parameters were saved into reports. They were compared by applying amplitude and spectral analysis of raw Bscan signals.
Then parameters matrix was analyzed statistically if there is correlation with intraocular tissue structure.
The statistical analysis was performed using the computer program SPSS v17.0. For comparison of differences of quantitative values for two independent groups a Student-normal distribution and the Mann-Whitney test was used. Differences are estimated as statistically significant when 0.05.
4. Results of ultrasound tissue characterization.
Preliminary conclusions can be made after study of 30 cases with intraocular choroidal melanoma and 12 with hemangioma, all compared with healthy tissue area of 60 cases.
Distribution of patients by sex in 30 cases of melanoma group was 11 men and 19 women.
Average age was 60,1 years. In 12 cases of hemangioma group there were 9 women and 3 men, average age was 65 years. In control group there were 30 cases with both eyes – 19 men and 11 women, average age was 48,3 years.
In melanoma group the mean visual acuity (VA) in 27 patients was 0,35, the mean best visual acuity (BCVA) was 0,45. 3 patients had only light perception. In hemangioma group the mean VA was 0,3, BCVA was 0,5. In control group the mean VA was 0,77 and BCVA was 0,98.
The mean intraocular pressure (IOP) in melanoma and hemangioma group was the same – 14,7 mmHg. In control group – 16,7 mmHg.
Results of B scan showed that the mean basis of melanoma tumor was 11,3 mm and the mean height was 5,1 mm. In hemangioma tumor – respectively 7,7 mm and 2,7 mm.
4.1. Amplitude
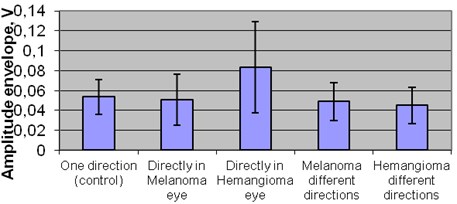
The comparison of amplitude in exploratory groups revealed that there is no significant difference between the healthy tissue 0,054 V and melanoma tumor in all directions. The statistically significant difference was revealed between the healthy tissue and the hemangioma tumor amplitude in different directions 0,083 V ( 0,05) Fig. 4.
Fig. 4Mean amplitude of healthy tissues in different groups
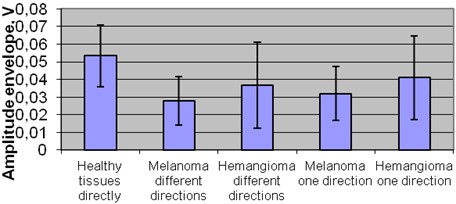
The comparison of amplitude in plus tissue zone between groups revealed statistical significant difference was between healthy tissues 0,054 V and melanomas in one 0,032 V and in different directions 0,028 V (0,05). Also significant difference of amplitude was between healthy tissue 0,054 V and hemangioma group but only in different directions 0,037 V ( 0,05).
Within melanoma group there was no significant difference between amplitude of one 0,032 V and different directions 0,028 V.
Significant difference of amplitude was detected between melanoma and hemangioma groups, while comparing melanoma in one 0,032 V and different directions 0,028 V with hemangioma in one direction 0,041 V ( 0,05) Fig. 5.
Fig. 5Mean amplitude of plus tissues amplitude in different groups
4.2. Spectral intercept and slope
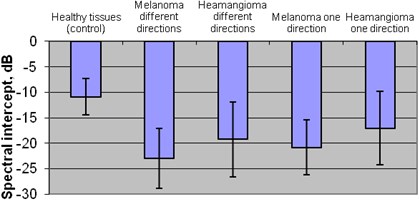
The comparison of mean spectral intercept between plus healthy zone and exploratory groups revealed the statistically significant difference between healthy tissue (–10,88 dB) and melanoma group (in one direction –20,87 dB and in different directions –22,95 dB) and also between healthy tissue and hemangioma group (in one direction –17,05 dB and different directions –19,25 dB) (0,05).
Statistically different results were revealed between melanoma and hemangioma groups, comparing the mean spectral intercept of melanoma tumor in different directions –22,95 dB and the mean spectral intercept of hemangioma tumor in one –17,05 dB and different directions –19,25 dB ( 0,05).
Also statistically different result was in comparison of melanoma tumor mean spectral intercept in one direction –20,87 dB and in hemangioma tumor mean spectral intercept in one direction –17,05 dB (0,05) Fig. 6.
Fig. 6Mean spectral intercept of plus tissues in different groups
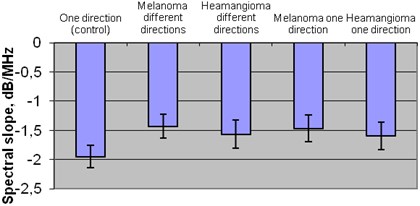
The comparison of mean spectral slope in plus healthy tissue zone and exploratory groups the statistically significant difference was detected. Comparing healthy tissue –1,95 dB/MHz and melanoma tumor mean spectral slope in one direction –1,47 dB/MHz and in different directions –1,43 dB/MHz. Also healthy tissues –1,95 dB/MHz and hemangioma tumor mean spectral slope in one direction –1,59 dB/MHz and in different directions –1,57 dB/MHz ( 0,05).
There significant difference was found between the groups of melanoma tumor mean spectral slope in different directions –1,43 dB/MHz and hemangioma tumor mean spectral slope in one direction –1,59 dB/MHz (0,05) Fig. 7.
Fig. 7Mean spectral slope of plus tissues in different groups
4.3. Momentary bandwidth
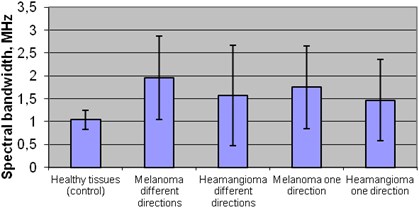
The results of comparison of mean momentary bandwidth in plus healthy tissues zone and exploratory groups were statistical different: in healthy group 1,04 MHz and melanoma group in one direction 1,75 MHz and in different directions 1,96 MHz. Also in healthy tissue 1,04 MHz and hemangioma tumor in different direction 1,57 MHz ( 0,05).
There was significant difference between groups of melanoma tumor mean momentary bandwidth in different directions 1,96 MHz and hemangioma tumor mean momentary bandwidth in one direction 1,47 MHz ( 0,05) Fig. 8.
Fig. 8Mean spectral bandwidth of plus tissues in different groups
The tissues characterising parameters, defined as mean and standard deviation in whole ROIs, extracted from RF ultrasound signals are presented in Table 1.
Table 1Differentiation parameters (mean, std. deviation) of Bscan ultrasound signals backscattered from intraocular tissues
Parameters | Region in tissues | ||||
Healthy tissues | Melanoma one direction | Melanoma different directions | Hemangioma one direction | Hemangioma different directions | |
Bscan amplitude, dB | 0,054±0,02 | 0,032±0,02 | 0,028±0,01 | 0,041±0,02 | 0,037±0,02 |
Spectral intercept, dB | –10,88±0,2 | –20,87±0,23 | –22,95±0,21 | –17,05±0,24 | –19,25±0,24 |
Spectral slope, dB/MHz | –1.95±3,53 | –1.47±5,4 | –1.43±5,84 | –1.59±6,94 | –1.57±7,31 |
Spectral momentary bandwidth MHz | 1,04±0,21 | 1,75±0,9 | 1,96±0,91 | 1,47±0,90 | 1,57±1,1 |
5. Discussion
The raw ultrasonic signals backscattered from intraocular tissues were processed and analyzed aiming to characterize healthy and suspicious tissues. The signals from selected regions of the eye tissues are characterized with parameters: Bscan envelope amplitude (V), approximated spectral slope (dB/MHz), approximated spectral intercept (dB) and momentary bandwidth (MHz). The interpretation of calculated parameters is hard without final and confirmed clinical diagnosis.
There are not enough comprehensive studies that compare exploratory groups using spectral analysis parameters. A statistical significant difference is detected within exploratory groups and within spectral analysis parameters using Stjudent T criteria.
In Coleman et al. study there were investigated 63 clinical cases that were divided into three groups: melanomas group (19 cases), metastatic carcinomas group (24 cases) and mixed/epithelioid cells group (20 cases). Spectral analysis parameters (intercept, means of amplitude and slope) of groups were compared using Sjtudents T criteria. Significant difference was detected in all groups within all spectral parameters (0,05) [11].
Results showed that rising spectral intercept and low amplitude in the middle rate reflect spindle cells melanoma. The high amplitude and low rates reflect carcinoma [11].
Spectral parameters are important for monitoring patients, comparing survival rate while using different therapies. Spectral analysis method was used in clinical trials for investigation of prostate, liver, vascular and breast tissues [12].
Mortality rate of melanoma significantly depends on the histological structure [11]. Non-invasive ultrasound system which measures spectral analysis parameters (intercept, amplitude and slope) helps to differentiate histological structure of the tumor [11].
Our study has shown that the lower amplitude, lower spectral intercept, high spectral slope and high momentary bandwidth are typical for choroidal melanoma if compared with hemangioma or healthy tissues. This allows us to distinguish healthy tissues from the abnormal tumor tissues and also to identify and differentiate chorioidal melanoma from hemangioma.
6. Conclusions
1. The obtained results show that there is statistically significant difference between the RF ultrasound signal parameters (amplitude envelope, spectrum slope, spectrum intercept and momentary bandwidth) in the healthy tissue area and in the area with the intraocular tumor – melanoma and hemangioma ( 0,05).
2. This study has shown that the lower amplitude, lower spectral intercept, high spectral slope and high momentary bandwidth are typical for choroidal melanoma if compared with hemangioma or healthy tissues.
3. Non-invasive ultrasound expert system provides the new opportunities in early diagnosis and differentiation of tumors – chorioidal melanoma from hemangioma, observation of the process, evaluation of the treatment effectiveness as well as prognosis of survival.
References
-
Jurkonis R., Trumpaitis J., Šarkūnaitė D., Paunksnis A. Application of ultrasound radiofrquency analysis for intraocular tissues differentiation. Biomedical Engineering Conference, 2012.
-
Paunksnis A., Barzdžiukas V., Kažys R., Raišutis R., Lukoševičius A., Paunksnis M., Janušauskas A., Marozas V., Jegelevičius D., Daukantas S., Kopsala S., Kurapkienė S., Kriaučiūnienė L., Jurkonis R. A non-invasive expert system for diagnosis of intraocular tumours: the system concept. Ultrasound, Vol. 63, Issue 4, 2008, p. 66-72.
-
Puzienė V., Jegelevičius D., Lukoševičius A., Jurkonis R., Paunksnis A., Barzdžiukas V. Progress towards noninvasive intraocular tumor diagnostics. Ultrasound, Vol. 65, Issue 2, 2010, p. 47-51.
-
Lizzi F. L., Coleman J. History of ophthalmic ultrasound. Journal of Ultrasound in Medicine: Official Journal of the American Institute of Ultrasound in Medicine, Vol. 23, Issue 10, 2004, p. 1255-1266.
-
Paunksnis A., Kurapkienė S., Mačiulis A., Lukoševičius A., Špečkauskas M. The use of echospectral methods of tissue evaluation for follow-up of brachytherapy treatment. Ultrasound, Vol. 62, Issue 4, 2007.
-
Lizzi F. L., Feleppa E. J., Alam S. K., Deng C. X. Ultrasonic spectrum analysis for tissue evaluation. Pattern Recognition Letters. Vol. 24, Issue 4, 2003, p. 637-658.
-
Lin C., Cao L., Wang J., Zheng W., Chen Y., Feng Z., Li A., Zhou J. Ultrasonic spectrum analysis for in vivo characterization of tumor microstructural changes in the evaluation of tumor response to chemotherapy using diagnostic ultrasound. BMC Cancer, Vol. 13, 2013, p. 302.
-
Jurkonis R., Jegelevicius D., Marozas V. Virtual instrument for ultrasound signal sampling and formation of bscan image of eye. Biomedical Engineering Conference on Virtual Instruments in biomedicine, 2009, p. 55-60.
-
Jurkonis R., Daukantas S., Janušauskas A., Lukoševičius A., Marozas V., Jegelevičius D. Synthesis of parametric map from raw ultrasound B-Scan data. Electronics and Electrical Engineering, Vol. 6, Issue 94, 2009, p. 109-112.
-
Jurkonis R., Janušauskas A., Marozas V., Jegelevičius D., Daukantas S., Patašius M., Paunksnis A., Lukoševičius A. Algorithms and results of eye tissues differentiation based on RF ultrasound. The Scientific World Journal, Vol. 2012, 2012, p. 1-6.
-
Coleman D. J., Lizzi F. L., Silverman R. H., Rondeau M. J., Smith M. E., Torpey J. H. Acoustic biopsy as a means for characterization of intraocular tumors. Ultrasound and Echography, 1983, p. 115-118.
-
Lizzi F. L., Astor M., Liu T., Deng C., Coleman D. J., Silverman R. H. Ultrasonic Spectrum Analysis for Tissue Assays and Therapy Evaluation. Cornell University Medical College, 1996.
-
Coleman D. J., Silverman R. H., Rondeau M. J., Boldt H. C., Lloyd H. O., Lizzi F. L., Weingeist T. A., Chen X., Vangveeravong S., Folberg R. Noninvasive in vivo detection of prognostic indicators for high-risk uveal melanoma: Ultrasound parameter imaging. Ophthalmology, Vol. 111, Issue 3, 2004, p. 558-564.
-
Coleman D. J., Lizzi F. L., Silverman W. H., Helson L., Torpey J. H., Rondeau M. J. A model for acoustic characterization of intraocular tumors. Investigative Ophthalmology & Visual Science, Vol. 26, Issue 4, 1985, p. 545-550.
-
Coleman D. J., Silverman R. H., Lizzi F. L. Ultrasononography of the Eye and Orbit. 2nd Edition 2006.
-
Janušauskas A., Marozas V., Jegelevičius D., Paunksnis A., Lukoševičius A., Jurkonis R. Algorithms and software for RF ultrasound based eye tissues characterization. Biomedical engineering, 2010, p. 14-20.
-
Mamou J., Coron A., Hata M., Machi J., Yanagihara E., Laugier P., Feleppa E. J. Three-dimensional high-frequency characterization of cancerous lymph nodes. Ultrasound in Medicine and Biology, Vol. 36, Issue 3, 2010, p. 361-375.
-
Silverman R. H., Folberg R., Boldt H. C., Llod H. O., Rondeau M. J., Mehaffey M. G., Lizzi F. L., Coleman D. J. Correlation of ultrasound parameter imaging with microcirculatory patterns in uveal melanomas. Ultrasound in Medicine & Biology, Vol. 23, Issue 4, 1997, p. 573-581.
About this article

