Abstract
The partial discharge (PD) phenomenon is very harmful for electrical appliances and its early detection could be a cost effective approach for the industry. Although many techniques are used for PD detection yet no technique has presented widely acceptable solution. Still the subject needs parallel study of the detection techniques. In this experimental, multimode fiber (MMF) was placed in oil tank. The PD induced acoustic emission (AE) inside the insulation oil. PD signal has been captured by using step-index multimode of fiber optic sensor (FOS). The results shows FOS has good sensitivity in the range of applied high voltage 10 kV.
1. Introduction
PD has attracted much attention due to the high financial outlay needed to repair the damage it causes. A high voltage network system has a number of heavy transformer installations which continuously work to distribute electricity to substations. Stability of any power system network determines the life time of the high voltage equipment installed in the network. The expensive components of the high voltage equipment are the power transformers which are expensive and can incur high repair costs. Each fault on a single unit of the heavy transformer installations has a huge financial impact on the maintenance cost of the installations. Hence, continuous operational monitoring is very important. Failures due to PD cause deterioration of the high voltage network system performance and result in breakdown, fires and damage to the system. PD detection technique is widely used for high voltage equipment protection, insulation condition monitoring and general high voltage network assessment. Hence, a good understanding of PD mechanisms, its characteristics and development processes are important. Insulation of the high voltage network system has a high risk for dielectric stability when PD occurs. Therefore, continuous measurement and monitoring of PD is important so that preventive actions can be taken to avoid equipment damage.
At the present moment, modern testing procedures are available to monitor high voltage insulation in the high voltage network system. There is now a new trend to monitor high voltage insulation using sensitive predictive diagnostic tools. PD results in many different physical phenomena such as electromagnetic emission (in the form of radio wave, light or heat), acoustic emission (in the audible and ultra-sonic ranges), ozone formation and nitrous oxide gas discharges [1]. PD occurs when the insulation of high voltage network system deteriorates or degrades. For this reason, it has been used as a tool to predict and detect possible insulation failure of the system. The frequency and intensity of PD are the main quality criteria to estimate the life span of the high voltage network system.
In power transformers, high non-uniform electric field is present near the vicinity of devices which produce degradation and aging effect for insulators. This micro discharge activity near the high voltage devices is called PD phenomenon which generates energy that can be measured and used for the diagnostic and monitoring study of power transformer before complete failure [2]. The PD emitted energy as electromagnetic emission, acoustic emission and ozone and nitrous oxide gases. We can use this emitted energy to detected PD signal [3]. High Voltage equipment and High Voltage installation owners have come to terms with the need for conditions monitoring process of PD in equipment such as power transformers, gas insulated substations (GIS) and cable installations [4, 5]. Stability of any power system network is determined mainly by the high voltage equipment used. Failure of this equipment is normally related to PD activity which deteriorates the system performance and can lead to breakdowns, fires or irreparable damage to the system. PD detection is necessary as precautionary measures to ensure that high voltage equipment insulation is not exposed to any unnecessary hazards. A good understanding of PD mechanisms, characteristics and its development processes is essential for power systems designer and power systems installation maintenance engineer. There is a high risk of insulation system dielectric instability when PD occurs. Therefore, measurement and monitoring of PD is an important preventive tool to safeguard high-voltage equipment from wanton damage. Techniques for detecting PD depend on what different physical properties which accompany the occurrence of PD are measured. Known physical properties which have been used in the measurement include electromagnetic emission (in the form of radio wave, light and heat), acoustic emission (in the audible and ultra-sonic ranges), ozone formation and the release of nitrous oxide gases. PD detection, measurement and monitoring on high voltage equipment are done to determine various problems of insulation deterioration and degradations. It has been used as a tool for prediction and early detection of possible insulation failure of the equipment. The quantity and magnitude of PD are the main quality characteristic to estimate the lifelong of high voltage equipment. In conventional approaches of PD detection of high-voltage power equipments uses electrical, chemical, acoustic and optical detection techniques. PD is caused by small electrical sparks present in an insulation medium as a result of electrical breakdown due to highly non-uniform electric field within gas condition that exist in void spaces of the medium. PD occurs when the electric field exceeds local ionization threshold of dielectric insulation. During PD, energy is emitted in the form of electromagnetic emission, radio waves, light and heat and also as AE in the audible and ultrasonic ranges [6]. The ultrasonic pressure waves which have a frequency spectrum (in oil) within a wideband range from 10 kHz to 500 kHz can be used to detect the intensity and location of PD signal [7]. In this paper, the characteristics of acoustic sensor multimode FOS has been successfully explored.
2. Calibration of the sensor
The schematic illustration of experimental setup is described in Fig. 1 in which light source consist of a LED (850 nm) with output power 0.01 mW. The light is sent through MMF and the optical signal of light source is received by a photodetector (PD1) which is also connected with MMF by means of fiber coupling adapter. The MMF is a graded index fiber with core diameter (50µm) and its cladding diameter with acrylate coating layer is 125 µm. The acrylate material has narrow band pass sensitivity to ultrasound of AE which can give good results in oil insulation. Both sensors FO and PZT sensor were dipped in oil tank (20×15×10 cm) for the detection of AE in insulation oil. The distance of FO was 3 cm from the AE source (optical breakdown of laser) while the distance of PZT sensor was 4 cm. The AE was induced by optical breakdown of Nd: YAG laser having a shot of pulses with (600 V, 55 mJ). The outputs of optical signal of light for both sensors were recorded by digital oscilloscope which is shown in Fig. 2. The graph of acoustic signals detected by two acoustic sensors FO and PZT sensor is shown in Fig. 2. The output of acoustic signals of both sensors in time domain analysis indicates that, the acoustic signal comprises sinusoidal pulses with gradual decrease in intensity.
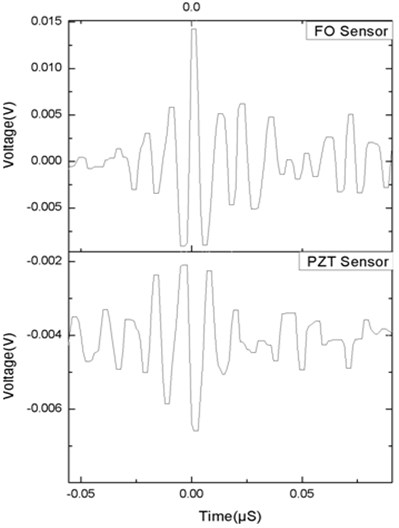
Two acoustic signals have the same time period (1 µs) with voltage (5 mV) with frequency 180 kHz of AE generated by optical breakdown of laser, which is considered a perfect value for detection of AE (Lundgaard 1992; Kawada et al. 1984; Howells et al. 1981; Eleftherion 1999). An analysis of detected acoustic signals depicted in Fig. 3 dictates that both sensors are eligible to provide interesting information of acoustic signal induced by optical breakdown of Nd: YAG laser in oil. A typical shape of acoustic signal of both sensors is shown in Fig. 4 which gives information of peak values of signals. The peak value of FO sensor has a high 0.015 V, while PZT sensor has low peak signal 0.002 V. It was also observed that acoustic signal of PZT sensor has a multi reflection due to degeneration of received signal while FO sensor has detected a clear acoustic signal. On the base of time domain analysis of acoustic signals one could conclude that multimode FO sensor can act as high sensitive acoustic sensor.
Fig. 1Experimental setup of FO and PZT sensors dipped in an oil tank
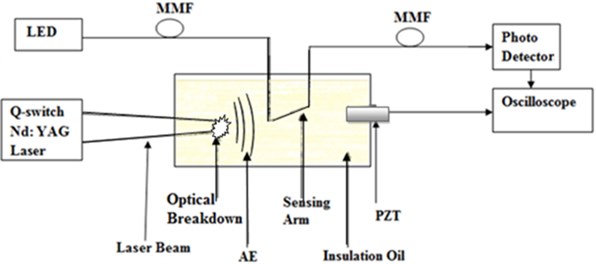
Fig. 2Image of optical breakdown along with FO and PZT sensor in an oil tank
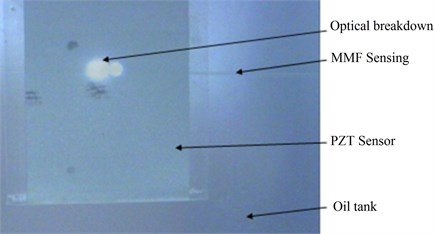
Fig. 3The graph of acoustic signal detected by FO and PZT sensors
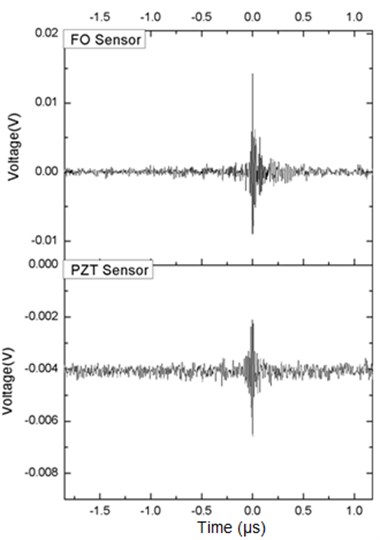
Fig. 4Typical shape of acoustic signal of FO and PZT sensors
In frequency domain analysis the Figs. 5-7 shows the Fast Fourier Transform (FFT) analysis of stored data of time domain signals of photodetector was performed for both sensors.
Fig. 5FFT spectrum of acoustic signal at frequency 180 kHz in oil
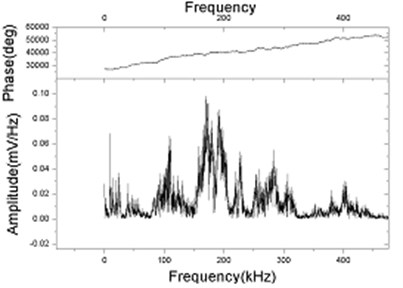
a) Amplitude of FO sensor
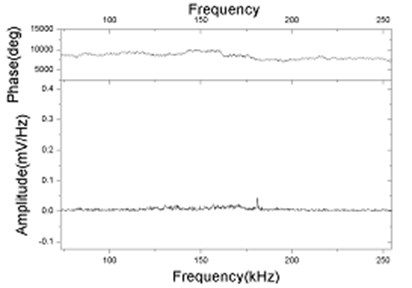
b) Amplitude of PZT sensor
Fig. 6Histogram of amplitude with distance for FO sensor
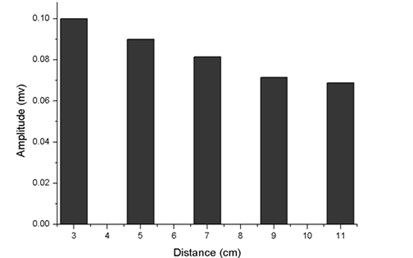
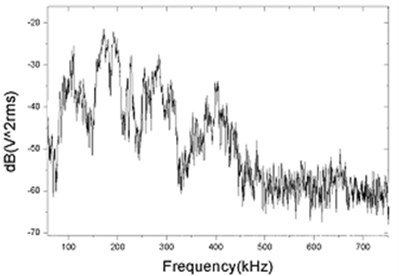
Fig. 7a) Frequency response of FO, b) Frequency response of PZT sensors in oil
a)
b)
Fig. 5 shows FFT of amplitude spectrum of both sensors (a) spectrum of FO sensor (b) spectrum of PZT sensor. Fig. 5(a) shows acoustic wave of FO sensor with range (10-450 kHz), it can observed the frequency response of FO sensor consist of series of peaks which have maximum amplitude (0.1 mV/Hz) at frequency 180 kHz. While PZT sensor has one peaks which have maximum amplitude (0.4 mV/Hz) at frequency 180 kHz. That mean amplitude of FO sensor much higher than PZT sensor. Fig. 6 shows histogram of amplitude with distance of FO sensor. It observed FO sensor has higher amplitude at distance (3 cm) between AE source and FO sensor. Fig. 7(a), (b) shows FFT spectrum of both sensors in oil. Fig. 7 (a) shows frequency response of FO sensor, which show that level of signal at 180 kHz was –20 dB with noise floor –55 dB which shows FO sensor has a resolution 35 dB above noise floor. Fig. 7(b) show FFT spectrum of PZT, which has the signal level at 180 kHz was –35 db with noise level –50 dB, which has resolution 15 dB above noise floor. It clear the FO sensor has resolution better than PZT sensor.
3. Application of FOS with AE induced by PD in insulation oil
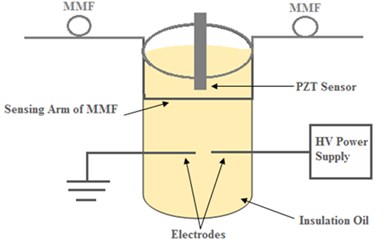
The schematic diagram of complete experimental setup to generate PD and its AE is described in Fig. 8. The tank was filled with insulation oil so that the steel electrodes remain immersed completely in the middle of the tank. The FOS was mounted on the top at the same distance 8 cm from PD source inside oil tank. For good precision, the sensor must be located inside the tank of the transformer, at the vicinity of the PD source. The electrodes having 5 mm gap were connected to 10 kV high voltage source to produce PD under insulation oil. The AE produced by PD was then sensed by FOS. The PD generates AE between two electrodes which create interference in the light passing through the OFS connected to the oscilloscope.
Fig. 8Experimental set up of PD signal detection in insulation oil
The typical spectra of acoustic signals detected by FOS are shown in Fig. 9. These results show that acoustic signal generated by PD comprises sinusoidal pulses in which have gradually decreasing trend in their intensity. FOS gives a clear picture of acoustic wave. The optical part was halogen light source is sent through MMF and the optical signal of light source is received by a photodetector (P×65) which is also connected with MMF by means of a fiber coupling adapter. The MMF is step-index fiber with core diameter (50 µm) and its cladding diameter with acrylate coating layer is 125 µm. The acrylate material has narrow band pass sensitivity to an ultrasound of AE which can give good results in oil insulation.
Fig. 9The graph of acoustic signal detected by FOS
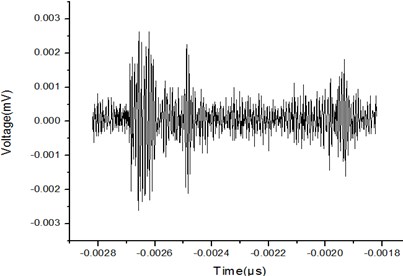
Fig. 10The FFT spectrum of output signal for FOS
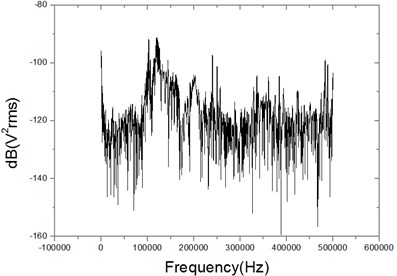
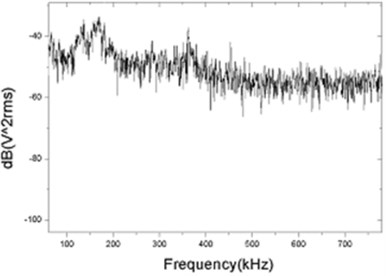
In frequency domain analysis the Fig. 10 shows the Fast Fourier Transform (FFT) analysis of stored data of time domain signals of photodetector was performed for both sensors. Fig. 10 shows acoustic wave of FOS with range (10-450 kHz), it can observed the frequency response of FOS consist of series of peaks which have maximum peak at frequency 120 kHz.
4. Conclusions
The time domain analysis showed acoustic signal of FOS has big peak signal (0.0025 mV). The FOS showed could be capture acoustic signal with less noise. The FFT analysis of time domain signal of FOS with range (10-450 kHz), it can observed the frequency response of FOS consist of series of peaks which have maximum amplitude (0.1 mV/Hz) at frequency 120 kHz. Also FFT analysis showed frequency response of FOS, which show that has signal level –90 dB at120 kHz with noise floor –120 dB. It is clear the resolution of FOS was very high 30 dB above noise floor compare. From these results it could be concluded that the FOS has ability to detect AE with high efficiency more precise.
References
-
Tenbohlen S., Denissov D., Hoek S. M., Ring Z. Partial discharge measurement in the ultra high frequency (UHF) range. IEEE Transaction Dielectrics and Electrical Insulation, Vol. 15, Issue 6, 2008, p. 1544-1552.
-
Yaacob M., Alsaedi M. A., Rahman R. A., Bidin N., Maqbool W. Detection and wavelet analysis of acoustic emission signal from partial discharge captured by multimode optical fiber and piezoelectric sensors in insulation oil. International Journal of Physical Sciences, Vol. 8, Issue 21, 2013, p. 1149-1160.
-
Yaacob M. M., Alsaedi M. A., Gizi A. Al., Zareen N. Partial discharge signal detection using ultra high frequency method in high voltage power equipments : a review. International Journal of Scientific and Engineering Research, Vol. 4, Issue 1, 2013, p. 1-6.
-
Yaacob M. M., Alsaedi M. A. Review on partial discharge detection techniques related to high voltage power equipment using different sensors. Archives Des Sciences, Vol. 65, Issue 9, 2013, p. 659-676.
-
Ruijin L., Ke W., Lijun Y., Lian D., Jian L. A new hybrid feature extraction method for partial discharge signals classification. Review on Electrical Engineering – Przegląd Elektrotechniczny, Vol. 88, Issue 1, 2012, p. 191-195.
-
Boffi P., Bratovich R., Persia F., Martinelli M. 1550 nm all-fiber interferometer for partial discharge detection in oil-insulated power transformer. 6th International Parallel Processing System, Cancún, Mexico, Optical Fiber Sensor, 2006, p. 1-5.
-
FrazaoO., Farias R. G., Araujo F. M., Ferreira L. A., Santos J. L., Miranda V. Fiber optic sensor for acoustic detection of partial discharges in oil-paper insulated electrical systems. IEEE Transaction Power Approach and System, Vol. 25, Issue 2, 2010, p. 2526-2534.
About this article

