Abstract
Awareness of the importance to make system reliable has been raised from engineering practice, and fault diagnosis of rolling bearing must be taken seriously. Although numerous studies on fault diagnosis have been carried out, there are still a number of key technical issues. Uncertain problem is one of them. Fault diagnosis based on fuzzy neural network and chaos theory can solve uncertain problem essentially, moreover it is easy to understand because of it is based on human language, the system features is easy to maintain. Therefore it is an effective method to diagnosis complex system. The input nodes of fuzzy neural network is designed by using the minimum embedding dimension of phase space reconstruction, constructing the residual generator based on fuzzy neural network and chaos theory. We can effectively detect the signal which has chaotic and fuzzy property through a reasonable evaluation of the prediction error. And it is applied to the fault diagnosis of rolling bearing, to some extent, solving the problems of complex system modeling and fault feature extraction based on fuzzy theory.
1. Introduction
With the development of computer science, neural network and fuzzy theory have been wildly used in complex and nonlinear system. They are highly interrelated and mutually reinforcing, which form the fuzzy neural network model and theory. In 1992, the fuzzy theory and neural network systematically combined in Kosko’s monograph laid the foundation of fuzzy neural network theory [1]. The fuzzy neural network combines the ability of fuzzy system logical reasoning and the adaptive ability of neural network, therefore, it not only have the fuzzy reasoning function but also give the network weights clear physical meaning. However, the fuzzy neural network is still difficult to accurately select the input nodes and fit the nonlinear variation of complex data.
In 1975, Li Tianyan and York proposed the famous Li-Yorke theorem which was thought to be the first formal description of chaos while the word “Chaos” has since been used formally [2]. In 1997, the Russian scholar Prygunov et al. published the first article that fault detection was based on chaos theory [3]. Jae-Ho Ko et al. combined neural network method with the chaotic correlation dimension and phase plane analysis to detect the high-resistance of power system [4]. In [5-6], the authors used the chaotic correlation dimension method to detect the rotating machinery. In 2011, aiming at the non-stationary and nonlinear characteristics of fault mechanical vibration signal, Zhao Yuchun put forward a method of qualitative and quantitative analysis of fault based on chaos and fractal theory [7]. In 2014, Chin-Tsung Hsieh et al. proposed the fault diagnosis method needs only one set of sensing elements to intercept the fault features of the system, which can be real-time-diagnosed by creating the fault data of only one set of sensors [8]. The diagnosis method of rolling bearing based on chaos theory and neural network which was presented in this study solve the difficult problems, to some extent, which are the complex system modeling and fault feature extraction based on fuzzy theory.
2. Method
2.1. Phase space reconstruction
Through the study of chaos by the time series, Packard et al. proposed phase space reconstruction in 1980 [9]. Phase space reconstruction is the base of chaotic time series analysis, while the key of reconstruction is its time delay selection and embedding dimension determination. Phase space reconstruction is to return to the chaotic attractor in high-dimensional space. According to Takens theory [10], we can use one-dimensional chaotic time series , 1, 2, 3,… to define the points of dimensional , 1, 2, 3,… so:
where is called system’s embedding dimension while means time delay.
By assuming is the real dimension of chaotic attractor, Takens proved that we can find as a suitable embedding dimension. When meets the condition:
So we can recover the regular trajectory attractor in the dimension. That is to say, the original dynamic system keeps differential homeomorphism in the trajectory of reconstructed space.
2.2. Grassberger-Procaccia (G-P) algorithm
Grassberger-Procaccia or G-P algorithm [11] proposed by Grassberger and Procaccia in 1983 is a relatively common method of solving system correlation dimension, which refers to the true dimension estimated value of the attractor. Where is the estimated value of correlation dimension.
Correlation dimension can be approximated with the following formula:
where the associated vector is any distance less than a given positive number . If the phase space reconstruction has points or vectors. is the Heaviside unit function.
In fact, it is not until the double logarithm slope of the linear portion substantially keeps constant that the small embedding dimension usually becomes bigger one. That is to say, the embedding dimension curve reaches saturation. The slope of the best fit straight line except for zero or infinite is the correlation dimension . After solving it, system phase space reconstruction obtains the minimum embedding dimension as follows i.e. the meets the minimum conditions:
2.3. The structure of fuzzy neural network
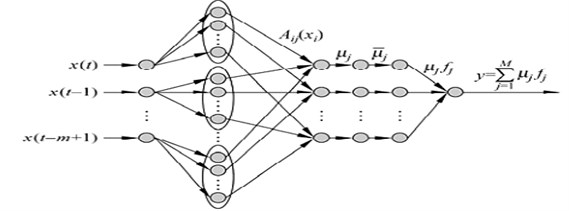
The fuzzy neural network (FNN) model designed in this study use the time series phase space reconstruction to obtain the minimum embedding dimension a as the network’s input nodes. Since the minimum embedding dimension may reflect intrinsic properties of one-dimensional time-series data reconstruction. Hence the designed input nodes have certain significance.
The fuzzy network model used to predict is the Takagi-Sugeno model [12]. It is a MISO–based network, are the input nodes and the predicted value of time series are the output nodes. The specific structure is shown in Fig. 1.
Fig. 1The structure of FNN
3. Fault diagnosis method
The fault detection method of rolling bearing is based on the algorithm fuzzy neural network and chaos theory. In order to detect the fault of rolling bearing system, first the output signal from the system needs to be predicted by the prediction model, and then we use the prediction error for fault detection.
The residual generator which is established by fuzzy neural network is shown in Fig. 2.
Fig. 2The residual generator based on FNN
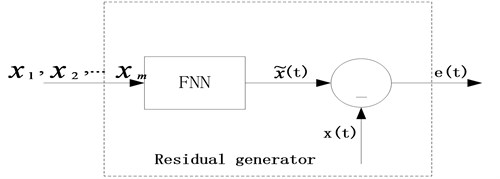
Where is the time-series signal which can be observed as being generated by the detection system, FNN is the fuzzy neural network model in the normal state, is one step of the system prediction result, is the residual signal or the prediction error.
In the practical applications, we can set an appropriate threshold value . If the absolute value is greater than the threshold value , we believe that the fault exists in the system.
The residual generator is designed as follows:
Step 1: we use G-P algorithm and least squares regression method to obtain the minimum embedding dimension of actual data, which is used as the number of FNN input nodes;
Step 2: we use the historical data of to train FNN in the normal or without fault state.
4. Experimental results
4.1. The performance simulation of virtual signals
Assuming a chaotic time series is expressed as Eq. (10):
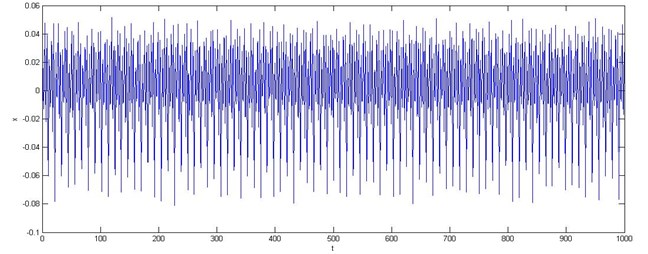
Fig. 3 shows 1200 data points of time series of the axis. We select the first 1000 data from it for simulation to validate the diagnosis method, and the rest of the data are usefulness.
Fig. 3Time series data in the X axis
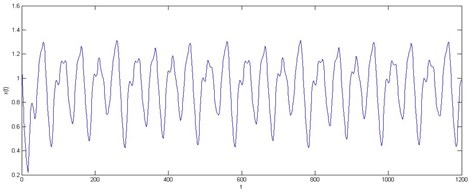
Where the first 500 training samples were trained for the fuzzy neural network, and the remaining 500 test samples were used to test the prediction performance of the fuzzy neural network.
According to the G-P algorithm, with the embedding dimension is increasing, the corresponding diagrams of of time series data as showed in Fig. 4. We can obtain its time delay and the minimum embedding dimensions values are ten and four respectively. Therefore, the input node of the fuzzy neural network from the minimum embedding dimensions is 4.
Fig. 4The corresponding diagrams of lnCm(r)-ln(r) of time series data
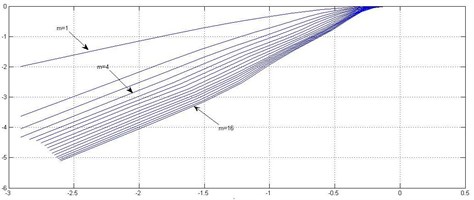
Fig. 5a) The results of single step prediction of timing data based on fuzzy neural network, b) The absolute prediction error
a)
b)
Through an experiment on the first 500 training samples, we can obtain the single prediction step of the fuzzy neural network, as showed in Fig. 5(a), Fig. 5(b) shows in the absolute error that the prediction the Mean Square Error ( 6.3817×10⁻⁶) using the fuzzy neural network to predict.
4.2. Fault diagnosis of rolling bearing based on chaotic fuzzy neural networks
We put the normal data normalization processing by phase space reconstruction and use G-P algorithm to obtain the corresponding diagrams of of time series data with the embedding dimensions increasing in the normal state of the rolling bearing, as shown in Fig. 6.
Fig. 6Training and test data
Accordingly, the corresponding time delay and the minimum embedding dimensions are respectively (3, 4), that is to say, the number of input nodes of the fuzzy neural network is 4. And in the predication data, the first 600 data are used as training sets, and the rest of 400 data are used as testing sets of the diagnosis model.
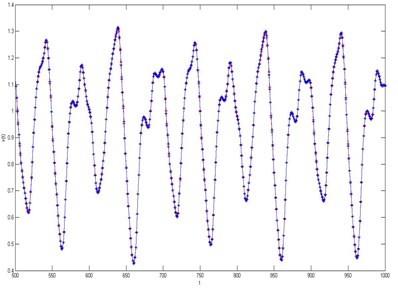
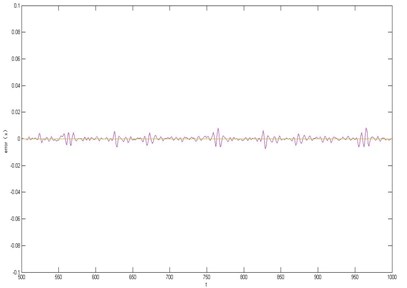
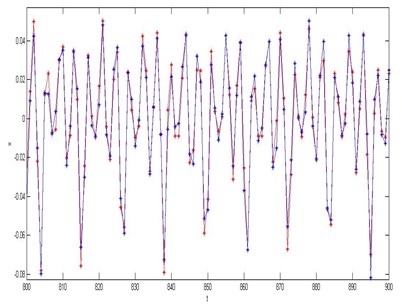
Fig. 7(a) is the 100 (800-900) data points’ prediction results, Fig. 7(b) is its absolute errors which are relatively clear display. We can see that the experimental prediction results are satisfactory, and moreover its predicted trajectory tracking performs well. The MSE value is only 2.8851×10⁻⁵ which gives a perfect proof.
Fig. 7a) The results of single step prediction of rolling bearing based on chaos fuzzy neural network, b) The absolute prediction error of rolling bearing the 100 (800-900) test data
a)
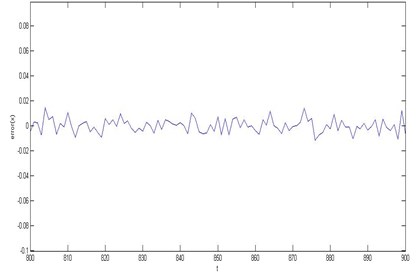
b)
5. Conclusions
In this study, using the vibration method or algorithm based on fuzzy neural network and chaos theory solves the difficult problems, to some extent, which are the complex system modeling and fault feature extraction based on fuzzy theory. The application of rolling bearing shows that the vibration method or algorithm can better diagnose the fault of rolling bearing and provide a good idea for the timely and effective monitoring vibration.
It is noteworthy that no single algorithm can be applied to all the fault diagnosis of actual complex system. The proposed algorithm which shows the practical key issue very well in this study focused on solving the feature extraction of chaos signals and the fault diagnosis problem of the complex mechanical systems.
References
-
Kosko B. Fuzzy Engineering. NJ, Prentice Hall, 1997.
-
Li T. Y., Yorke J. A. Periods three implies chaos. The American Mathematical Monthly, Vol. 82, 1975, p. 985-992.
-
Prygunov A. I., Ledenev S. A., Belolipet Sky A. V. Delay maps as an efficiency tool for a machinery vibration analysis. Control of Oscillations and Chaos, Vol. 2, 1997, p. 331-332.
-
ae-Ho Ko J., ae-Chul Shim J., Chang-Wan Ryu, et al. Detection of high impedance faults using neural nets and chaotic degree. Energy Management and Power Delivery, Vol. 2, 1998, p. 399-404.
-
Wang W. J., Wu Z. T., Chen J. Fault identification in rotating machinery using the correlation dimension and bispectra. Nonlinear Dynamics, Vol. 25, 2001, p. 383-393.
-
Wang W., Chen J., Wu Z. The application of a correlation dimension in large rotating machinery fault diagnosis. Proceedings of the Institution of Mechanical Engineers Part-C Journal of Mechanical Engineering Science, Vol. 214, Issue 7, 2000, p. 921-930.
-
Zhao Yuchun Rolling bearing fault diagnosis based on chaos fractal and fuzzy clustering. Yanshan University, 2011.
-
Chin-Tsung Hsieh, Her-Terng Yau, Jen Shiu Chaos synchronization based novel real-time intelligent fault diagnosis for photovoltaic systems. Mathematical Problems in Engineering, 2014, p. 1-9.
-
Packard N. H. Geometry from a time series. Physics Review Letters, Vol. 45, Issue 9, 1980, p. 712-718.
-
Takens F. Determining strange attractors in turbulence. Lecture Notes in Math, Vol. 898, 1981, p. 361-381.
-
Grassberger P., Procaccia I. Measuring the strangeness of strange attractors. Physica 9D, Vol. 9, 1983, p. 189-208.
-
Ying-Chung, Chiang-Ju, et al. Takagi-Sugeno recurrent fuzzy neural networks for identification and control of dynamic systems. Fuzzy Systems, 2001, p. 537-540.
About this article

This research was supported by the National Natural Science Foundation of China (Grant No. 61074083, 50705005, and 51105019), and by the Technology Foundation Program of National Defense (Grant No. Z132013B002).
