Abstract
The seismic effect created by blasting operations vibrates adjacent buildings and disturbs residents living in these buildings, often leading to disputes and complaints. In this paper, the vibration acceleration was calculated based on the measured blasting vibration velocity using the wavelet denoising-based four-point forward difference method. The infinite impulse response (IIR) digital filter was used to obtain the frequency weighting of acceleration, so as to calculate comfort assessment indexes such as vibration dose value (VDV), maximum weighted vibration severity and annoyance rate. Combined with the survey of engineering cases, comparative analysis was conducted on the indexes and standards that were suitable for the comfort assessment of blasting vibration. The results indicated that VDV, , and annoyance rate indexes could all reflect the impact of blasting vibration on comfort to a certain extent, and that while the first two indexes could only be used for qualitative assessment, the annoyance rate index could be used for quantitative comfort assessment. In addition, by applying these assessment indexes for the comfort assessment of blasting vibration, preliminary control standards were provided.
1. Introduction
With the extensive use of blasting techniques in the fields of water conservancy, transportation, urban construction, and other related industries, blasting operations using an ever-increasing blasting scale are conducted more and more frequently near towns and residential habitations, and the disputes and complaints caused by blasting vibrations are becoming increasingly intense [1-3]. At present, when blasting operations are conducted near residential areas, attention tends to be paid only to the impact of blasting vibrations on the safety of buildings, while the impact of blasting vibrations on the comfort or discomfort perceived by people living in these buildings is largely neglected. The vibration intensity that causes blasting vibration discomfort is less than the intensity that causes building structure damage, which means that even when the blasting vibration intensity is not high enough to do harm to building safety, it may still “disturb” the residents [4-5]. Investigations [6-8] also show that the essence of most complaints against blasting projects involves blasting vibration comfort issues rather than safety issues, reflecting the overreactions of residents who fear that their personal and property interests are being threatened by blasting vibration. Therefore, it is important to establish a series of methods and standards to assess comfort levels for people who are exposed to blasting vibration.
Vibration comfort refers to the degree of external vibration interference as perceived by people in daily life or at work. Currently, studies on vibration comfort focus mainly on the vibrations caused by buildings and means of transport like vehicles and ships, as well as ocean waves and sea ice [8-11]. A series of international standards [12-15], systematically summarized in the work of Griffin [16], have gradually been created on the basis of the abundant data obtained so far. The impact of vibration on people is a very complicated subject that must take into account the vibration features, physical and psychological states of people, and environmental conditions. Because blasting vibration features high amplitude, high frequency, and short duration, which are different characteristics than the vibrations listed above, the comfort assessment methods and standards for blasting vibration will also be different. However, there is limited literature about the impact of blasting vibration on people. For example, the United States Bureau of Mines (USBM) analyzed the impact of blasting vibration and similar vibrations on people, finding that when the peak particle velocity (PPV) of vibration reaches 5 mm/s, the complaint rate can reach 5 %; when the PPV reaches 10 mm/s, the complaint rate can reach 10 % [17]. The present study is an initial attempt to assess the impact of blasting vibration on people. The suitable assessment methods and standards for blasting vibration comfort have not been clearly defined and the topic needs to be studied at length.
For this study, the wavelet denoising-based four-point forward difference method was employed to calculate the blasting vibration acceleration based on the actual blasting vibration velocity signal. Then the acceleration signal was weighted by frequency using an IIR digital filter to analyze and calculate the vibration comfort index of people in a standing posture as well as in two prone postures (supine and lateral positions). Finally, combined with a field survey of projects, comparative analysis was conducted on the effects of VDV, , and annoyance rate, and the results of the analysis were used for the assessment of blasting vibration comfort, so as to explore possible methods and standards suitable for the comfort assessment of people experiencing blasting vibration.
2. Frequency-weighted acceleration
2.1. Ascertainment of blasting vibration acceleration
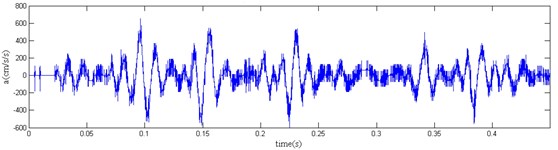
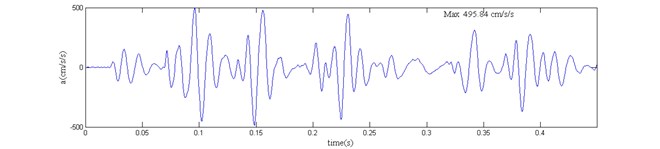
Vibration acceleration is commonly adopted as an index in the assessment of vibration comfort, but currently only vibration velocity is monitored and recorded in most blasting vibration monitoring. So it becomes very important for comfort assessment to determine how to obtain a reliable acceleration measurement based on the blasting vibration velocity, when there is no direct monitoring data for acceleration. A measured blasting vibration velocity curve is shown in Fig. 1. At present, blasting monitoring is generally recorded in the form of digital signals, according to the relationship between the acceleration and velocity; the particle acceleration process can be calculated by differentiating the particle velocity process. Given that both the time and amplitude are discrete data, the numerical differentiation method can be employed:
Since the digitally corrected velocity data are unavoidably subject to random errors, when is very small, the acceleration value calculated by Eq. (1) appears to be very sensitive even to small errors. In order to reduce errors and improve the calculation precision, in this paper, four-point forward difference method was employed:
where is the time interval of blasting vibration sampling, s.
If the duration curve of the blasting vibration acceleration is to be derived from the blasting vibration velocity, it is important that the measured blasting vibration velocity curve is reliable. Since the blasting seismic wave is a transient wave, the frequency response characteristic curve of the test system has a significant influence on the test results. Fig. 2(a) and Fig. 2(b) show the frequency response characteristic curves of the acceleration and velocity sensors, respectively. During the test, it is better to use the straight-line segment of the frequency response characteristic curve because there is no distortion in the sensor measurements within this frequency domain. If the energy of blasting seismic wave is mainly focused on the relatively low frequencies (such as lower than 10 Hz), even if the sensitivity of sensor is corrected according to the curve as shown in Fig. 2(b), there are still errors in the values of velocity obtained from the conversion according to the sole sensitivity of sensor to the measured voltage. This is mainly because unlike a harmonic wave, the blasting seismic wave is a complex wave, whose energy is distributed in a certain frequency domain instead of being focused on one frequency. Thus, when using a sensor, it is imperative to ensure that the dynamic characteristics indexes of the sensor meet the requirement. Otherwise, the output error of the dynamic measurement may be very significant.
Fig. 1The measured blasting vibration velocity curve and power spectrum
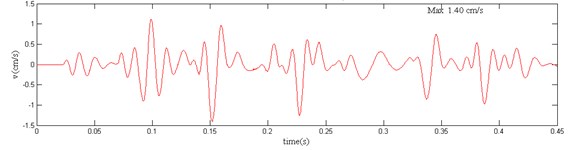
a) The CH-B vibration velocity
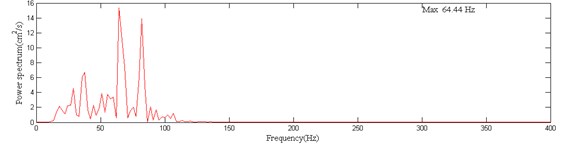
b) Power spectrum of the CH-B vibration velocity
The range of the principal vibration frequencies of the open-pit blasting vibration is approximately between 10-100 Hz. There is a large overlap between this frequency range with the natural frequency range (1-80Hz) of whole body vibration. The open-pit blasting vibration often spreads farther than the underground blasting vibration whose principal vibration frequency is generally greater than 100 Hz. Hence, the open-pit blasting has a greater impact on the human body, and this is why this paper focuses on open-pit blasting. The energy of the open-pit blasting seismic wave is mainly within the frequency domain of 10 Hz-100 Hz. For this frequency domain, the velocity sensor is located approximately within the linear segment of the frequency response curve (Fig. 2(b)), and the error of blasting vibration velocity curve from the measurement can be very insignificant. So, the acceleration is derived by applying differential calculus to the duration curve of the measured velocity. To further verify the feasibility of this method, it is compared with the duration curve of measured acceleration curves in the following section.
Fig. 2Frequency response characteristic curve
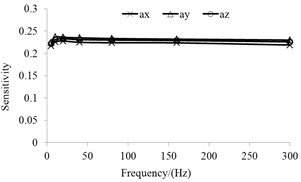
a) Acceleration sensor
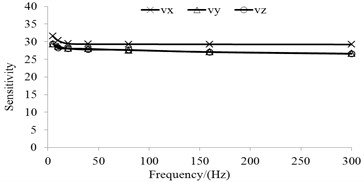
b) Velocity sensor
When Eq. (2) is used for numerical differential calculation, the calculated blasting vibration acceleration curve is shown in Fig. 3, in which we can see the high-frequency noise component, and its truncation error is represented as:
The truncation error of four-point forward difference scheme is four-order and its value is in direct proportion to the value of , so it will rapidly decrease with the decrease of the sampling interval . According to the sampling theorem, when the sampling frequency , wherein is the maximum frequency of signal , the continuous-time signal can be recovered without distortion by the ideal sampled signal. However, if the maximum frequency , then all the modulated spectrums in the ideal sampled signal frequency spectrums will overlap each other. Under this condition, the base-band spectrum will not be able to be filtered out without distortion, and the recovered signal will be distorted relative to the signal . If the minimum sampling frequency , which is called the Nyquist rate. This is allowable under the condition of recovering original signal without distortion. Further, the maximum allowable sampling period , which is called the Nyquist interval. Once the signal is sampled with the sampling frequency , is called the Nyquist frequency. This is the minimum frequency with which the original signal can reappear without distortion according to the sampling theorem. Hence, in order to improve the accuracy of the calculations, it is important to use an appropriate sampling frequency.
Fig. 3The acceleration curve and direct differential power spectrum after the direct differential
a) The original CH-B vibration acceleration
b) Power spectrum of the original CH-B vibration acceleration
Due to the high-frequency noise components induced by data errors of blasting vibration velocity, the waveform of the acceleration curve calculated by Eq. (2) is seriously distorted. The wavelet analysis method is therefore employed to eliminate the high-frequency noise component of acceleration waveform. If the effective signal in different frequency bands can be separated from the noise signals, the ideal wave form of acceleration is obtained. During the wavelet analysis, the key lies in both the selection of wavelet basis function and the determination of the decomposition layer number. As the blasting vibration signal is a random signal, the wavelet basis function frequently used is db8 [18]. The decomposition layer number needs to be determined according to the sampling frequency of the signal, the effective frequency of blasting vibration and the frequency components of noise signals. First, wavelet decomposition was conducted on acceleration waveform to separate the effective signals and the noise signals residing in various frequency band ranges, and then wavelet reconstruction was conducted on the low-frequency component obtained through decomposition. The decomposition scale needs to be determined based on the sampling frequency. Suppose that the sampling frequency is , the effective frequency range is 0-, and the minimum frequency of noise signal is , then the signal analysis frequency range will be 0-2, and the noise frequency range will be 2. According to wavelet analysis theory, when -layer decomposition is conducted on acceleration waveform data, the frequency band range of low frequency coefficient of scale is . In order to eliminate the high-frequency noise component without losing any effective signal, the following condition must be satisfied:
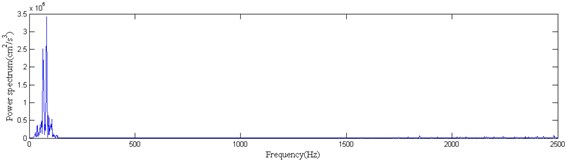
Since there is a certain overlap in the frequency band ranges of various decomposition coefficients inside the wavelet analysis, in order to avoid the loss of effective signal, the calculated frequency band of low frequency coefficient from the scale n should be at a certain distance beyond the frequency band range of the effective signal. Otherwise, a portion of effective low frequency components will be lost. Fig. 4 shows the results of the acceleration signal after 3-layer wavelet decomposition. From this figure, it is apparent that the high frequency part of the frequency decomposition is very high, and belongs to the noise component. The waveform curve of the low frequency part is smooth, and basically there is no high frequency noise component.
Fig. 4Wavelet decomposition of acceleration waveform
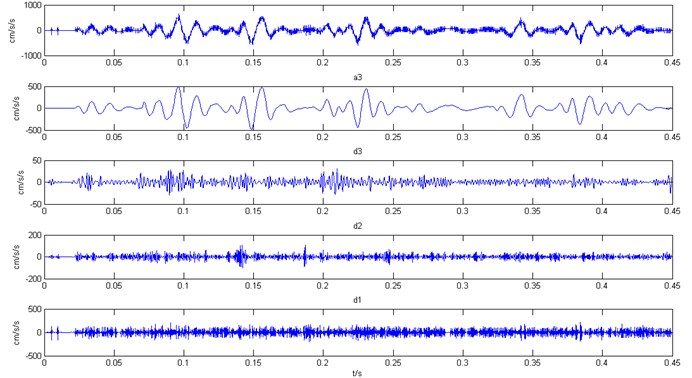
Fig. 5The power spectrum of each layer coefficient in the decomposition structure
Fig. 5 shows the power spectrum of each layer coefficient in the decomposition structure, and it is apparent that there is overlap in the frequency domains of various decomposition coefficients. If the decomposition layer number is assumed equal to 4, the calculated frequency domain of low frequency coefficient is 0-156.25 Hz, which is slightly greater than the maximum frequency of the effective low frequency acceleration signal. Due to the frequency band overlap of the decomposition coefficients, one portion of the effective low frequency components from acceleration will be lost. Hence, the decomposition layer number is set equal to 3. The acceleration curve and power spectrum after the elimination of high-frequency noise is shown in Fig. 6. Apart from this analysis, the acceleration is also derived from other measured vibration velocities. The results show that, during the process of eliminating the components of high frequency noise, it is more appropriate to apply the wavelet of db8. When the decomposition layer number is determined according to Eq. (4), the ideal time-history curves of accelerations are all obtained, as shown as Fig. 7, in which the decomposition layer number is two in Fig. 7(a) and three in Fig. 7(b).
Fig. 6The acceleration curve and power spectrum after the elimination of high-frequency noise
a) The CH-B vibration acceleration
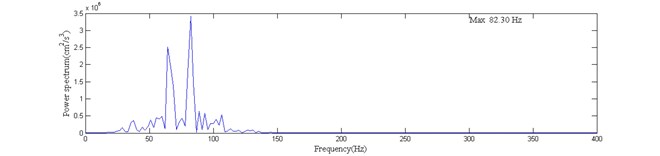
b) Power spectrum of the CH-B vibration acceleration
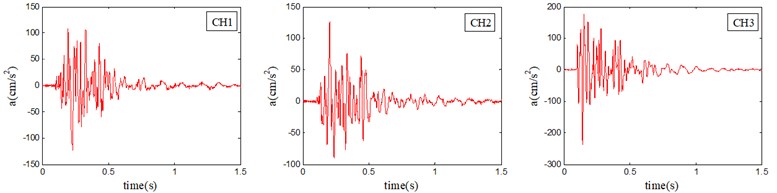
During the blasting excavation of stock ground in a hydropower station, the blast vibration acceleration and velocity are measured. The acceleration and velocity instruments are calibrated every year and both have verification certificate, so the test results should be reliable. Fig. 8 shows the blasting vibration acceleration and velocity tests. Through blasting vibration tests, the calculated and measured blasting vibration accelerations are compared, as shown in Fig. 9. It is apparent that the waveforms and frequency components of the calculated and measured accelerations (the high frequency noise components are excluded) are very close to each other. This comparison shows that using the four-point forward difference method to calculate the open-pit blasting vibration acceleration is accurate. The application of this algorithm to a recorded vibration signal will not lessen the total energy of the signal. Thus, on the premise of ensuring the duration curve of measured vibration velocity, it is feasible to obtain the required waveform of acceleration through the differential calculus of measured velocity waveform.
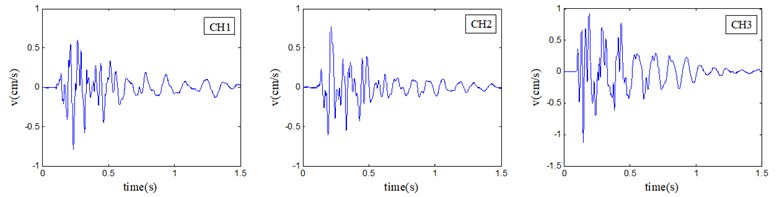
In the present study the sampling frequency and the effective frequency range are respectively 5,000 Hz and 0-150 Hz, while the frequency range of noise signal is 500-2,500 Hz. According to Eq. (4), the rational layer number of wavelet decomposition is 3. Based on the above method, an accurate and clear acceleration time-history curve can be obtained. Fig. 10 shows the blasting vibration velocity and transformed acceleration time-history curves (#8 in Table 4) in the case analyzed in the present study.
Fig. 7Derivation instance of surface blasting vibration acceleration
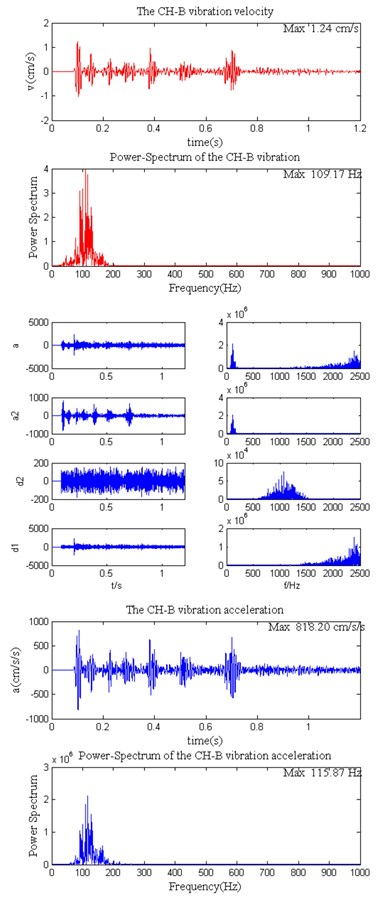
a)
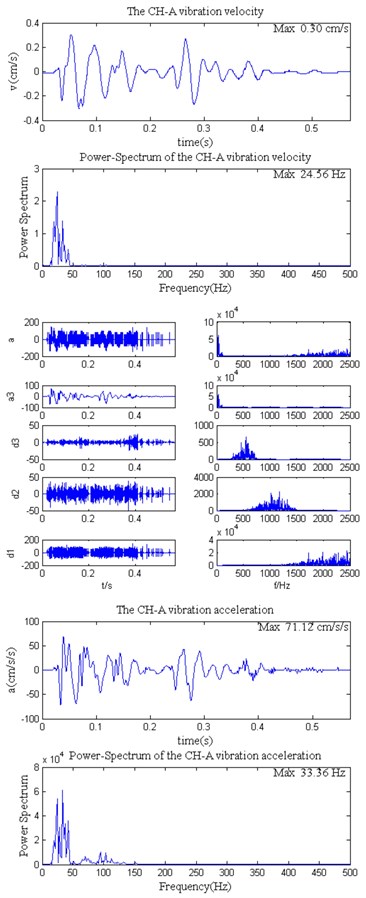
b)
Fig. 8Blasting vibration acceleration and velocity test
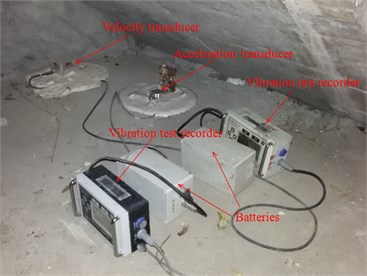
Fig. 9Calculated and measured blasting vibration acceleration
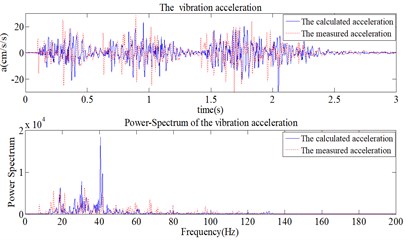
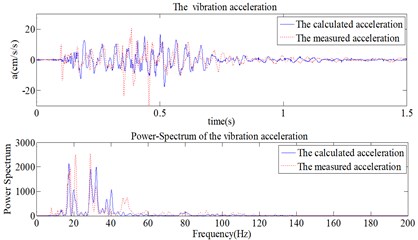
Fig. 10Recorded vibration velocity and transformed vibration acceleration. CH1 represents vertical direction, CH2 represents horizontal radial direction and CH3 represents horizontal tangential direction
2.2. Human basic axis of coordinates
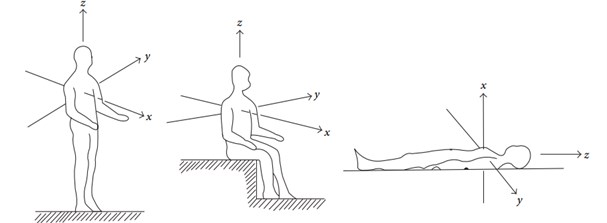
For the human body, different postures correspond to different physiological coordinates. The degree of perception by the human body for vibrations with the same intensity can vary with coordinates, so the posture of the human body should be taken into account when assessing vibration comfort [14]. The physiological coordinate axes of the human body are shown in Fig. 11, and the origin of coordinates is set at the location where vibration enters the human body. We carried out the calculation in terms of the most likely postures of the human body (standing, supine, and lateral). Blasting vibration is a random transient shock vibration, and its frequency composition is very complicated. A large number of studies have shown that the sensitivity and subjective feeling of the human body differ when the vibration is in a different frequency. In this case, the vibration acceleration must go through a filtering process, so the frequency-weighted function is employed to represent the differences in perceptions of the human body for vibration signals at different frequencies. This paper adopts the time-domain digital filter (IIR digital filter), which is represented by [19, 20]:
where, is the vibration acceleration before frequency weighting, is the vibration acceleration after frequency weighting, and is the zero-point number of the filter system transfer function, set as 2; is the pole number of the filter system transfer function, set as 2; both and are the filter coefficients.
Fig. 11Human basic axis of coordinates
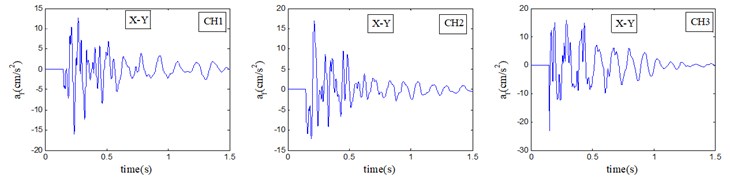
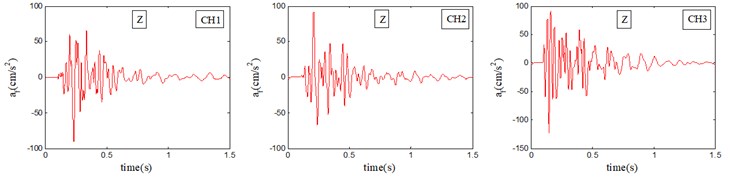
Before adopting Eq. (5), filter coefficients and , which are related to sampling frequency, should first be determined (detailed calculation method can been seen in the literature [19-20]). Considering the sampling frequency of 5,000 Hz for this paper, and are valued as per Table 1. Because the assessment of vibration comfort are conducted in various postures, and are, respectively, employed for frequency weighting in the vertical direction and the horizontal direction, where The vibration accelerations in Fig. 12 (#8 in Table 4) after frequency weighting in the vertical direction and the horizontal direction are given in Fig. 12.
Table 1Summary of filter coefficients in the case
The filter coefficients | (- axis) | ( axis) | |||||
2.828427 | 0.011184 | –0.003161 | 2.828427 | 0.011184 | –0.019627 | 3.993468 | |
–5.656854 | 0.022369 | 0.000008 | –5.656854 | 0.022369 | 0.000311 | –7.999982 | |
2.828427 | 0.011184 | 0.003169 | 2.828427 | 0.011184 | 0.019937 | 4.006550 | |
2.827422 | 2.588079 | 2.514980 | 2.827422 | 2.588079 | 2.488755 | 3.990769 | |
–5.656853 | –5.634486 | –5.039992 | –5.656853 | –5.634486 | –5.039690 | –7.999965 | |
2.829432 | 3.091143 | 2.525028 | 2.829432 | 3.091143 | 2.551555 | 4.009267 | |
Fig. 12Transformed vibration acceleration after frequency weighting of X-Y or Z axis
3. Comfort assessment indexes
3.1. ISO vibration comfort assessment indexes
The commonly used assessment indexes in ISO-2631 include root mean square (r.m.s.) acceleration (ms-2) and VDV (ms-1.75), and can be calculated, respectively, by the two equations below [16]:
where , and VDV are the root mean square of acceleration and the vibration dose value, respectively; is the weighted vibration acceleration; and are the sample point numbers of vibration duration and acceleration time-history, respectively.
Since the blasting vibration proceeds simultaneously on three directions, the overall effect of vibrations should be comprehensively taken into account in vibration comfort assessment and can be converted into a unidirectional ( axis) effect by the following equations:
where , and are the weighted root mean square accelerations of -axis, -axis and -axis, respectively; , and are the vibration dose values of -axis, -axis and -axis, respectively; is the converted total weighted root mean square acceleration; are the converted total vibration dose values.
Given that the basic assessment method (the weighted r.m.s. acceleration) for blasting vibration would underestimate the impact of vibration on human, in this paper, the quadruplicate VDV was adopted as the assessment index.
3.2. assessment index
German standard DIN4150-2 [21] has defined the relevant assessment index of transient vibrations such as blasting vibration and has specified the requirements of assessing human exposure to building vibrations. The DIN4150-2 standard was applicable to periodic vibrations and aperiodic vibrations with a frequency range of 1-80 Hz, and the assessment parameters include the “maximum weighted vibration severity” and “assessed vibration severity” . Comparing and with “guideline values” and if the assessment parameters are greater than the “guideline values”, discomfort will be imposed on the residents living in the building. The “guideline values” , and are selected as per Table 1 of DIN4150-2. As for those transient vibrations occurring less than three times a day (such as blasting vibration), according to Article 6.5.1 of DIN4150-2, if is less than or equal to ( 3 in this paper), the requirements of DIN4150-2 can be satisfied. As specified by Article 7 of DIN4150-2, the two equations below can be adopted to approximately calculate :
where PPV is the peak particle velocity, mm/s; is the cut-off frequency of high-pass filter, 5.6 Hz; is the principal vibration frequency, Hz; is the coefficient, selected as per Table 3 of DIN4150-2 and set as 0.7 in this paper.
3.3. Annoyance rate-based comfort assessment index
Assessment indexes VDV and only reflect the impact of vibration features on comfort, but the impact of other factors like the physical and psychological states of the humans concerned and the environmental conditions are largely neglected. The feeling of a human body to a vibration environment is influenced by multiple conditions, such as vibration characteristics, activities in which the residents are engaged inside the buildings, visual and acoustical induction factors, etc. Moreover, since humans of different gender, age, career and health condition are affected by vibration differently, there is a very strong randomness in the human feeling towards vibration. Further, there is no method that can measure the subjective responses of human beings, such as weak vibration feeling, strong vibration feeling, etc. Even for the same human, he or she may not be sure about his or her own feeling. Hence, the measured results are inevitably ambiguous to a certain extent. In view of such uncertainty, other research on the responses of human being to a vibration environment both at home and abroad, questionnaires or surveys are often used to evaluate the disturbance level or the degree of human feeling towards vibration. In addition, the five levels of non-vibration feeling, weak vibration feeling, medium vibration feeling, strong vibration feeling and intolerability are adopted in most surveys to describe the subjective responses of human beings. Lots of studies have indicated that the human perception of vibration is influenced not only by the randomness caused by the differences of vibration as perceived by people, but also by the confusion caused by the judgment concepts that are poorly defined [22]. By analyzing the two types of uncertainty and combining the fuzzy mathematics and probability theory with the experimental psychology and experimental statistical method, the literatures [22-23] proposed that the annoyance rate is adopted as a quantitative assessment index of vibration comfort. Annoyance rate is defined as the proportion of the number of people with annoyance responses to the total number of people assessed under a certain vibration intensity, reflecting the proportion of people who are annoyed by the vibration or think the vibration is “unacceptable” given a certain vibration intensity and environment.
3.3.1. Fuzzy model
In fuzzy model, the most important factor is to determine the membership function of each fuzzy concept. It is the fuzzy statistical method that is most commonly used in engineering to determine the membership degree. Namely, the membership frequency of each concept is obtained from the number of people under all kinds of responses divided by the statistical overall number of people, and the membership frequency is adopted as the membership degree of this kind of response. In general, the interval scale that can be used to express the membership frequency of each concept is:
where is the membership degree of the th concept, and is the adopted judging category number.
The distance between two concepts is defined as:
To the determined set: ,
To the random set: ,
where and are the respective attribute values of the th set and the th set, and is the expected value.
Assuming the two kinds of subjective responses are mutually independent, then for 1 (i.e., the farther away from the concept of “very comfortable”, the higher the membership degree of concept which belong to the response of annoyance). The membership degree of each concept which belongs to the response of annoyance is defined as:
where is the distance between two extreme concepts in the fuzzy model.
3.3.2. The relation between membership degree and vibration acceleration
At present, the subjective responses of a human being to vibration are given mainly in the form of corresponding acceleration range, so that the membership function determined using the signal detection theory on the coordinates of vibration intensity can be defined, thereby giving the relation between membership degree and vibration acceleration. Both local and overseas research show that the membership degree value of concept for subjective responses is directly proportional to the log value of its membership quantity, namely, Fechner law of psychophysics, i.e.:
According to Eq. (14), as long as the values of acceleration corresponding to the lower and upper limits of human beings’ subjective responses under a certain environmental condition are given, the membership degree value of concept from a specific response (such as response to annoyance) under this environmental condition can be ascertained.
3.3.3. Annoyance rate model
At present, the model of annoyance rate is widely used in the vibration comfort evaluations of buildings, automobiles, bridges, etc. [9-10, 24-25]. Among them, there is no shortage of comfort evaluation of transient impact vibrations similar to that of blasting vibration. In all these evaluations, satisfactory results are obtained, which verify the reliability and applicability of this mathematical model from another perspective. After considering the judgmental fuzzification of vibration subjective responses, according to the statistical method of set value and the calculation method of annoyance rate, the annoyance rate under the discrete condition is:
where is the th weighted root mean square acceleration; is the number of people with the th kind of subjective response due to the th vibration intensity; is the conceptual membership of the th subjective response belonging to the “unacceptable” range; is the number of specified subjective responses levels. If five levels (“no vibration sense”, “slight vibration sense”, “moderate vibration sense”, “strong vibration sense”, “intolerable”) are employed to describe the subjective responses of people, then 5; is the total number of people assessed under the th vibration intensity. , which reflects the differences of sensitivity degree.
In the case of continuous distribution, the differences of sensitivity can be described by logarithmic normal distribution, and when the weighted root mean square acceleration is , the calculation formula of annoyance rate is:
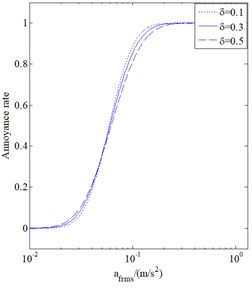
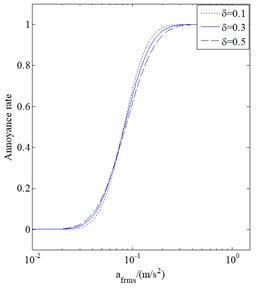
The annoyance rate under arbitrary weighted root mean square acceleration can be determined from Eq. (16). It can be seen from Eq. (15) that, as statistical data, the annoyance rate is a basis for assessing the vibration comfort. In the formula , is the variation coefficient, which ranges from 0.1 to 0.5 and is set at 0.3 in this paper, while its value has little affects on the annoyance rate. Griffin believed that people’s perception of vibration does not reject the normal and the lognormal distributions. Other researchers also found similar results. Although different values of the variation coefficient were obtained by different researchers, such as 0.3 by Griffin, and 0.5 and 0.1 by Forthergill and Magid, the lognormal distribution was found to have a closer fitting to the measured data. Therefore, the variability of human perception of vibration can be considered to follow the logarithmic normal distribution. As to why choose the variation coefficient equal to 0.3 will be discussed in the following. Fig. 13 shows the annoyance rate curves for the variation coefficient equals to 0.1, 0.3 and 0.5. It is apparent that the impact on the calculation results of annoyance rate is very small when the variation coefficient is 0.1, 0.3 and 0.5. Therefore, the variation coefficient of 0.3 and the logarithmic normal distribution are used. is the fuzzy membership function related to vibration intensity and can be expressed as:
where is the “imperceptible” vibration or the upper limit of “impact-less” vibration acceleration; is the lower limit of “intolerable” acceleration vibration. Both and should be determined first in the calculation and then the undetermined constants and .
Fig. 13Annoyance rate curves when the variation coefficient is 0.1, 0.3, 0.5
a) For horizontal vibration
b) For vertical vibration
ISO2631-2 defines the vibration sense threshold as the vibration intensity that people are able to perceive exactly under general circumstances, and both and can be expressed as the multiples of the vibration sense threshold. For the horizontal vibration and other unidentified direction vibrations, ISO2631-2 stipulates a threshold of 0.0036 m/s2; for the vertical vibration, a threshold of 0.005 m/s2 is stipulated. The standard also defines the multiples table for assessing different buildings at different times. The calculation parameters can be seen in Table 2.
Table 2Acceleration multiples used in analysis
Location | Time | (×) | (×) |
Demanding areas | Daytime | 1.0 | 4.0 |
Nighttime | 1.0 | 4.0 | |
Residence | Daytime | 2.0-4.0 | 8.0-16.0 |
Nighttime | 1.4 | 5.6 | |
Office | Daytime | 4 | 16 |
Nighttime | 4 | 16 | |
Workshop | Daytime | 8 | 32 |
Nighttime | 8 | 32 |
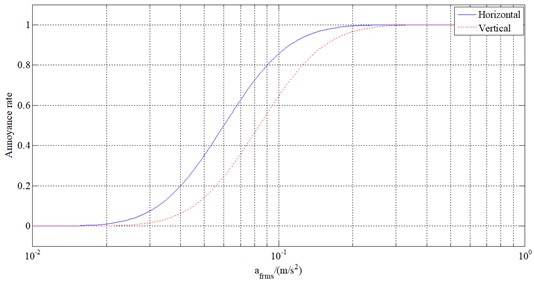
Two aspects were considered in this paper: the impact of blasting vibration on residential buildings near the blasting construction area and the blasting operation being conducted at daytime. According to Table 2, the and can be, respectively, obtained from the mean value of the given acceleration multiples for daytime. So also , . Having substituted them into Eq. (17), the calculation results of , and are, respectively, provided in Table 3. Further, the annoyance curves under various conditions can be calculated as per Eq. (16). The daytime annoyance rate curves were provided in this paper, as shown in Fig. 14.
Table 3Fuzzy membership function coefficient of annoyance rate
Vibration direction | ||||||
Horizontal | 0.0036 | 0.0108 | 0.0432 | 0.7213 | 3.2664 | 0.294 |
Vertical | 0.005 | 0.0150 | 0.0600 | 0.7213 | 3.0294 | 0.294 |
Fig. 14Annoyance rate curves for horizontal and vertical vibration
4. Analysis of engineering cases
4.1. Calculation of vibration comfort indexes
During the open blasting operation of a hydropower project, the blasting vibration velocity monitoring in adjacent buildings was conducted, and 14 groups of monitoring data were obtained. It can be seen from the monitoring results that, the principal vibration frequency was mainly distributed in the range of 10-40 Hz, the PPV 0.10-3.90 cm/s, and the duration time 0.4-2.8 s. The data were listed in Table 4 from low vibration velocity to high vibration velocity. Based on the 14 groups of monitoring data, the VDV, and annoyance rate values were, respectively, calculated. Given that blasting vibrations spread simultaneously in three directions, it would be more realistic to consider the whole effect of vibration in the three directions. The total effect of vibration in the three directions for human postures was calculated, as listed in Table 4. The converted total weighted root mean square acceleration was adopted to calculate the annoyance rate, and the fuzzy membership function coefficients , and were obtained according to the vertical direction values in Table 3. Meanwhile, it should be noted that could be employed to calculate the VDV in only a single direction and had no correlation with human postures.
Table 4Calculation results of annoyance rate and results of field survey
No. | Channel | PPV, (cm/s) | Principal vibration frequency (Hz) | Time (s) | Posture | (m/s2) | VDV (ms-1.75) | Annoyance rate | Survey results | |
1# | CH1 | 0.22 | 18.9 | 1.5 | Standing | 0.0221 | 0.0337 | 0.96 | 0.003 | A |
CH2 | 0.10 | 27.2 | Supine | 0.0275 | 0.0589 | 0.45 | 0.018 | A | ||
CH3 | 0.14 | 17.8 | Lateral | 0.0300 | 0.0591 | 0.60 | 0.020 | A | ||
2# | CH1 | 0.20 | 34.5 | 1.2 | Standing | 0.0223 | 0.0309 | 0.92 | 0.003 | A |
CH2 | 0.30 | 20.9 | Supine | 0.0319 | 0.0496 | 1.32 | 0.022 | A | ||
CH3 | 0.25 | 29.4 | Lateral | 0.0200 | 0.0294 | 1.13 | 0.002 | A | ||
3# | CH1 | 0.31 | 17.9 | 1.6 | Standing | 0.0350 | 0.0529 | 1.34 | 0.031 | A |
CH2 | 0.16 | 31.2 | Supine | 0.0264 | 0.0373 | 0.73 | 0.017 | A | ||
CH3 | 0.39 | 27.4 | Lateral | 0.0496 | 0.0738 | 0.76 | 0.134 | A | ||
4# | CH1 | 0.28 | 18.9 | 1.3 | Standing | 0.0385 | 0.0571 | 1.22 | 0.062 | A |
CH2 | 0.37 | 24..8 | Supine | 0.0393 | 0.0634 | 1.65 | 0.064 | A | ||
CH3 | 0.41 | 31.5 | Lateral | 0.0333 | 0.0523 | 1.87 | 0.022 | A | ||
5# | CH1 | 0.43 | 20.2 | 1.5 | Standing | 0.0684 | 0.1018 | 1.88 | 0.371 | A |
CH2 | 0.39 | 23.7 | Supine | 0.0475 | 0.0689 | 1.74 | 0.128 | A | ||
CH3 | 0.45 | 26.5 | Lateral | 0.0402 | 0.0609 | 2.02 | 0.072 | A | ||
6# | CH1 | 0.52 | 23.0 | 2.8 | Standing | 0.0704 | 0.1074 | 2.31 | 0.378 | B |
CH2 | 0.48 | 26.0 | Supine | 0.0539 | 0.0834 | 2.16 | 0.142 | A | ||
CH3 | 0.50 | 23.5 | Lateral | 0.0411 | 0.0627 | 2.22 | 0.076 | A | ||
7# | CH1 | 0.66 | 20.0 | 0.95 | Standing | 0.0568 | 0.1005 | 2.89 | 0.149 | B |
CH2 | 0.68 | 22.0 | Supine | 0.0494 | 0.0964 | 3.01 | 0.133 | B | ||
CH3 | 1.15 | 20.8 | Lateral | 0.0533 | 0.1174 | 5.05 | 0.142 | B | ||
8# | CH1 | 0.78 | 19.8 | 0.9 | Standing | 0.0520 | 0.0811 | 3.41 | 0.166 | B |
CH2 | 0.82 | 14.7 | Supine | 0.0517 | 0.0824 | 3.45 | 0.166 | B | ||
CH3 | 1.15 | 31.7 | Lateral | 0.0529 | 0.0785 | 5.25 | 0.169 | B | ||
9# | CH1 | 1.33 | 37.0 | 1.2 | Standing | 0.0976 | 0.1836 | 6.14 | 0.625 | B |
CH2 | 1.19 | 7.5 | Supine | 0.0862 | 0.1575 | 4.46 | 0.516 | B | ||
CH3 | 0.82 | 27.0 | Lateral | 0.0490 | 0.0930 | 3.70 | 0.132 | B | ||
10# | CH1 | 0.91 | 29.6 | 0.6 | Standing | 0.1022 | 0.1697 | 4.13 | 0.626 | B |
CH2 | 1.18 | 12.6 | Supine | 0.0901 | 0.1554 | 4.86 | 0.585 | B | ||
CH3 | 0.98 | 15.1 | Lateral | 0.0775 | 0.1300 | 4.14 | 0.421 | B | ||
11# | CH1 | 1.07 | 20.4 | 1.1 | Standing | 0.0860 | 0.1500 | 4.70 | 0.581 | C |
CH2 | 1.73 | 23.5 | Supine | 0.1235 | 0.2533 | 7.70 | 0.714 | C | ||
CH3 | 1.06 | 32.6 | Lateral | 0.0570 | 0.1011 | 4.85 | 0.149 | C | ||
12# | CH1 | 0.83 | 22.2 | 0.7 | Standing | 0.0840 | 0.1509 | 3.67 | 0.621 | C |
CH2 | 2.20 | 16.1 | Supine | 0.2047 | 0.3688 | 9.38 | 1.000 | C | ||
CH3 | 2.03 | 26.3 | Lateral | 0.1196 | 0.2141 | 9.08 | 0.702 | C | ||
13# | CH1 | 3.05 | 32.5 | 0.5 | Standing | 0.1897 | 0.3206 | 13.94 | 1.000 | C |
CH2 | 3.17 | 33.9 | Supine | 0.1801 | 0.3948 | 14.54 | 1.000 | C | ||
CH3 | 3.36 | 18.3 | Lateral | 0.2062 | 0.3276 | 14.55 | 1.000 | C | ||
14# | CH1 | 2.73 | 15.4 | 0.4 | Standing | 0.1925 | 0.3220 | 11.57 | 1.000 | C |
CH2 | 3.90 | 11.6 | Supine | 0.2836 | 0.4419 | 15.85 | 1.000 | C | ||
CH3 | 3.05 | 14.1 | Lateral | 0.1480 | 0.2656 | 12.77 | 1.000 | C |
In field comfort survey, the responses of residents were recorded and divided into three levels, that is, no obvious response (A), moderate response (B), and intense response (C). “No obvious response” means that the blasting vibration neither significantly disturbs the daily life of residents nor terminates their activities in progress; “Moderate response” means that the residents are prevented from continuing their activities and are interfered and scared and even complain of such prevention of activities; and “Intense response” means that residents get together to stop the blasting operation and take other critical cases. The discontent and complaints of residents to blasting vibration effect is largely due to annoyance effect, concerns of destruction, and disruptions caused by all these responses. Age, income, gender, psychological state, and education all affect the responses in the blasting vibration comfort evaluation. Therefore, in this paper, the blasting vibration comfort evaluation to obtain the reliable comfort evaluation conclusions in this region is mainly based on the main residents’ attitudes to blasting seismic effect around the blasting operation (gender, age, income, level of education, and the social environment data of similar populations that account for the largest number of population groups). In the concrete implementation process, a total of 5 households are within the scope of blasting monitoring, and each household has 3-6 people, for a total of 23 people. Among the total people, there is a total of 13 people are 20-45 years old, of a junior middle school culture level, with a healthy body, and with a similar social environment. The head of a household often pays more attention to the harm effects of blasting operation. These 13 persons formed the main residents of this area, and the survey is aimed at the 13 respondents. Later, 4 respondents’ survey results are excluded because their survey results vary widely with other 9 respondents, the results may be affected by the psychological issues and economic benefits. The comfort of blasting vibration is a subjective feeling which apart from the blasting vibration itself, is also influenced by various subjective factors. As it is also driven by various mentalities and economic benefits, it is inevitable that the complaints are not always valid. Therefore, during the subjective survey of comfort, the surveyor clearly explained to the respondents that the survey was unrelated to their economic benefits, and they were only required to describe their true feelings. In the analysis of survey results, some clearly unreasonable results were excluded so as to ensure the final results are reliable. The remaining 9 respondents were divided into 3 groups, each a group of 3 respondents. Each group respectively assumed the 3 postures-standing, supine and lateral-to feel the blasting vibration, and they immediately filled out their responses without communicating with each other. In order to ensure the reliability of the survey results, everyone took turns to assume the 3 postures. The survey results are consistent between different respondents; when there are different opinions, they adopted the opinions of the majority. See the survey results in Table 4.
4.2. Discussion
It has been proven that by ensuring the duration curve of measured vibration velocity is reliable and by selecting the appropriate wavelet basis function and the decomposition layer number, it is feasible to obtain the required waveform of acceleration through the differential calculus of measured velocity waveform, and that the calculated results are accurate and reliable. When the frequency-weight is conducted on the calculated signal of the vibration acceleration, it can take into account the different sensitivity of a human body to different frequency components. The evaluation indexes of comfort level, such as VDV, , and annoyance rate, etc. can also be calculated, which are accurate and reliable. The VDV and are the evaluation indexes of vibration comfort stipulated by ISO2631 and DIN4150-2, they are also applicative indexes for the evaluation of comfort due to random and transient impact vibration. In this study, the VDV and are used to evaluate the comfort of blasting vibration, and the desired results are obtained. The comfort of blasting vibration is a subjective feeling, but both the VDV and are objective and qualitative evaluation methods. Given the duration of blasting vibration, the evaluation indexes can be calculated indicating that it is either comfort or discomfort. However, to different respondents and different natural and social environments, the comfort or discomfort is not a constant. Therefore, the model of annoyance rate is introduced as a method by which the comfort of blasting vibration can be quantitatively evaluated. The model of annoyance rate is the probability occupied by the number of people with the feeling of discomfort in the overall number of people under the same condition of vibration. Hence, the annoyance rate is a better indicator of comfort than the VDV and .
Using the accelerations obtained from the calculations and from the measurements, the r.m.s acceleration and VDV are also calculated. This is to check on the accuracy and consistency of and VDV. For Fig. 9(a), the obtained r.m.s acceleration is respectively 0.0407 and 0.0414, the obtained VDVs are respectively 0.0618 and 0.0631, and the obtained annoyance rates are respectively 0.074 and 0.077. For Fig. 9(b), the obtained r.m.s. acceleration is respectively 0.0216 and 0.0221, the obtained VDVs are respectively 0.0324 and 0.0331, and the obtained annoyance rates are respectively 0.003 and 0.003. Thus, as the calculated , VDV and annoyance rate using the calculated and measured accelerations are very small, blasting vibration comfort is not affected by the calculations. Finally, it is also suggested that the application of this algorithm to a recorded vibration signal will not lessen the total energy of the signal.
Through the above measures and analyses, the reliability of the objective evaluation method and the mathematical model (VDV, and annoyance rate) has been ensured as much as possible. It then further ensured the reliability of survey results of the comfort of subjective feeling. On this basis, it carried out the comparative analysis of both, and proposes the corresponding control standard of comfort to make sure that the conclusions of this study are valid. Furthermore, based on the control standard of blasting vibration, engineering measures were recommended in order to limit the blasting vibration below a certain level. These measures are to ensure the comfort feelings of the residents in the surrounding area are not adversely affected thereby reducing the number of complaints.
Differing from mechanical vibration and other vibrations caused by vehicles and ships, blasting vibration is an impact vibration. So, instead of directly applying the control standards of other fields for the comfort assessment of blasting vibration, suitable assessment indexes and standards should be determined through analyzing blasting cases. It can be seen from the calculation results of in Table 4 that when the index is less than 3.0, the residents have no obvious response (A) to the vibration; when the index exceeds 3.0, the residents successively show moderate response (B) and intense response (C), indicating that actual disturbances occur. It thus can be seen that relevant provisions specified in DIN4150-2 concerning on transient vibration can be used for assessing blasting vibration comfort. However, with the increase of the value, it is difficult to do further quantitative analysis.
ISO-2631 has provided the commonly-used comfort assessment indexes, that is, weighted r.m.s. acceleration and VDV, of which VDV index is more suitable for assessing the blasting vibration comfort. The assessment approach is employed to assess the impact of vibration on residents through combining VDV with (the number of times of reaching the designated VDV level ), which was first introduced by Griffin to assess the overall impact of continuous multiple vibrations on the vibration comfort of buildings. Various levels and the resident complaints degrees hereby caused were as shown in Table 5 [16].
is calculated by the following formula:
where is the VDV value of one vibration incident. For the 14 groups of data of the case above, the calculation results of VDV range from 0.03 to 0.442; it can be seen from Table 5 that carrying out blasting operation once can cause rare dissatisfaction or much dissatisfaction when VDV is greater than 0.217 and 0.434, respectively. As for the blasting operation of this case, with blasts conducted twice a day and lasting for months, based on the division methods of the impact on the buildings comfort according to Griffin, such a continuous multiple operation “severely impacts” the vibration comfort of residents. As indicated in Table 4, when VDV is less than 0.15, the residents basically show no obvious response (A) or moderate response (B) to the vibration; when VDV is greater than 0.15, especially when it exceeds 0.2, the residents show intense response (C), which is different from the control standards in Table 5 , suggesting that assessing the blasting vibration that is a kind of transient vibration by is different from that of continuous vibration, and it should be determined by analyzing a large quantity of engineering cases. Besides, the VDV value changes insignificantly with human postures, which, combined with the fact that the residents with different postures basically respond consistently to the same blasting, suggests that the impact of different human postures on blasting vibration comfort is insignificant, or, in other words, that no posture exists that is especially “sensitive” to blasting vibration. This may be explained by the fact that blasting vibration is a kind of transient impact vibration.
Table 5Resident response to different levels of VDVs
/ ms-1. 75 | < 0.108 | < 0.217 | < 0.434 | < 0.868 |
Possibility of resident complaint | Very rare | Rare | Frequent | Very frequent |
As seen in Table 4, the values of annoyance rate (no obvious response [A], moderate response [B] and intense response [C]) are respectively, 0-0.132, 0.133-0.580, 0.581-1.000. The calculation results show that the variation regularity of annoyance rate values and the results of the comfort survey are consistent. Perhaps some individual data of annoyance rate values is not located in this range (such as 5#CH1, 5#CH3, 9#CH1, 10#CH1, 11#CH3), and does not agree with the results of the survey. This is mainly due to confusion and the uncertainty of the subjective feelings of the respondents, and is related to the respondents activities, psychological state, physiology, and so on. And the results of survey are in the foreseeable range: the difference is between A and B or B and C, with no large jumps between A and C. Another explanation for this may be the errors of the respondents due to subjective judgment. The annoyance rate method has some advantages over the and VDV methods. It can consider some uncertain factors that affect human subjective reaction, and it can calculate the percentage of the number of people who are annoyed, achieving the quantitative evaluation to a certain degree.
Comparing the above three assessment indexes, there is a certain correlation between the calculation results and the survey results, so as long as rational assessment standards is established and employed, the impact of blasting vibration on comfort will be validly evaluated to a certain extent. Among the three assessment indexes, , which adopts velocity as the assessment metric, is in fact a weighted vibration velocity value. has some advantages like simple calculation and clear meaning; however, it cannot be used to calculate the total effect of vibrations in multiple directions and the factor of human postures can not be taken into account. The calculation process of VDV index is more complex than that of index but simpler than that of annoyance rate, and the factor of human postures can be taken into consideration as well. The above two types of vibration comfort indexes have provided determined allowable vibration acceleration (velocity) value. Exceeding the standard is considered to be completely uncomfortable, while being less than the standard is considered to be completely comfortable, which can only realize the qualitative assessment. Unlike the two indexes above, the annoyance rate index takes into consideration the vibration features and the uncertainty of human subjective response to vibration and can achieve the goal of the quantitative assessment of vibration comfort. Compared with other assessment indexes, the annoyance rate index comprehensively considers more factors concerned. However, the calculation process is relatively complex, and the assessment effect needs to be analyzed and validated by more cases.
5. Conclusions
In order to explore the methods and standards that are suitable for the comfort assessment of people experiencing blasting vibration, blasting vibration monitoring, analytic calculation, and field survey were utilized to comparatively analyze the VDV, , and annoyance rate indexes. The three indexes can all be adopted to assess the comfort of blasting vibration: the first two indexes are easy calculations but can only be employed for qualitative assessment of comfort; while the annoyance rate index involves a complex calculation procedure but comprehensively considers more factors concerned and can be employed for quantitative assessment of blasting vibration comfort. The three assessment indexes can be selectively adopted according to the specific occasion and the goal of comfort assessment. However, it is difficult to determine their respective reasonable assessment standards. In this paper, preliminary recommended control standards have been defined, and, of course, more engineering cases need to be studied for further determination.
References
-
Spathis A. T.,Brodbeck A. Future directions in ground vibration and airblast control within Australian regulatory context. Proceedings of the Thirty-First Annual Conference on Explosives and Blasting Technique, International Society of Explosives Engineers, Cleveland, OH, 2005, p. 263-276.
-
Loeb J., Tannant D. D. Urban construction blasting in Canada – complaints and associated municipal bylaws. Civil Engineering and Architecture, Vol. 2, Issue 1, 2004, p. 1-10.
-
Cengiz K., Erim G. The problem of human response to blast induced vibrations in tunnel construction and mitigation of vibration effects using cautious blasting in half-face blasting rounds. Tunnelling and Underground Space Technology, Vol. 24, Issue 1, 2009, p. 53-61.
-
Hustrulid W. A. Blasting Principles for Open Pit Mining, Vol. 1. A. A. Balkema, Rotterdam, 1999, p. 269-292.
-
Chiappetta R. F., van Vreden A. Vibration/airblast controls, damage criteria, record keeping and dealing with complaints. BME Surface Blasting Course, Johannesburg, South Africa, October, 2000.
-
Raina A. K., Haldar A., Chakraborty A. K., et al. Human response to blast-induced vibration and air-overpressure: an Indian scenario. Bulletin of Engineering Geology and the Environment, Vol. 63, Issue 3, 2004, p. 209-214.
-
Randall K. N. Forensic Engineering Investigation. CRC Press, New York, NY, USA, 2001.
-
Song Z. G., Bai Y., Jin W. L. Vibration serviceability analysis of buildings near the area of blasting operation. Journal of Vibration and Shock, Vol. 29, Issue 9, 2010, p. 129-133.
-
Zhang X. C., Zhang C. C., Zhang L., et al. Effects of subway transit vibration on the human body amenity in surrounding buildings. Journal of China University of Mining and Technology, Vol. 38, Issue 6, 2009, p. 835-839.
-
Tang C. Y., Zhang T. X., Li H., et al. Evaluation of ride comfort of a vehicle. Journal of Vibration and Shock, Vol. 27, Issue 9, 2008, p. 158-166.
-
Song Z. G., Jin W. L. Serviceability design of ice-induced platform vibration based on ice zoning map of Bohai sea-acceptable acceleration levels. The Ocean Engineering, Vol. 23, Issue 2, 2005, p. 61-65.
-
BS 6841, Guide to measurement and evaluation of human exposure to whole-body mechanical vibration and repeated shock. British Standards Institution, London, UK, 1987.
-
ISO 2631, Mechanical vibration and shock-evaluation of human exposure to whole-body vibration. Part 1: general requirement. International Organization for Standardization (ISO), Geneva, Switzerland, 1997.
-
ISO 2631, Mechanical vibration and shock-evaluation of human exposure to whole-body vibration. Part 2: Vibration in buildings (1 Hz to 80 Hz). International Organization for Standardization (ISO), Geneva, Switzerland, 2003.
-
ISO 8041, Human response to vibration-Measuring instrumentation. International Organization for Standardization (ISO), Geneva, Switzerland, 2005.
-
Griffin M. J. Handbook of Human Vibration. Academic Press, London, UK, 1994.
-
Siskind D. E., Stagg M. S., Kopp J. W., et al. Structure Response and Damage Produced By Ground Vibrations from Surface Blasting. RI 8507, U.S. Bureau of Mines, Washington, DC, USA, 1980.
-
Gilbert F. K., Kenneth J. G. Explosive Shocks in Air. Springer, Berlin, Germany, 1985.
-
Osama M., Al-Hunaidi Guan W. Digital frequency-weighting filters for evaluation of human exposure to building vibration. Noise Control Engineering Journal, Vol. 44, Issue 2, 2996, p. 79-91.
-
Rimell A. N., Mansfield N. J. Design of digital filters for frequency weightings required for risk assessments of workers exposed to vibration. Industrial Health, Vol. 45, Issue 4, 2007, p. 512-519.
-
DIN 4150-2, Structure Vibration-Human exposure to Vibration in Buildings. German Institute for Standardisation, 1999.
-
Song Z. G. A New Annoyance-based Vibration Comfort Design Theory on Engineering Structures. Zhejiang University, Hangzhou, China, 2003.
-
Fa Y. S., Li D., Sun C. H. Vibration analysis for a footbridge under stochastic pedestrian load and a new method for comfort evaluation. Journal of Vibration and Shock, Vol. 27, Issue 1, 2008, p. 119-123.
-
Shen X. Z., Teng J. Vibration serviceability assessment method for floor structures based on random walking force and annoyance rate. Journal of Vibration and Shock, Vol. 31, Issue 22, 2012, p. 71-95.
-
Tang C. Y., Zhang Y. M., Zhao G. Y., et al. Annoyance rate evaluation method on ride comfort of vehicle suspension system. Chinese Journal of Mechanical Engineering, Vol. 27, Issue 2, 2014, p. 296-303.
About this article

This work is supported by the National Natural Science Foundation of China (No. 51009104).
