Abstract
In this study, we conducted a shaking table test and numerical simulation on a complex eccentric structural model. The degree of torsional effects of each floor in the eccentric structural model was analyzed by defining relative torsional displacement. In order to ensure that the test result was reliable, we also compared numerical simulation data with the test data for some representative layers under different loading conditions. The layer relative torsional displacement under different loading conditions was studied. The study indicated that although layer torsional response behaviors in the complex eccentric structural model were influenced by the component distribution form, this influenced discipline differed from that under monolayer eccentric or multilayer uniform eccentric structural systems. The structure torsional responses varied under different seismic excitations. The test result and numerical analysis may provide some observations for a further seismic performance analysis of complex eccentric structures.
1. Introduction
Along with the social and economic rapid development, infrastructure investment significantly increases, the construction of high-rise buildings becomes a tendency and their forms also become more complicated to meet the aesthetic value in different areas. All these increasing demands raise some new problems and challenges in the field of civil engineering. This leads to the increased number of complex eccentric structures. However, these eccentric structural forms result in not only nonuniform mass and stiffness distribution but also stiffness center and mass center misalignment. Correspondingly the resultant force of earthquake inertia force mismatch with the resultant force of structural resistance. In such a case, torsional effects occur. Quite a few earthquake disasters shows that the torsional effect is the crucial factor in making building structures suffer earthquake damage. Moreover, many asymmetric eccentric buildings show significant torsional damage characteristics [1].
In the 1980s, Chopra and Hejal [2] studied the influences of eccentricity ratio (), lateral torsional stiffness ratio (), natural period of vibration (), and beam-column stiffness ratio () on multilayer frame torsional effects. Their study indicated that torsional effect increased as the eccentricity ratio () increased. Lateral torsional coupling effect could be most significant when the eccentricity ratio () was close to 1. The effect of high-order modes became more significant when the natural period of vibration () increased and the beam-column stiffness ratio () decreased.
In recent years, based on these above principles, many researchers have made some further achievements in the study on the dynamic characteristics of eccentric structures. Colunga and Rojas [3] set a three dimensional frame model with three layers as an objective. They used a nonlinear dynamic analysis method and adjusted the inter-story stiffness distribution to analyze the peak value of structural displacement response under different eccentricity ratio conditions. Compared symmetrical structural displacement response with eccentric structural displacement response under different seismic waves, they analyzed the effect of eccentricity disparity and demonstrated that structural displacement response increased as the eccentricity increased.
Kyrkos and Anagnostopoulos [4] conducted some research on structural design and tested the difference between structural response discrepancy and widget hierarchy when the eccentricity ratio is 0.1 or 0.2. They found that the displacement difference between the rigid side and the flexible side of a structure varied. The difference and the structural torsional effect increased as the eccentricity ratio increased.
Kilara et al. [5] analyzed relative displacement on the both side of a structure, inter-story drift angle and structural torsion. The eccentricity ratio was taken as 0, 0.05, 0.1, 0.15, or 0.193. They found that eccentricity ratio had a great impact on the relative displacement difference between the rigid side and the flexible side of the structure, inter-story drift angle and torsional effect. Moreover, the impact differed between the top floor and the ground floor. The torsional effect on the top floor was more significant than that on the ground floor.
Colunga and Cruz [6] made a nonlinear dynamic structural response analysis of a rigid foundation and independent foundation under different eccentricity conditions. They compared the maximum displacement response with those of non-eccentric structures and they found that the eccentricity difference had an effect on the structural displacement response in different models and the peak value of different eccentric structural displacement varied.
Moreover, other researchers also got considerable achievement in the field of the anti-seismic property of eccentric structures. They concluded that eccentricity ratio had a crucial impact on the seismic response of multi-layers eccentric structures. However, previous research objectives were mainly on multi-layer uniform eccentric structures [7-19]. That is, the eccentric distribution of each layer is assumed be identical, while this kind of ideal model is different from some eccentric situations in practice. Generally, the double eccentricities ( and ) of each layer of a structure are different. Due to this disparity, the previous researches may not completely reflect the actual dynamic responses of some real structures. The seismic response of multilayer complex eccentric structures should be emphasized. However, most current theories and conclusions comes from the researches on monolayer eccentric and uniform multilayer eccentric structures. The effects of different forms of seismic excitations also are ignored. Complex eccentric structures need to be further studied, which is not limited to monolayer structures and uniform eccentric structures.
In this study, we carried out a shaking table test and numerical simulation on a complex eccentric structural model. We analyzed the effects of eccentricity of complex eccentric structures to verify whether it is consistent with the conclusions from monolayer eccentric and multilayer uniform eccentric structural models. The effects of different seismic excitations were also considered. The numerical simulation analysis was conducted analyze the reliability of the test result. This study proposed the concept of relative torsional displacement and provided some critical observations for some future researches on anti-seismic properties of complex eccentric structures.
2. Experimental program and result
The test was designed according to a practical building project. The building used a five-layer steel frame-brace system, with a 29.4 m height. The dimension of the planar construction is 102 m×102 m. The major column grid unit is 10.2 m×10.2 m. The spaces between the vertical components in the middle open hole position are 20.4 m, 30.6 m, and 40.8 m, respectively. Eight truss column groups were adopted in the internal layout. Because there were plenty of large spaces from the first floor to the third floor, and room dividers varied on different layers of the building, the lower column could not continue upward. Some frame columns on the upper layer were supported on conversion components. Many columns were disconnected on different layers, making vertical force transmission be interrupted and disconnected. The fourth floor and fifth floor had wide-ranging trusses which were as high as the layer. For the planar arrangements, different layers were staggered. Some same layer were also crossed and adjacent layers were stacked or crossed.
Since the structural layout forms of the prototype structure were very complicated in the test, the mass distribution and stiffness distribution are non-uniform. The mass center and stiffness center mismatched. Consequently the resultant seismic inertial force mismatched with the resultant structural resistance force. Therefore, this structure will exhibit significant torsional effects under seismic excitations. In Introduction, we knew that torsional effect is the crucial factor in making building structures suffer earthquake damage. To better analyze the seismic torsional properties of this structure, we adopted a shaking table test and analyze the dynamic structural torsional response directly.
Model designation requires geometric similarity, physical similarity and physical progress similarity [20-22]. In this test, the dimension of the shaking table was 6 m×6 m. Its load capacity was 60 t. It can be excited in three dimensional direction. The maximum acceleration is 1.5 g. Based on the structure model (1:20 in proportion to the practical structure), we analyzed the dynamic response of the steel frame-brace system to the earthquake action under different loading conditions. The structure model was 1.47 m in height and 4100 kg in weight. The mass blocks weight was 18800 kg. The model structural planar (5.1 m×5.1 m) was 1.47 m high with five layers. The story height were 0.37 m, 0.34 m, 0.34 m, 0.21 m and 0.21 m, respectively from the first floor to the top floor. The model structure was presented as shown in Fig. 1 and Fig. 2. Fig. 1 used the MIDAS commercial software to build the design model for the preliminary design stage [23-24]. The truss part was adopted with truss element. Floor plates were used with floor element and beams were used with beam element. The nodes were assumed as rigid connections. The material property of the steel frame was used Q345. The strength grade of the concrete floor was used with C30.
Fig. 1The schematic illustration of the structure MIDAS model
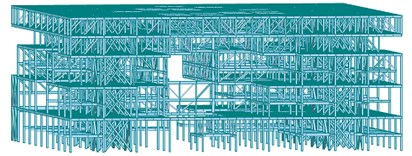
Fig. 2The schematic photo of the structure shaking table model
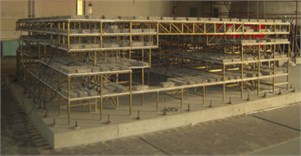
In this model design, we simulated the main components to resist the lateral force acting on the structure according to the stiffness equivalence principle. Since structural components were various and excessive, a simulation with the whole structural components would be a tough task. Therefore, we unified beam-column components with similar sizes with the same size, and we also merged the secondary beam section of the structure with the floor according to the stiffness equivalence principle by increasing the thickness of the floor. We used copper to stimulate the steel structure component. micro-concrete was used to stimulate concrete, and galvanized iron wire was used to stimulate reinforcing bar. Template was made by foamed plastic. The method of layer by layer pouring construction was applied to the structural model. The model was haunched and welded on its important joints. After the model structure was completely fabricated, we lifted it in place and put the mass blocks on the floor of the model structure.
The ratio of similitude of the critical parameter in the test was given in Table 1.
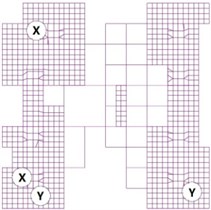
The complexity of the planar arrangement of the structure and the floor irregularity induced that the departure of mass center and stiffness center was irregular. The eccentricity ratio of the model structure, evaluated by the MIDAS software, was given in Table 2. Because the inherent eccentricity of the structural model was not easily observed in a normal plot scale, all the eccentricities in Fig. 3 were increased by ten times of the actual value. The actual eccentricities were presented in Table 2. In Fig. 3, CM represents the center of the mass of each floor. CSX represents the stiffness center on axis of each floor and CSY represents the stiffness center on axis of each floor.
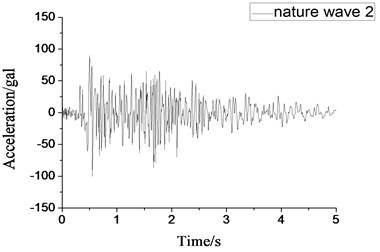
According to the Chinese Provision Code for Seismic Design of Buildings (GB 50011-2010) [25], when a time history analysis was adopted, not less than two groups of actual seismic waves and one group of artificial simulation of seismic wave should be selected. The selection was made according to the categories of construction sites and design earthquake patterns. Therefore the seismic waves adopted in this experiment were provided by the local seismological bureau which named natural wave 1, natural wave 2 and artificial wave, which conformed to the site category and design earthquake pattern. Natural wave 1 and natural wave 2 were the records of seismic waves of Tangshan Earthquake in in 1976. The artificial wave is one kind of synthetic waves. In the stage of severe earthquake, the structure inevitably enters the plastic stage, only one form of load could be chosen. Considering the loading ways of the seismic wave and seismic wave selection in the design stage by the design institute, we selected the seismic wave as shown in Fig. 7. A variety of load combinations were designed in the test according to the principle of shaking table input peak acceleration as follows: loading seismic wave in one-way, two-way and three-way earthquake excitation from -main and -main in the small earthquake stage; loading seismic wave in one-way, two-way and three-way earthquake excitation from -main and one-way earthquake excitation from -main in the moderate earthquake stage; loading seismic wave in one-way earthquake excitation from -main in the severe earthquake stage. Seismic waves used in the test were shown in from Figs. 4-7.
Fig. 3Schematic diagram of eccentric distribution
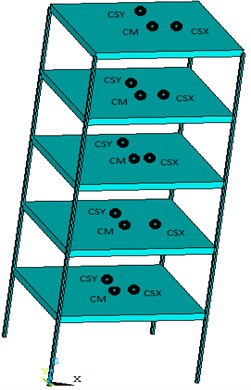
Table 1The similar relations of experimental modal
Physical quantity | Similarity ratio |
Strain | 1/1 |
Elastic modulus | 1/2.29 |
Poisson’s ratio | 1/1 |
Density | 4.81/1 |
Length | 1/20 |
Quality | 1/1663 |
Time | 1/6 |
Acceleration | 1.82/1 |
Table 2The eccentric ratio distribution of model
Layer No. | to the eccentricity | to the eccentricity |
5 | 0.038 | 0.071 |
4 | 0.024 | 0.028 |
3 | 0.011 | 0.070 |
2 | 0.051 | 0.013 |
1 | 0.027 | 0.004 |
Fig. 4Small-scale natural wave 1 acceleration time-history curve
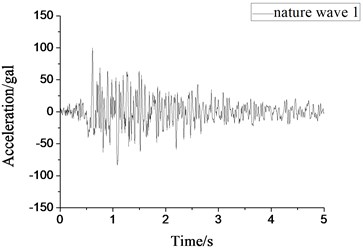
Fig. 5Small-scale natural wave 2 acceleration time-history curve
The number of test conditions, including white noise scanning, was forty-three. That means that forty-three kinds of conditions were adopted mainly according to the different situations of small, moderate and severe earthquake. The condition of small earthquakes stages was delicately grouped. One-way, two-way and three-way earthquake excitations were adopted in -main and -main directions, respectively. Referring to the advice and requirement of the design institute, the impact of direction earthquake excitation was more adverse in the moderate earthquake stage. So -main direction was adopted as the main excitation direction of the different kinds of seismic waves of one-way, two-way and three-way. In the severe earthquake stage, due to the structure was irrecoverable after entering the plastic stage, only one form of seismic wave could be chosen. Considering the loading ways of the seismic wave and seismic wave selection in the design stage by the design institute, the -direction artificial wave was used in this stage of the experiment. The prototype structure of the model used in the test was located in the region of seismic grade 7.5 degrees (M7.5). However, in order to explore the seismic capability of the structure model, the M8 and M8.5 large-scale seismic waves were applied after M7.5 large-scale seismic wave. When the overall stiffness became 60 % lower than the initial stiffness, higher seismic grade was not needed and the experiment was ended. Due to the limitation of the length of this paper, the conditions used in this study were summarized in Table 3.
Fig. 6Small-scale artificial wave acceleration time-history curve
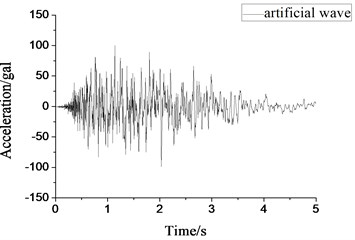
Fig. 7Large-scale artificial wave acceleration time-history curve
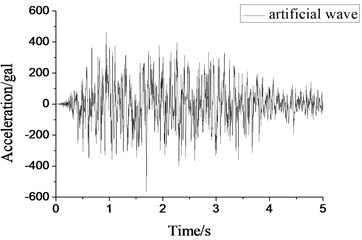
Table 3Seismic wave load principle
Serial number | Seismic waves | Direction | Peak acceleration (gal) | Equivalent to the real |
GK2 | Nature wave 1 | 58.8*1.82106.8 | Small earthquake of 7.5 degrees | |
GK3 | Nature wave 2 | 106.8 | ||
GK4 | Artificial wave | 106.8 | ||
GK5 | Nature wave 1 | 106.8 | ||
GK6 | Nature wave 2 | 106.8 | ||
GK7 | Artificial wave | 106.8 | ||
GK9 | Nature wave 1 | 0.85 | 106.891.1 | |
GK10 | Nature wave 2 | 0.85 | 106.891.1 | |
GK11 | Artificial wave | 0.85 | 106.891.1 | |
GK23 | Nature wave 1 | 160*1.82291.2 | Moderate earthquake of 7.5 degrees | |
GK24 | Nature wave 2 | 291.2 | ||
GK25 | Artificial wave | 291.2 | ||
GK29 | Nature wave 1 | 0.85 | 291.2247.5 | |
GK30 | Nature wave 2 | 0.85 | 291.2247.5 | |
GK31 | Artificial wave | 0.85 | 291.2247.5 | |
GK39 | Artificial wave | 570.4 | Large earthquake of 7.5 degrees | |
GK41 | Artificial wave | 735 | Large earthquake of 8 degrees | |
GK43 | Artificial wave | 931 | Large earthquake of 8.5 degrees |
This study used acceleration sensors to measure the dynamic response of the structure model. Due to the limitation on the number of device interfaces, it cannot arrange - and - two directions of acceleration sensors in all the positions. In addition, some sensors were also required to be installed in some particular locations by the design institute. Therefore, the rest of the acceleration sensors were only arranged in the typical position as much as possible. The purpose of this test was to analyze the torsional effects, these acceleration sensors were mainly distributed in the center of the floor and four corner positions to measure the torsion effect of the structure model. The hole arrangement of each floor and acceleration sensor layout were shown in Fig. 8.
Fig. 8Acceleration sensor layout drawing of the structure model
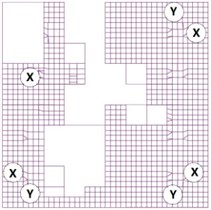
a) Acceleration sensor layout drawing of the first floor
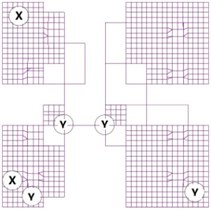
b) Acceleration sensor layout drawing of the second floor
c) Acceleration sensor layout drawing of the third floor
d) Acceleration sensor layout drawing of the fourth floor
e) Acceleration sensor layout drawing of the fifth floor
3. Torsional effect analysis
3.1. Definition of relative torsional displacement
Previous references have reported that when the seismic load acts on complex eccentric structures, the torsional effect will be more obvious. To observe these torsional phenomena more clearly and based on rigid floor hypothesis, some assumptions were preliminarily made as follows. The rotation center is identical to the floor center. The whole points on the same floor should have the same displacement in translational motion. However, the displacement difference between two points will occur due to the torsional effects. A new parameter is defined as relative torsional displacement to describe the displacement difference on the direction of the two adjacent angle points on the same floor. The definition is as shown in Fig. 9:
where – relative torsional displacement, – -direction displacement of Point A, shown in Fig. 9, – -direction displacement of Point B, shown in Fig. 9.
Based on this definition, we can clearly know the degree of the inter-story torsional effect on the structure under different seismic excitations.
3.2. Torsional response in the elastic stage
In the elastic stage, we used natural wave 1, natural wave 2 and artificial wave as seismic excitations separately from -direction and -direction. Take engineering condition from GK2 to GK7 in Table 3 as examples, the seismic waves chosen from the elastic stage was shown in Figs. 4-6.
The relative torsional displacements of the structure under different directional artificial earthquake waves (-direction or -direction) are shown in Figs. 10, 11.
Fig. 9Schematic diagram of the definition of the relative torsional displacement
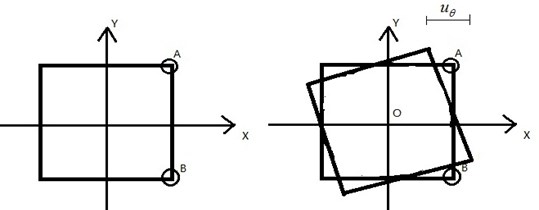
Fig. 10Relative torsional displacement of each layer under the small-scale earthquake excitation from X-direction
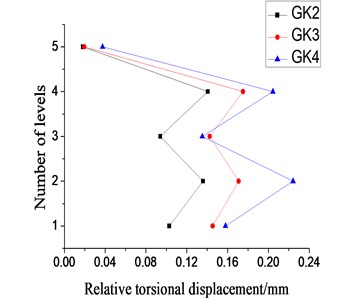
Fig. 11Relative torsional displacement of each layer under the small-scale earthquake excitation from Y-direction
As indicated by Figs. 10 and 11, under the identical directional excitation of different of seismic waves, the relative torsional displacements for each floor of the model structure had a similar tendency. For each specified input direction, it is easy to predict the torsional effect caused by different kinds of seismic waves and which floor has the most severe torsional effect. However, the relative torsional displacements of each floor of the model structure varied under different directional seismic excitations. The torsional effect, caused by -direction seismic excitation, of the second floor was strong whereas the torsional effect caused by -direction earthquake excitation was weak for the second floor. In other words, the input direction played a crucial role for the torsional effect of the model structure. As indicated in Fig. 10, Fig. 11 and Table 2, we knew that, no matter under which kind of seismic excitations, the relationship between the torsional effect of the model structure and the eccentricity was quite different from those of monolayer eccentric structures or complex multilayer eccentric structures. The eccentricity was not simply proportional to the torsional effect. For example, the -direction eccentricity and -direction eccentricity of the fourth floor were not the biggest ones, but strong torsional effect occurred under separate seismic excitation. That is, the relationship between eccentricity and the torsional effect of the complex eccentric structure was complicated. It is possible that the torsional effect of the complex eccentric structure relates to the distribution of eccentricity of overall system or other parameters. Therefore, it is inappropriate to analyze complex eccentric structures by using observations and conclusions made from monolayer eccentric structures or multilayer uniform eccentric structures.
Besides, the input pattern of the seismic wave also affected the torsional effect of the complex eccentric structure. Bi-direction seismic waves (GK9-GK11) were adopted to analyze the relative torsional displacement and compared to the data those of from GK2 to GK7 (Fig. 12).
Fig. 12Relative torsional displacement ratio under small-scale earthquake excitation
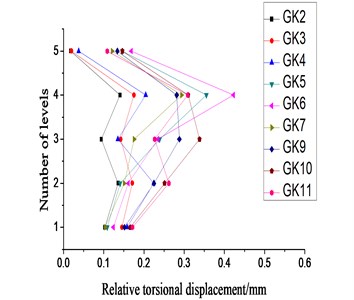
Fig. 13Relative torsional displacement under X-direction single-direction small-scale or moderate-scale earthquake excitation
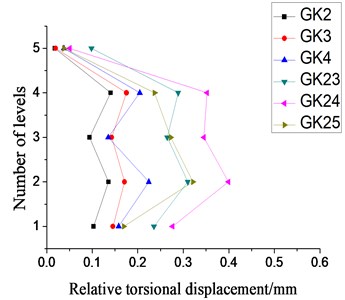
As indicated in Fig. 12, we found that the whole relative torsional displacement of the model structure under bi-direction seismic waves was not significantly larger than that of the case of uni-direction seismic wave. That is, bi-direction seismic waves could not significantly enhance the torsional effect of the model structure and even might repress the torsional effect.
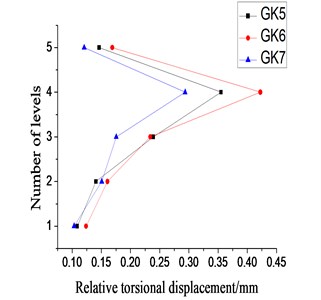
Next, we increased the intensity of seismic waves to moderate magnitude, verified the above conclusions and compared relative torsional displacement data with former data from GK2 to GK7 and from GK9 to GK11 (Figs. 13 and 14).
As indicated in Figs. 13 and 14, when the seismic wave increased in its magnitude, the torsional effect of the structure tended to increase. Generally the distribution pattern of relative torsional displacement for each floor was similar, which was consistent with those in the case of small-scale seismic waves. Only some floors exhibited a significant difference of relative torsional displacement under some specified loading conditions. It was because some structural components entered the plastic stage in such cases.
Fig. 14Relative torsional displacement under bi-direction small-scale or moderate-scale earthquake excitation
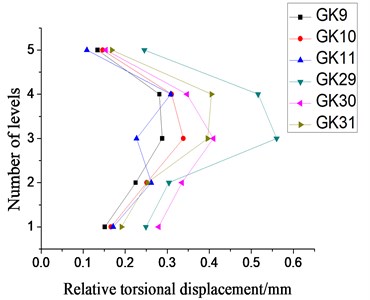
Fig. 15Relative torsional displacement under X-direction single-direction small-scale, moderate-scale and large-scale earthquake excitation
3.3. Torsional response in the plastic stage
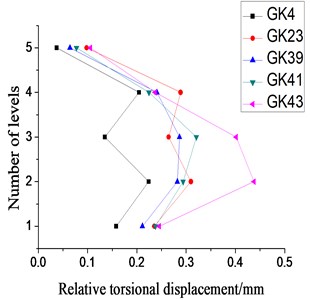
Based on the test results under moderate seismic waves, we knew that the structural components might get different torsional response characteristics from those of the elastic stage when they entered the plastic stage. Therefore, we analyzed the test data from the plastic stage. Since the plastic stage of the model structure are unrepeatable, only -direction large-scale artificial wave was selected as the earthquake excitation which made the structure model enter the plastic phage. The details of the relative torsional displacement under the -direction seismic wave was shown by Fig. 15.
As Fig. 15 indicated, during the increase process of seismic wave magnitude, the relative torsional displacement of the model structure tended to increase in the beginning, then to decrease and finally to increase again. When M7.5 small-scale seismic wave became M7.5 moderate-scale one, the relative torsional displacement of the model structure increased. In contrast, in the case of M7.5 large-scale seismic wave, the relative torsional displacement of the model structure decreased. As the seismic wave magnitude continued to increase, the equivalent torsional effect of the structure continued to increase. The torsional effect became most significant under M8.5 large-scale seismic waves. All these illustrated that the process of elastic stage developing to the elastic-plastic stage was mostly due to the torsional effect. Since the structural components were at different phase of the elastic-plastic stage, the structural eccentricity and other innate characteristics were time-dependent, as well as the torsional effect of the structure. Under M8.5 large-scale seismic waves, the model structure suffered severe damage, most structural components enter the plastic stage, and the elastic-plastic property of the structural components tended to be stable. Correspondingly, the torsional effect was enhanced.
At the same time, the change of each-floor torsional effect varied, and the increase of the lower-floor relative torsional displacement was more significantly than that of the top-two-floor relative torsional displacement. That is, under intensive seismic waves, the lower-floor relative torsional effect of the complex eccentric structure was more easier to be amplified than the top-floor relative torsional effect and more probably to suffer severe damage.
4. Numerical simulation analysis
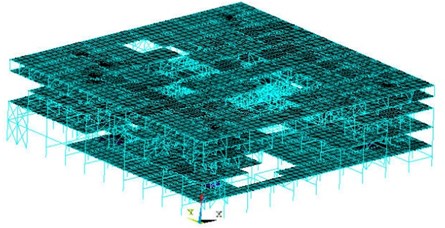
Using the ANSYS software package, numerical analysis was carried out on the test model. The model of the frame and truss part was composed of steel and the floor was composed of the concrete material. In this analysis, according to different used materials, bilinear kinematic hardening model was used to simulate steel material and multilinear kinematic hardening model was used to simulate concrete material. Damping ratio measured in the experiment was used. Beams of the model adopted beam188 element, and floors adopted shell63 element, as well as placing the mass element on the model. The model contained a total of 13663 nodes and 19227 elements. All of the intersection joints of beams and columns were rigid connections. The bottom of the first floor columns were fixed. Seismic acceleration time history was applied to the overall structure in the numerical simulation. It could simulate the seismic action that the structure subjected to (Fig. 16).
Fig. 16Schematic diagram of model structure ANSYS
We obtained the data of the first three frequencies and the mode of the model structure. And the data were shown in Table 4.
As Table 4 indicated, the first three frequencies and the mode of vibration, predicted by numerical simulation, were close to those obtained from tests. The biggest error was 4.6 %, which was in the acceptable range. At the same time, the vibration mode of the shaking table test was consistent with the numerical simulated vibration mode.
After confirming the consistence between the vibration mode of the shaking table test and the numerical simulated vibration mode, we analyzed the dynamic time history of the numerical model by using the above seismic waves in this study, and compared the data with the relative torsional displacement data of the shaking table test. Limited to the length of the study, we selected representative data of GK2 and GK39 and analyzed the comparison of the first-floor relative torsional displacement time-history curve.
Table 4Comparison of the frequency data of the model structure
First-order frequency | Second-order frequency | Third-order frequency | |
Modal | to translational | Reverse | to translational |
Simulate frequency value | 9.19 Hz | 9.52 Hz | 10.11 Hz |
Test frequency value | 9.48 Hz | 9.98 Hz | 10.36 Hz |
Error | 3.1 % | 4.6 % | 2.4 % |
Fig. 17Comparison of the first-layer relative torsional displacement in GK2 model
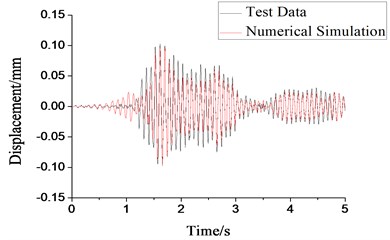
Fig. 18Comparison of the first-layer relative torsional displacement in GK39 model
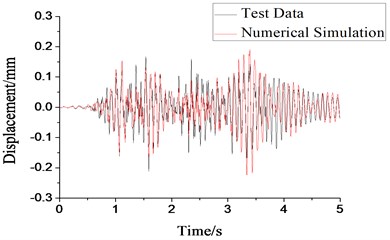
As indicated by Figs. 17 and 18, the time-history curve of the numerical simulated relative torsional displacement was consistent with the test data, which showed a similar development tendency. The maximum was approximately evaluated, except for some differences of some data. The following factors might explain the above difference.
1) Inevitable errors in the process of fabricate the model structure.
2) Errors in the process of inputting seismic waves.
3) The shaking table was not infinitely stiff as described by numerical simulation.
4) Errors generated by the simplified application process of establishing the numerical simulation model, such as beam-column joints connection, which was unavoidable in the practical shaking table test.
In summary, the test data were in good agreement with simulation data, the change tendency was generally similar, and the maximum data was approximately evaluated. Thus this test was reliable.
5. Conclusions
In this paper, we conducted a shaking table test and numerical simulation on a complex eccentric structural model. The shaking table test data was compared with the results of numerical simulation, verifying the reliability of the test. At the same time, the complex torsional effect of eccentric structural shaking table model was studied. Although some dynamic characteristics were consistent with or similar to those of single eccentric structures and uniform eccentric structures, complex eccentric structures have their unique dynamic characteristics which was different from those of single eccentric structures and uniform eccentric structures. Some specific conclusions were drawn as follows:
1) Compared representative test data with numerical simulative result, we found that test data and simulated result were consistent with each other and they had a similar tendency. The maximums were approximately evaluated, and there were only a few test errors, which indicated that the shaking table test in this study was reliable.
2) The torsional effect caused by the eccentricity of complex eccentric structures were obviously different from that of the eccentric monolayer or multilayer structures. In the uniform eccentric monolayer and multilayer structures, the torsion and the eccentricity of each floor of the structure were consistent, and the torsion increased as the eccentricity increased. While in complex eccentric structures, the eccentricity and the torsional effect of each layer were not simply proportional to each other, and might be affected by the eccentricity of the whole system.
3) In the elastic stage, the factors involved in affecting the torsional properties of complex eccentric structures were: component placement, seismic wave input direction and seismic wave characteristics. When the seismic wave input direction was specified, the degree of each inter-story torsion was mainly affected by component placement no matter what kind of seismic wave was. When the seismic wave input direction changed, the relationship would changed. Therefore, the magnitude of inter-story torsion had a close relationship with seismic wave input direction. Bi-directional seismic wave input did not always enhance the torsional effect and might probably repress torsional effect.
4) In the elastic-plastic stage, with the increase of seismic intensity, the torsional effect would be enhanced in the beginning, then be weakened and finally be enhanced again. Because some structural components became plastic, the eccentricity and other innate characteristics became time-dependent and the torsional effect fluctuated. When the magnitude of seismic wave excitations reached M8.5 grade, most structural components became plastic, innate characteristics tended towards stability and torsional effect continued to enhance.
5) The torsional effect of the bottom floors of the complex eccentric structure was greater than that of the upper floors in the main excitation stage. Thus, as for design in the future, more attention should be paid to the torsion failure of each floor at the bottom for a complex eccentric structure.
References
-
Liang Li-jun, Huang Zong-ming The comparison of codes about the method of anti-torsion design under the earthquake. Journal of Chongqing Jianzhu University, Vol. 24, Issue 2, 2002, p. 52-56.
-
Hejal R., Chopra A. Earthquake response of torsionally coupled frame buildings. Journal of Structural Engineering, Vol. 115, Issue 4, 1989, p. 834-851.
-
Arturo Tena-Colunga, Christian Zambrana-Rojas Dynamic torsional amplifications of base-isolated structures with an eccentric isolation system. Engineering Structures, Vol. 28, Issue 1, 2006, p. 72-83.
-
Miltiadis T. Kyrkos, Stavros A. Anagnostopoulos Improved earthquake resistant design of eccentric steel buildings. Soil Dynamics and Earthquake Engineering, Vol. 47, 2013, p. 144-156.
-
Kilara V., Petrovcic S., Korena D., Silih S. Seismic analysis of an asymmetric fixed base and base-isolated high-rack steel structure. Engineering Structures, Vol. 33, Issue 12, 2011, p. 3471-3482.
-
Arturo Tena-Colunga, Jose Luis Escamilla-Cruz Torsional amplifications in asymmetric base-isolated structures. Engineering Structures, Vol. 29, Issue 2, 2007, p. 237-247.
-
Wu Rui-feng, Cai Xian-hui, Qu Nai-si Study on inelastic torsional coupled seismic response of multistory and high rise buildings. Journal of of Technology, Vol. 39, Issue 4, 1999, p. 471-477.
-
Dai Jun-wu, Zhang Min-zheng Discussion on several basic parameters in study of seismic torsional effects of asymmetric structures. Earthquake Engineering and Engineering Vibration, Vol. 22, Issue 6, 2002, p. 38-43.
-
Wilkinson S., Thambiratnam D. Simplified procedure for seismic analysis of asymmetric buildings. Computer and Structures, Vol. 79, Issue 32, 2001, p. 2833-2845.
-
He Xiaoyu, Li Hongnan Torsionally coupled dynamic performance analysis of asymmetric offshore platforms subjected to wave and earthquake loadings. Earthquake Engineering and Engineering Vibration, Vol. 9, Issue 2, 2010, p. 247-258.
-
Prestley M. J. N., Kowalsky M. J. Aspects of drift and ductility capacity of rectangular cantilever structure walls. Bulletin of the New Zealand National Society for Earthquake Engineering, Vol. 31, Issue 2, 1998, p. 73-85.
-
Adrian M. Chandler, Joseph C. Correnza, Graham L. Hutchinson Period-dependent effects inseismic torsional response of code systems. Journal of Structural Engineering, Vol. 120, Issue 12, 1994, p. 3418-3434.
-
Goel R. K., Chopra A. K. Inelastic seismic response of one-story, asymmetric-plan systems: effects of stiffness and strength distribution. Earthquake Engineering and Structural Dynamics, Vol. 19, Issue 2, 1990, p. 949-970.
-
Correnza J. C., Hutchinson G. L., Chandler A. M. A review of reference models for assessing inelastic seismic torsional effects in buildings. Soil Dynamics and Earthquake Engineering, Vol. 11, Issue 8, 1992, p. 465-484.
-
Humar J. L., Kumar P. Effect of orthogonal inplane structural elements on inelastic torsional response. Earthquake Engineering and Structural Dynamics, Vol. 28, Issue 4, 1999, p. 1071-1097.
-
Kilar V., Fajfar P. Simple push-over analysis of asymmetric buildings. Earthquake Engineering and Structural Dynamics, Vol. 26, 1997, p. 233-249.
-
Cai Xian-hui, Wu Rui-feng Research on the inelastic seismic responses of shear type multistorey buildings with regular asymmetry. Applied Mathematics and Mechanics, Vol. 22, Issue 11, 2001, p. 1129-1134.
-
Rafezy B., Zare A., Howson W. P. Coupled lateral–torsional frequencies of asymmetric, three-dimensional frame structures. International Journal of Solids and Structures, Vol. 44, Issue 1, 2007, p. 128-144.
-
Sekhar Chandra Dutta, Koushik Bhattacharya, Rana Roy Response of low-rise buildings under seismic ground excitation incorporating soil-structure interaction. Soil Dynamics and Earthquake Engineering, Vol. 24, 2004, p. 893-914.
-
Li Yue, Jiang Xin-liang Analysis of similitude design of model soil used for shaking table test of soil-structure interaction system. Engineering Mechanics, Vol. 27, Issue 1, 2010, p. 73-76.
-
Shi Qi-yin, Li Ai-qun Tests on shaking table of new tall tower structure model for Beijing airport. Industrial Construction, Vol. 34, Issue 9, 2004, p. 40-45.
-
Zhou Ying, Lv Xi-lin, Lu Wen-sheng Shaking table test model design in different structures. Structural Engineers, Vol. 22, Issue 4, 2006, p. 37-40.
-
Wang Chang-xing MIDAS/Gen Application Instance Tutorial and Troubleshooting. China Architecture and Building Press, Beijing, 2010, p. 29-31.
-
Xu Fu-jiang, Zhen Wei, Zhao Ming, Liu Jia-ling Elasto-plastic time-history analysis on non-platform-column canopy of New Guangzhou railway station. Building Structure, Vol. 39, Issue 12, 2009, p. 36-38, (in Chinese).
-
Code for Seismic Design of Buildings. China Architecture and Building Press, Beijing, 2010, p. 32.
About this article

