Abstract
The hazard of a shock wave is an important consideration in blasting engineering design. The scope of effect and extent of damage caused by a shock wave depends on its energy. In addition to the blasting pressure and the horizontal distance to the blast center, the Mach effect caused by the ground surface reflection is also an important factor in the analysis of the transmission pattern of a shock wave. Therefore, the purposes of this study were to investigate the characteristics of the shock wave effect induced by a surface contact blast, and to analyze the energy attenuation pattern, as well as the impact distances where the Mach reflection effect might occur. To accomplish the purposes, this study conducted 0.5 lb TNT explosive field blasting experiments and numerical simulation analyses. Experimental results and data from the numerical simulation were compared with each other to analyze the shock wave transmission and Mach wave effect. The numerical analysis used an Arbitrary Lagrangian-Eulerian (ALE) algorithm and fluid-solid interaction method, with eight-node solid elements and three-dimensional solid structural model to conduct the analysis. Results of this study will enable more accurate and practical assessments of blasting effects, and provide references for future construction planning, facility shock-absorption and disaster prevention design, in order to reduce potential shock wave hazards and ensure facility safety protection, as well as a secure building safe zone.
1. Introduction
Blasting techniques have been widely utilized in hydraulics, transportation, mining, construction, and natural disaster relief. However, when explosive explodes inside a limited space within a very short amount of time, it releases a huge amount of energy and produces high temperature and high pressure gases that compress surrounding air and cause it to expand outward rapidly, forming a shock wave which can cause deformation and damage to the objects it encounters. This can cause damaging effects to the surrounding environment and pose threat to the safety of personnel and facility [1, 2]. Therefore, shock wave energy is a phenomenon that should be carefully investigated in blasting research, and an important issue that should demand the attention of construction in the department.
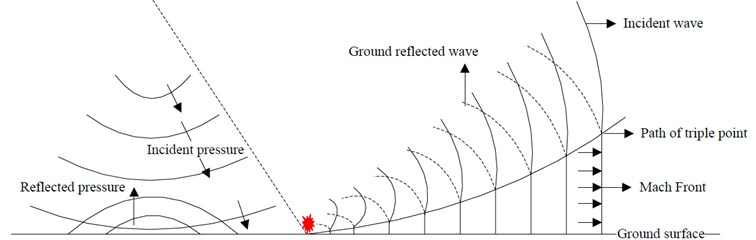
When a shock wave travels, it generates a reflection phenomenon when it comes into contact with obstacles in its path. There are two types of reflection phenomena: the regular reflection and the Mach reflection [1, 3], as shown in Fig. 1. Analyses of the hazardous effect generated by the shock wave are done primarily by experiments and numerical methods to study the physical phenomenon of the explosion, and to develop techniques capable of predicting the shock wave impact zone. However, because of the high cost, limited facilities, and inherent danger associated with blasting experiment, and limitations imposed on related field experiments, much research still needs to be done concerning the reflection phenomenon of shock waves. Therefore, this study investigated the surface contact blast, as well as the scope and extent of the effect of shock wave energy, in order to provide references for future disaster relief and prevention.
When explosive explodes, it generates a shock wave in the air. The characteristics of the blast are often described by peak positive incident pressure, positive incident impulse, duration of positive phase, wave length of positive phase, etc. [1]. Research concerning blast effects is conducted primarily by field experiments and numerical simulation analyses. By comparing the experimental results to the simulation data, they proved that LS-DYNA finite element program can effectively simulate the transmission behavior of blast waves aboveground generated by surface blasts [4, 5]. For near-surface and surface blasts, analyses of their extent of hazard are mainly based on the transmission characteristics of shock wave and surface vibration intensity. Goodman [6] concluded from his experiment that blast pressures measured near the blast center contain greater variations. Better analysis results can be obtained when the ratio of the distance from the blast center to the measurement point and the radius of the explosive is greater than 8. The wave form of the blast wave was affected by the reflection and refraction from the ground surface and showed great variations near the blast center; the wave form farther away from the blast center was comparatively smoother and the blast pressure extremes were less affected [7]. Kivity et al. used 3D software to simulate a small scale ammunition depot explosion experiment [8]. The results showed that, free-field peak blast pressure is about 1/3 that of a surface blast. Also, when simulation data were compared with experimental results, the blast pressure extreme showed a 15 % relative error. Other researchers also demonstrated that the blast wave near the blast center is complex in nature [9-11].
Fig. 1Schematic diagram of irregular reflection of shock wave
Demand for blast research currently comes mainly from construction, mining and the military. Most researches focus on methods to control blasts and investigate the transmission characteristics of a shock wave and its attenuation pattern. Because of the complex behavior of the Mach effect, there is currently no theory that can accurately calculate the characteristics of its flow field; therefore the best protective design and safety distance reference cannot be provided. This study, from a safety perspective, investigated the surface reflection effect and safety protection distance. Field experiments and numerical analyses were conducted to investigate, in order to provide a reference for the planning of safe blasting operations.
2. Research methods
This study investigated the Mach reflection effect of a shock wave induced by a ground surface blast, utilizing field experiment and numerical analysis method. The reliability of the analysis was ensured by comparing experimental results with data from numerical simulation. Details of the blast experiment planning and numerical simulation analysis method are described below, respectively.
2.1. Blast experiment planning
The purpose of the blast experiment was to obtain free-field air shock pressure and ground reaction data, in order to verify the accuracy of the numerical analysis. This study conducted a surface contact blast experiment and analyzed the surface shock wave, in order to facilitate cross-verification of the data from numerical analysis.
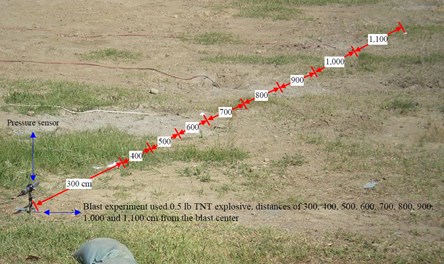
The surface contact blast experiment used 0.5 lb (226.796 g) TNT explosive, and measured the near-surface shock pressures at distances of 300, 400, 500, 600, 700, 800, 900, 1,000 and 1,100 cm from the blast center. The layout of the field is shown in Fig. 2. Equipment used in the experiment included a pressure gauge, oscilloscope, signal conditioner, power supply and data acquisition system. The blast pressure gauge is a 40.6 cm long pen-shaped metal rod with a sensor located 1/3 of the way down. The signal is generated by voltage and transmitted through the signal conditioner and oscilloscope.
Fig. 2Field layout of surface contact blast experiment
2.2. Numerical analysis method
The numerical simulation used LS-DYNA finite element analysis software to simulate the shock wave effect of an explosion. It uses continuum dynamics theory as the basis for its fluid dynamics program, and utilizes explicit time integration to process dynamic time integration problems. It is capable of describing the hydrodynamic behavior of gases generated by an explosion and effectively analyzing the non-linear large deformation behavior of three-dimensional (3D) structure; it is especially suitable for solving non-linear dynamic problems such as high-speed collision and explosion.
2.2.1. Arbitrary Lagrangian-Eulerian algorithm
The Arbitrary Lagrangian-Eulerian (ALE) algorithm solved the equations of mass conservation Eq. (1), energy conservation Eq. (2), and momentum conservation Eq. (3). When mesh velocity equals zero, it becomes the Eulerian description method; when mesh velocity equals material speed, it becomes the Lagrangian description method; when mesh velocity is arbitrary, it becomes the ALE algorithm [12, 13]:
where is the area of spatial movement, is the boundary, is the velocity of .
The ALE algorithm method has the advantages of both the Lagrangian and Eulerian algorithm methods. The Lagrangian algorithm method can effectively track the movement of the boundary in the analysis of structure boundary movement; in dividing the internal mesh, the Eulerian algorithm method allows the internal element mesh to be independent of the material being analyzed, to enable the numerical analysis of severely twisted and deformed mesh. For a dynamic analysis of coupled fluid and solid materials, the Eulerian algorithm method can be applied to the fluid material to fix the nodes of the element mesh in space and allow only material particles to flow in space; the Lagrangian algorithm method can be applied to the solid material to allow material particles to move with the deformation of the continuum. The ALE algorithm takes into consideration characteristics of both the fluid and solid materials, which facilitates the analysis of deformation problems [14-16]. This study used an ALE algorithm with eight-node solid elements. The element is a 3D solid structural model. Its shape function is shown in Eq. (4) [17]. It was used to simulate the three types of material: soil, air and TNT explosive:
where , , and can be ±1 depending on the node position value.
2.2.2. Time step and time integration
Blast analysis is a transient dynamic problem. A small time step is required in the analysis. LS-DYNA uses explicit time integration, which is a conditional stable calculation method. When LS-DYNA analyzes blast, penetration and impact problems, its transient time dynamic non-linear dynamic equation uses the central difference method to perform explicit time integration. However, when using explicit time integration, the time step () has to be smaller than the critical time interval. Any element types in the equation can be made stable by a scale factor of 0.1-0.9. To avoid large errors in the calculation, conditional stability and computation time of explicit time integration depend on time step. There are different calculation methods for different types of elements as well. For the same type of element, the time step is determined by the smallest mesh.
For solid elements, the stability conditions for are shown in Eqs. (5) and (6). Characteristic length () of the eight-node solid element used in this study is shown in Eq. (7). Wave propagation speed for common elastic material is shown in Eq. (8); and in Eq. (9) for fixed bulk modulus elastic material. The minimum time step is calculated by Eq. (10) to maintain the program’s stable analysis. As shown, the precision of the element mesh determines the accuracy and stability of the calculation, as well as the computation time. The LS-DYNA user manual suggests that the time step scale factor should be smaller than 0.67 when analyzing blast phenomena, in order to increase the calculation stability of the program [18]:
where is the function of volume viscosity coefficients and ; is the characteristic length; is the strain rate tensor; is the element volume; is the area at the longest side; is the sonic velocity in materials; is the mass density; is Young’s modulus; is shear modulus; is Poisson’s ratio; and is the number of elements.
3. Numerical model and calculation
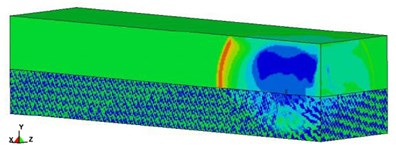
Numerical analysis was conducted to calculate the shock wave of the surface contact blast using TNT explosive. A coupled fluid-solid ALE algorithm was used in the analysis. TNT explosive and air were set up as Eulerian mesh; soil was set up as Lagrangian mesh. A coupled fluid-solid numerical analysis model was built to analyze the shock wave and surface Mach reflection effect caused by a blast.
3.1. Finite element model
Fig. 3 show the simplified 1/2 model used in the numerical analysis. Sizes of the finite element mesh of air, TNT explosive and soil were 3.28 cm, 3.28 cm, and 6.56 cm, respectively. The time step scale factor was set at 0.3 [19].
Fig. 3Schematic view of simplified 1/2 surface blast model
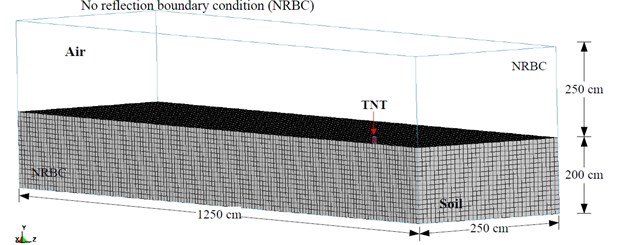
The mathematical and physical models for the numerical analysis were constructed according to the conditions of the surface blasting experiment. The simulation was conducted using 3D solid elements, and the unit system used was cm-g-μs. The surrounding air dimensions were 1250×250×250 cm, with boundary defined as non-reflective boundary; the rectangular TNT explosive had dimensions of 6.56×3.28×9.3 cm, with a density of 1.63 g/cm3 and weight of 0.5 lb (226.8 g), placed at the center of the model in contact with ground surface; soil dimensions were 1250×250×200 cm. Because the model was symmetric, only 1/2 of the model was used to conduct the numerical simulation.
3.2. Material constitutive and equation of state
The model for describing the constitutive law of the material's internal phenomenon was defined by the relationship between stress tensor and strain tensor. Equation of state (EOS) described the relationships among material constitutive law pressure, volume or density, and temperature or specific internal energy. The high-speed, high-temperature and high-pressure conditions of an explosion required corresponding EOS analysis to simulate the real dynamic responses, in order to analyze the material’s volume change and behavioral pattern when subjected to external forces.
Table 1 shows the material parameters of TNT explosive and air, material models and corresponding EOS. The MAT_HIGH_EXPLOSIVE_BURN material model provided in LS-DYNA was used to simulate high explosive. In order to effectively simulate the high-speed, high-temperature, high-pressure and fast-energy-release condition of an explosion, corresponding Jones-Wilkins-Lee (JWL) EOS was used to describe the behaviors of the material. The EOS is shown in Eq. (11) [18]. The MAT_NULL corresponding EOS_LINEAR_POLYNOMIAL was used to describe air material behaviors. The EOS is shown in Eq. (12) [17]:
with , where , , , and are constants representing characteristics of the explosive, is the relative volume, the initial energy of a unit volume, and the material internal energy, is the coefficient of dynamic viscosity, , , , , , and are constants and is the relative volume.
Table 1Explosive and air model parameters for the analysis
Element | Material and equation of state parameters (unit system: g, cm, μ-second) | ||||||
TNT | MAT_HIGH_EXPLOSIVE_BURN | ||||||
PCJ | BETA | SIGY | |||||
1.63 | 0.693 | 0.21 | 0.0 | 0.0 | 0.0 | 0.0 | |
EOS_JWL | |||||||
OMEGA | |||||||
3.712 | 0.03231 | 4.15 | 0.95 | 0.3 | 0.07 | 1.0 | |
Air | MAT_NULL | ||||||
TEROD | CEROD | ||||||
0.00129 | 0.0 | 0.0 | 0.0 | 0.0 | 0.0 | 0.0 | |
EOS_LINEAR_POLYNOMIAL | |||||||
, , , | , | ||||||
–1.07E-06 | 0.0 | 0.4 | 2.53-06 | 1.0 | |||
In the Table 1: is the mass density, is the detonation velocity, PCJ is the Chapman-Jouget pressure, BETA is the beta burn flag, is the bulk modulus, is the shear modulus, SIGY is the yield stress, is the pressure cutoff, is the dynamic viscosity coefficient, TEROD is the relative volume for erosion in tension, CEROD is the relative volume for erosion in compression, is the Young’s modulus, is the Poisson’s ratio, is the initial internal energy per unit reference specific volume, is the initial relative volume.
Table 2 shows the material parameters of soil used in this study. The selection of the soil composition model should consider the porosity and the crushing or compacting behaviors of the material; because the material is compressible and plastic. Based on the material properties, this study chose the MAT_SOIL_AND_FOAM material model [18] to simulate the stress and strain behaviors of soil. Before the field blasting experiment, soil samples were taken from the experiment site to have their physical and mechanical properties analyzed. Soil samples were also categorized according to the Unified Soil Classification System (USCS). The experimental results show that the engineering classification of the soil at the blasting experiment site was sand clay (SC), with a density of 1.78 (g/cm3).
Table 2Soil model parameters for the analysis
Element | Material parameters (unit system: g, cm, μ-second) | ||||||||
Soil | MAT_SOIL_AND_FOAM | ||||||||
BULK | VCR | REF | |||||||
1.8 | 0.000639 | 0.3 | 3.40E-13 | 7.03E-07 | 0.3 | –6.9E-08 | 0.0 | 0.0 | |
In the Table 2: is the mass density, is the shear modulus, BULK is the bulk modulus, , , is the yield function constant for plastic yield function below, is the pressure cutoff, VCR is the volumetric crushing option, REF is the use reference geometry to initialize the pressure.
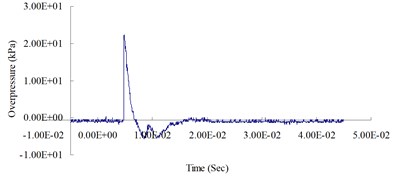
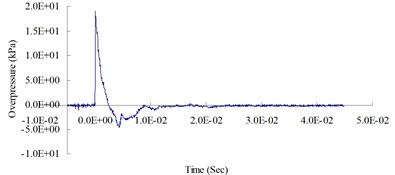
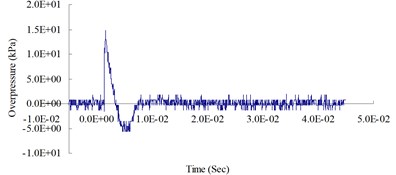
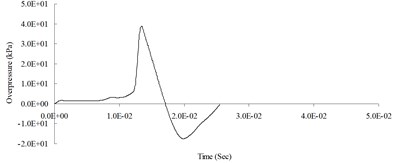
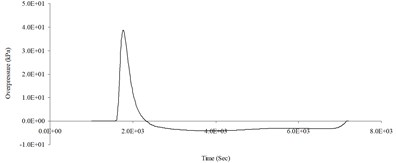
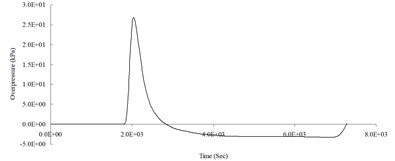
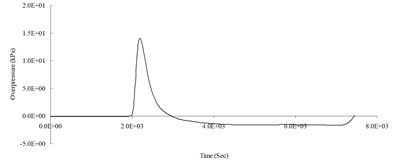
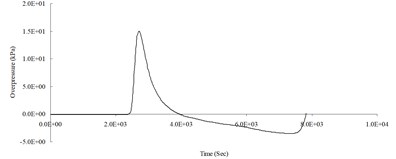
Fig. 4Blast pressure duration curves of surface contact blast from the blast experiment
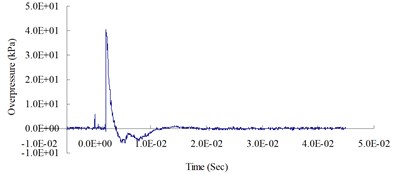
a) 300 cm from the blast center (Peak pressure 40.29 kPa)
b) 400 cm from the blast center (Peak pressure 23.32 kPa)
c) 500 cm from the blast center (Peak pressure 18.83 kPa)
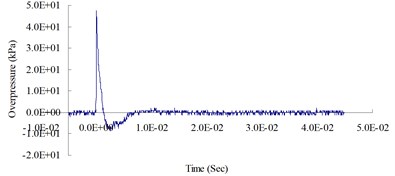
d) 600 cm from the blast center (Peak pressure 47.08 kPa)
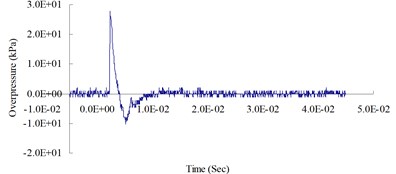
e) 700 cm from the blast center (Peak pressure 27.94 kPa)
f) 800 cm from the blast center (Peak pressure 14.72 kPa)
g) 900 cm from the blast center (Peak pressure 14.09 kPa)
h) 1,000 cm from the blast center (Peak pressure 15.21 kPa)
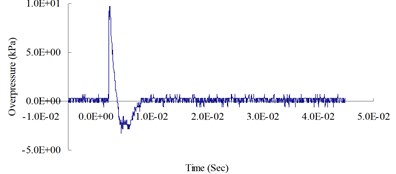
i) 1,100 cm from the blast center (Peak pressure 9.72 kPa)
j) Field of blast experiment
4. Discussion of experimental and numerical validation
4.1. Blast experiment results
Fig. 4 show the blast pressure duration curves of surface contact blasts at a height of 20 cm above the ground surface. Experimental results indicate, with the same amount of TNT explosive, within a 500 cm range from the blast center, that the peak blast pressure values show a decreasing trend as the distance increased. However, at 600 cm from the blast center, the peak blast pressure was 47.08 kPa; greater than the peak blast pressure of 18.83 kPa inside the 500 cm range from the blast center. The peak blast pressure jumped up at 600 cm and showed an increasing trend. At 700 cm from the blast center, the peak blast pressure extreme started to decrease again. As the distance from the blast center increased to 1,000 cm, where the peak blast pressure extreme was 15.21 kPa, the phenomenon of peak blast pressure jump happened the second time. The results indicate that the peak blast pressure at 600 cm and 1,000 cm from the blast center were affected by the blast pressure superposition effect due to surface reflection pressure. The main reason is that when TNT explodes, a shock wave travels outward in a spherical shape; after a certain amount of time, the radius of the spherical surface of the wave increases and touches the ground surface. The transmission direction of the incident wave forms an angle with the ground surface; as the distance from the blast center increases, the incident angle increases too, but the angle between incident wave and reflection wave decreases; when incident wave and reflective wave superimpose onto each other, they form a single compound wave called the Mach wave.
The results indicate that the peak blast pressure within 500 cm distance from the blast center decreased as the distance grew, because the speed of the surface reflection wave is slower than the speed of the incident wave; thus, the shock wave was not affected by the reflection wave. When the distance from the blast center increased to 600 cm and 1,000 cm, the blast pressures generated by the explosion were affected by the surface reflection wave, and the shock wave would interfere with the reflection wave coming from the ground surface and form the Mach wave. The incident pressure and the reflection pressure overlap and travel outward, thus causing the jump of the peak blast pressure called Mach reflection phenomenon.
4.2. Comparing numerical data with the experimental results
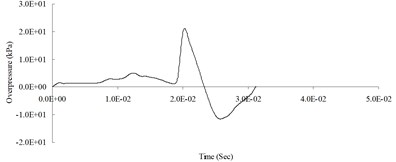
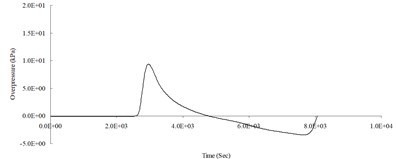
Fig. 5 shows the blast pressure duration curves of surface contact blasts at a height of 20 cm above the ground surface from the simulation analysis. The figure shows that the peak blast pressures decreased as the transmission distance grew; however, the wave form exhibited distinctly different behaviors at certain ranges compared to the previous portion due to the effect of surface reflection pressure. The blast pressure superposition effect occurred at 600 cm and 1,000 cm from the blast center and caused the peak blast pressure to jump.
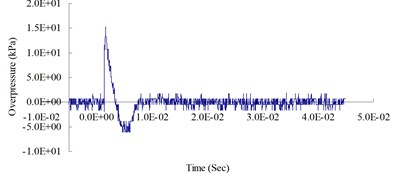
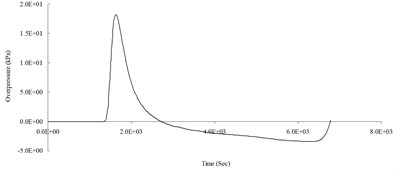
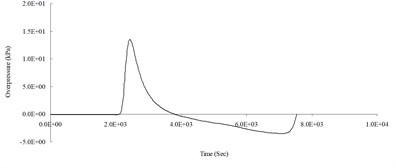
First, to verify the reliability of the analytical and mathematical models in this study, peak blast pressures at 300 cm from the blast center. Fig. 6 shows the blast pressure duration curves from both the experiment and the simulation, at a measuring point 300 cm from the blast center and 20 cm from the ground surface. The figure shows that the peak blast pressure of the experiment was 40.29 kPa and the simulation was 38.99 kPa. Relative error percentage (%) = (Simulation analysis data – Experiment data) / Experiment data × 100 %. The relative error of the peak blast pressure value between the simulation and the experiment was –3.27 %. The relative error between the experimental results and simulation data fell within a reasonable range, and complied with related literature [7]; thus, the accuracy and applicability of the numerical analysis model and physical model in this study were verified.
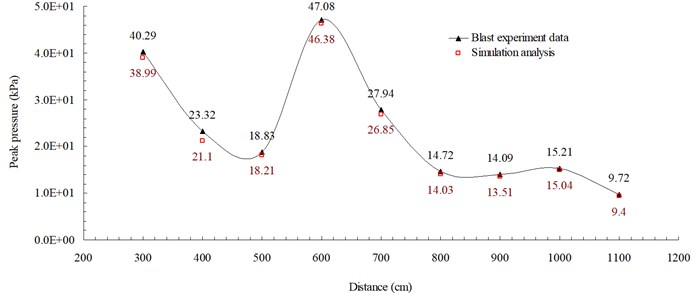
Fig. 7 shows the peak blast pressure values from the experiment and the simulation analysis. The figure indicates that the peak blast pressure show a decreasing trend, but because of the effect of the continuous accumulation of energy from surface reflection wave, a shock wave jump phenomenon called the Mach phenomenon occurred at certain distances. According to the analysis of the blast pressure values from the experimental result and simulation data, because of the fast loading effect of the blast wave, the shock wave closer to the blast center rises fast, has short action time and high peak value; on the other hand, the shock wave farther away from the blast center rises slower, has longer action time and lower peak value. The overall trend is consistent with the blast wave energy attenuation trend; however, because of the surface reflection pressure, blast pressures closer to the ground surface produced the Mach reflection phenomenon due to the superposition of incident pressure and reflection pressure. This indicates that the ALE analysis method used in this study can effectively analyze the phenomenon of a blast and the pressure variations at various locations.
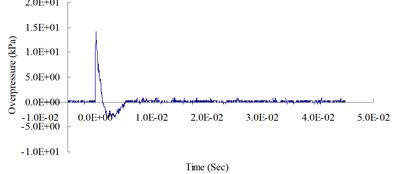
Fig. 5Blast pressure duration curve of surface contact blast from the simulation analysis
a) 300 cm from the blast center (Peak pressure 38.99 kPa)
b) 400 cm from the blast center (Peak pressure 21.10 kPa)
c) 500 cm from the blast center (Peak pressure 18.21 kPa)
d) 600 cm from the blast center (Peak pressure 46.38 kPa)
e) 700 cm from the blast center (Peak pressure 26.85 kPa)
f) 800 cm from the blast center (Peak pressure 14.03 kPa)
g) 900 cm from the blast center
h) 1,000 cm from the blast center (Peak pressure 15.04 kPa)
i) 1,100 cm from the blast center (Peak pressure 9.40 kPa)
j) Blast pressure simulation analysis
Fig. 6Blast pressure duration curves of 300 cm from the blast center
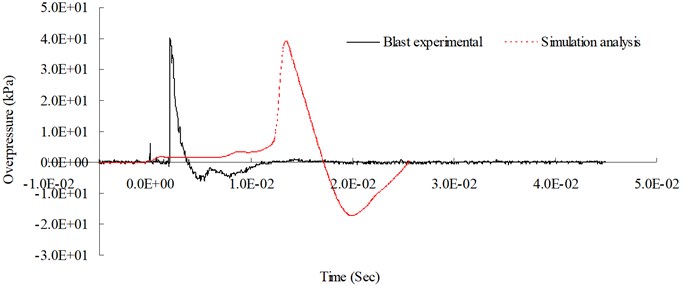
Fig. 7Peak blast pressure values from the experiment data and simulation analysis
5. Conclusions
The behaviors of a blast induced Mach reflection phenomenon are extremely complex. To analyze the surface shock wave effects and investigate the Mach reflection phenomenon, this study conducted both field experiment and numerical analysis. The field experiment conducted surface contact blast using TNT explosive to investigate the reflection phenomenon of an incident wave at various distances, and to assess the locations where the Mach reflection effect would occur. Experimental results showed the occurrence of the superposition effect of incident and reflection blast pressures, called the Mach phenomenon, due to the interference of surface reflection pressure, at 600 cm and 1,000 cm from blast center, using 0.5 lb of TNT explosive, at a site containing sand clay. The simulation analysis used a fluid-solid coupled ALE algorithm analysis model to analyze the Mach reflection flow-field phenomenon, with its finite element model adjusted and its data verified using the experimental results. The results showed that this method can sufficiently describe the fluid dynamic behaviors of a blast and adequately analyze the coupling effect with solid to solve geometric non-linear, material non-linear and contact non-linear types of dynamic analysis problems. This indicated the danger zones subjected to Mach reflection phenomenon, and provided assessments of blast safe quantity-distance and protective wall placement distance, to be used as references in facilitating the adoption of shock absorption measures in safety protection design and construction.
References
-
Structures to resist the effects of accidental explosions, technical manual TM5-1300, US Army Engineers Waterways Experimental Station, Washington, DC, 1990.
-
Wang E., Shukla A. Analytical and experimental evaluation of energies during shock wave loading. International Journal of Impact Engineering, Vol. 37, 2010, p. 1188-1196.
-
Jialing L. Numerical simulation of shock (blast) wave interaction with bodies. Communications in Nonlinear Science and Numerical Simulation, Vol. 4, Issue 1, 1999, p. 1-7.
-
Bergeron D., Walker R., Coffey C. Detonation of 100-Gram anti-personnel mine surrogate charges in sand – A test case for computer code validation. Defence Research Establishment Suffield, Canada, 1998.
-
Wang J. Simulation of Landmine Explosion Using LS-DYNA 3D Software: Benchmark Work of Simulation in Soil and Air. Aeronautical and Maritime Research Laboratory DSTO-TR-1168, 2001.
-
Goodman H. J. Compiled free-air blast data on bare spherical pentolite. BRL Report, No. 1092. USA, 1960.
-
Klomfass A. Numerical investigation of fluid dynamic instabilities and pressure fluctuations in the near field of a detonation. Proceeding of the 20th International Symposium on Military Aspects of Blast and Shock Conference, Norway, 2008, p. 1-13.
-
Kivity Y., Shafri D., Ben-Dor G., Sadot O., Anteby I. The blast wave resulting from an accidental explosion in an ammunition magazine. International Symposium on Military Aspects of Blast and Shock Conference, Canada, 2006.
-
Wang I. T., Lee C. Y. Influence of concave groove on transmission of blasting vibration wave. Journal of Vibroengineering, Vol. 14, Issue 3, 2012, p. 1031-1040.
-
Chapman T. C., Rose T. A. P.D. Smith, Blast wave simulation using AUTODYN2D: A parametric study. International Journal of Impact Engineering, Vol. 16, 1995, p. 777-787.
-
Wu C. Q., Hao H. Modeling of simultaneous ground shock and airblast pressure on nearby structures from surface explosions. International Journal of Impact Engineering, Vol. 31, 2005, p. 699-717.
-
Donea J. Arbitrary Lagrangian-Eulerian finite element methods. Computational Methods for Transient Analysis, Elsevier, Amsterdam, 1983, p. 473-516.
-
Benson D. J. Computational methods in Lagrangian and Eulerian hydrocodes. Computer Methods in Applied Mechanics and Engineering, Vol. 99, 1992, p. 235-394.
-
Braess H., Wriggers P. Arbitrary Lagrangian Eulerian finite element analysis of free surface flow. Computer Methods in Applied Mechanics and Engineering, Vol. 190, 2000, p. 95-109.
-
Attaway S. W., Bell R. L., Vaughan C. T., Goudy S. P., Morrill K. B. Experiences with coupled codes for modeling explosive blast interacting with a concrete building. Proceedings of the Workshop on Coupled Eulerian and Lagrangian Methodologies, 2001.
-
Chafi M. S., Karami G., Ziejewski M. Numerical analysis of blast-induced wave propagation using FSI and ALE multi-material formulations. International Journal of Impact Engineering, Vol. 36, 2009, p. 1269-1275.
-
LS-DYNA Theory Manual. Livermore Software Technology Corporation, 2006.
-
LS-DYNA keyword user’s manual. Livermore Software Technology Corporation, 2009.
-
Wang I. T. Numerical and experimental verification of finite element mesh convergence under explosion loading. Journal of Vibroengineering, Vol. 16, Issue 4, 2014, p. 1786-1798.
-
Dobratz B. M. LLNL Explosive Handbook Properties of Chemical Explosives and Explosive Simulants. Lawrence Livemore National Laboratory, 1981.
About this article

This study was partially supported by the National Science Council in Taiwan through Grant NSC 102-2218-E-145-001.
