Abstract
Detecting periodic impulse signal (PIS) is the core of bearing fault diagnosis. Earlier fault detected, earlier maintenance actions can be implemented. On the other hand, remaining useful life (RUL) prediction provides important information when the maintenance should be conducted. However, good degradation features are the prerequisite for effective RUL prediction. Therefore, this paper mainly concerns earlier fault detection and degradation feature extraction for bearing. Maximum correlated kurtosis deconvolution (MCKD) can enhance PIS produced by bearing fault. Whereas, it only achieve good effect when bearing has severe fault. On the contrary, PIS produced by bearing weak fault is always masked by heavy noise and cannot be enhanced by MCKD. In order to resolve this problem, a revised empirical mode decomposition (EMD) algorithm is used to denoise bearing fault signal before MCKD processing. In revised EMD algorithm, a new recovering algorithm is used to resolve mode mixing problem existed in traditional EMD and it is superior to ensemble EMD. For degradation analysis, correlated kurtosis (CK) value is used as degradation indicator to reflect health condition of bearing. Except of theory analysis, simulated bearing fault data, injected bearing fault data, real bearing fault data and bearing degradation data are used to verify the proposed method. Simulated bearing fault data is used to explain the existed problems. Then, injected bearing fault data and real bearing fault data are used to demonstrate the effectiveness of proposed method for fault diagnosis. Finally, bearing degradation data is used to verify the degradation feature CK extracted based on proposed method. All these case studies show the effectiveness of proposed fault diagnosis and degradation tracking method.
1. Introduction
Nowadays, bearings play an important role in rotating machineries. Their health conditions are very important for maintaining normal production work. Unexpected failures will lead to great loss of equipment owner. Especially for some expensive equipments such as helicopters, wind turbines and nuclear powers etc, bearing failure may induce catastrophic disasters. So, condition based maintenance (CBM) and prognostics and health management (PHM) researches of bearing attract many scholars.
When a bearing comes into its degradation process, it always generates periodic vibration according to its fault frequency. In vibration signals acquired by piezoelectricity acceleration sensor, bearing faults manifest themselves as periodic impulse signal (PIS) at different fault frequency. However, except of PIS of bearing, there are many signals produced by other components such as shafts, gears, and motors etc. Therefore, the task of bearing fault diagnosis is to detect PIS in vibration signal. If we can detect bearing fault in its early stage, there will be enough time for maintainers to replace it. However, only based on fault information, we do not know how much time it will continue to operate until its failure. So, maintainers do not know when to replace it and cannot plan the maintenance actions optimally. For resolving this problem, remaining useful life (RUL) prediction is needed. Except of RUL prediction models, degradation features with good trend are another important thing for RUL prediction. In order to address these two problems, an integrated fault diagnosis and degradation tracking method based on revised empirical mode decomposition (EMD) and maximum correlated kurtosis deconvolution (MCKD) is proposed in this paper.
Generally, PIS is very weak when bearing is at its early degradation state. When PIS is transferred to sensor, it is weaken by the transfer path. In order to recover original PIS, Endo and Randall [1] proposed using autoregressive (AR) model combined with minimum entropy deconvolution (MED) to enhance gear tooth fault detection. In the paper, AR model was used to subtract regular gear mesh signal. Then, MED was used to enhance PIS produced by gear fault. Afterwards, Sawalhi et al. [2] combined MED with spectral kurtosis to enhance bearing fault detection. Similarly, MED was used to remove the smearing effect of signal transfer path. And, spectral kurtosis method was used to determine the optimal frequency band for envelope analysis. In addition, Barszcz and Sawalhi [3] used MED method to diagnose a bearing inner race fault of wind turbine. In the paper, the parameters selection problem of MED has been discussed. However, MED also has its drawbacks. When vibration signals has some noises similar to impulse, MED will enhance these noise but the real PSI produced by fault. In order to resolve this problem, McDonald et al. [4] proposed a new method – maximum correlated kurtosis deconvolution (MCKD) which use correlated kurtosis as a deconvolution norm. This method can detect PSI produced by faults and will not be influenced by noises similar to impulse. They used this new deconvolution method diagnose gear tooth chip fault.
Although MED and MCKD can achieve good effect in many fault data, but they have a common problem. When bearing or gear has severe fault, these two methods can enhance the PIS produced by faults effectively. However, when bearing or gear only have weak fault, they usually cannot enhance PIS, because PIS are buried in intense noises. So, in order to resolve this problem, we need to denoise vibration signal before implementing deconvolution methods. Wavelet transform is a generally used denoising technique and has been widely used in condition monitoring [5-10]. However, PIS also will be suppressed when vibration signal is denoised by wavelet methods. This enables deconvolution methods less effective. Another method, empirical mode decomposition (EMD), because of its adaptive decomposition ability for non-linear and non-stationary signals, it is very suitable to subtract noise from vibration signal. It can wipe off some useless frequency contents from the vibration signal through deleting some decomposed intrinsic mode functions (IMFs). This denoising process enables PIS more obvious. Therefore, the main concern for denoising of this paper will be paid to EMD method.
Mert and Akan [11] used detrended fluctuation analysis to determine which IMFs are noise components. Tian et al. [12] proposed a new method to decide how many high frequency IMFs should be removed as noise through adjusting two parameters – typical range and low frequency fraction. Kim et al. [13] developed an ensemble EMD (EEMD) method for traffic collision data denoising. Zheng et al. [14] proposed an optimum denoising methods based on EEMD to extract pulse signals in measurement while drilling. It should be noticed that different problem need to delete different frequency signal. For some problems, high frequency signals are regarded as noises. On the contrary, for some other problems, low frequency signals are regarded as noises. Though EMD can be used to denoise, it also has some inherent problems. Therefore, since EMD was proposed, there are many revision versions developed for solving its inherent deficients. Huang et al. [15] pointed out that there will have mode mixing problem when extract the IMF. In order to alleviate mode mixing effect, Wu and Huang [16] proposed EEMD to overcome the defects of EMD. Zhang et al. [17] investigated the parameters selection problem of EEMD. They are the amplitude of added white noise and the number of ensemble trials. For multivariate EMD (MEMD) method, Rehman and Mandic [18] proposed a noise-assisted MEMD method to resolve the mode mixing problem. Zheng et al. [19] developed an enhanced EEMD, complementary EEMD (CEEMD), to restrain the reconstruction residue and yields IMFs with the similar root mean square (RMS) noise as EEMD and effectively eliminates residue noise in the IMFs.
Except of the algorithms’ revision for EMD, there are many revisions combined with fault diagnosis application. EEMD is now a most popular method overcoming the mode mixing problem and is widely used in mechanical fault diagnosis domain. Žvokelj et al. [20] monitored the large size low speed bearings through principal component analysis multivariate monitoring approach and EEMD. Then, they proposed a non-linear multivariate and multiscale monitoring and signal denoising strategy using kernel principal component analysis combined with EEMD method [21]. Wu et al. [22] used EEMD and AR model to detect the looseness fault of different mechanical component. Feng et al. [23] diagnose the gear fault of wind turbine gearbox via demodulation analysis based on EEMD and energy separation. Guo et al. [24] developed a bearing fault signal recovery method from large noise based on spectral kurtosis and EEMD. Guo and Tse [25] proposed a signal compression method based on EEMD. This can alleviate the burden of wireless communication. Jiang et al. [26] developed an improved EEMD with multiwavelet packet for multi-fault diagnosis. In the paper, multiwavelet packet was used as the pre-filter to improve EEMD decomposition results. Wang et al. [27] proposed a new fault diagnosis method of diesel engine based on adaptive wavelet packet threshold denoising and EEMD. Liu et al. [28] developed a bearing fault diagnosis method based on wavelet package transform and EEMD. Gerogoulas et al. [29] proposed a bearing fault detection method based on hybrid ensemble detector and empirical mode decomposition. In the paper, EMD was used to extract the compact feature set. Then, a hybrid ensemble detector was used to classify the bearing fault. Amarnath and Krishna et al. [30] used EEMD to preprocess the vibration signal of gear surface wear. Then, kurtosis value was extracted and used to track the gear degradation. On the contrary, kurtosis value extracted from original vibration signals directly could not reflect the degradation. Amirat et al. [31] developed a bearing fault detection method of wind turbine generator based on EEMD processing of stator current homopolar component. Zhang and Zhou [32] developed a multi-fault diagnosis method for bearing based on EEMD and optimized support vector machine. Wang et al. [33] extracted the feature of early weak fault using EEMD combined with Q-factor wavelet transform. In the paper, EEMD was used to extract most useful signal content for post processing. Jiang et al [34] developed a fault identification method of rotor bearing system based on EEMD and self-zero space projection analysis. Tabrizi et al. [35] proposed an early bearing fault detection method based on wavelet packet decomposition, EEMD and support vector machine. Meng et al. [36] proposed a hybrid fault diagnosis method using morphological filter and invariant wavelet combined with improved EEMD. In the paper, morphological filter and invariant wavelet were used to reduce the narrowband impulses and random noises. Autocorrelation analysis was used to select the most useful IMFs and the low frequency IMFs were deleted. Yang and Wu [37] developed a gear fault diagnosis method based on EEMD, principle component analysis and artificial neural network.
Even now there are many successful applications of EMD and EEMD in mechanical fault diagnosis. However, mode mixing problem has not been addressed sufficiently. If this problem can be alleviated further, the effect of fault diagnosis and degradation analysis will be better. So, in this paper, a new improved EMD will be used. For this improved EMD, an AM-FM demodulation algorithm is used to resolve the mode mixing problem of IMF [38]. Traditionally, any existed methods prefer to resolve the mode mixing problem of sine waves. However, in many mechanical systems, most of the vibration signals can be modeled as AM-FM functions. So, this new revised method can be used to decompose the bearing fault signals and for post processing. Those IMFs unrelated to bearing fault will be deleted and a new signal can be reconstructed by the remaining IMFs. Then, MCKD is used to enhance the PIS contained in bearing fault signal. For fault diagnosis, envelope analysis is used to detect if exist relevant bearing fault frequencies. For bearing degradation estimation, correlated kurtosis (CK) is used as an indicator to track the bearing degradation.
The main contribution of this paper can be concluded as follows: (1) a new revised EMD is used to decompose the bearing fault signal. In this revised EMD, mode mixing problem of AM-FM signals is resolved by constructing a masking signal through new estimation algorithm. (2) Correlated coefficient is used to select appropriate IMFs to do post processing. Every IMF is processed using the recovering algorithm to recover the hidden-high frequency component. Finally, these recovered IMFs are used to reconstruct the fault signal. (3) MCKD is used to enhance the PIS in fault signal and CK value is used as an indicator to track the bearing degradation.
The remainder of this paper is organized as follows. In Section 2, problems of MCKD for processing fault signal are illustrated. In Section 3, we explain the revised EMD algorithm and its application effect. In Section 4, we propose the new fault diagnosis and prognosis framework based on revised EMD and MCKD. In Section 5, two bearing fault case studies are conducted. In Section 6, bearing degradation data sets are analyzed using proposed method. Finally, Section 7 concludes the work.
2. Problems of MCKD for PIS enhancement
As mentioned above, MCKD will be useless when PIS mixed with high level noise or the bearing at its early degradation stage. So, we should to subtract some un-relevant signal components from original fault signal and make the PIS more obvious. Below we will explain the problems using a simulation case.
The simulated bearing fault signals with single resonant frequency similar in [39] can be given as:
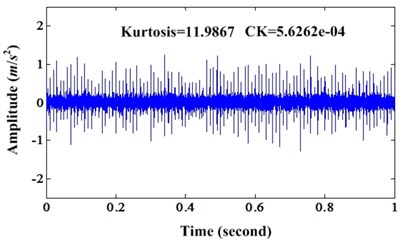
where equal to 0.1, is the resonant frequency equal to 2,600 Hz, and is used to simulate the randomness caused by slippage which is subject to a discrete uniform distribution. (equal to 1.5) is the amplitude of the simulated bearing impulse signal. Suppose the sampling frequency is 12,000 Hz. Then, we can simulate the bearing fault signals according to the fault frequency (equal to 100 Hz). A total of 24,000 samplings were used for each simulated signals. Finally, a random signal with a mean of zero and a standard deviation of 0.1 were added to Eq. (1). Fig. 1(a) is one second of the simulated signal.
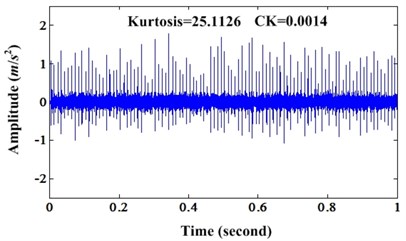
Then, we use MCKD to process the simulation signal. The parameter equals to 120. The filter size is 100. The iteration number is 100 and equal to 1. The result signal is illustrated in Fig. 1(b). From Fig. 1, we can see that kurtosis value of original signal and enhanced signal are 11.9867 and 25.1126 respectively. CK value of original signal and enhanced signal are 5.6262e-04 and 0.0014. From the wave form of Fig. 1(b) and the kurtosis and CK value, we can see the PIS is enhanced.
Fig. 1a) Waveform of simulation signal under noise level 0.1; b) Enhanced signal of a)
a)
b)
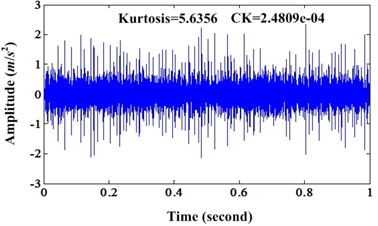
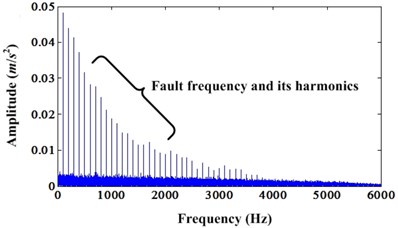
In order to validate the characteristics of MCKD under different noise level, then, we increase the noise level to 0.3, 0.5 and 0.8 respectively. For these three noise levels, we can observe the effectiveness of MCKD. For noise level 0.3, the orginal signal and enhanced signal can be depicted in Fig. 2(a) and (b). Fig. 3 is the corresponding envelope spectrum of signal depicted in Fig. 2. Fig. 2 shows that result signal enhanced by MCKD has more intense PIS than original signal. The parameters setting of simulation signal under different noise level are same to the case with noise level 0.1. Kurtosis values of original signal and enhanced signal are 3.5718 and 5.6356 respectively. CK values of original signal and enhanced signal are 1.0087e-04 and 2.4809e-04 respectively. Both kurtosis and CK indicators of enhanced signal are bigger than original signal. And from the envelope spectrum in Fig. 3, we can find that the amplitudes of fault frequency and its harmonics in envelope spectrum of enhanced signal are bigger than envelope spectrum of original signal.
Fig. 2a) Waveform of simulation signal under noise level 0.3; b) Enhanced signal of a)

a)
b)
Fig. 3a) Envelope spectrum of simulation signal under noise level 0.3; b) Envelope spectrum of enhanced signal under noise level 0.3
a)
b)
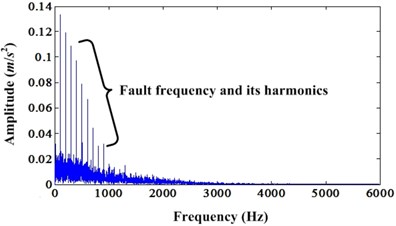
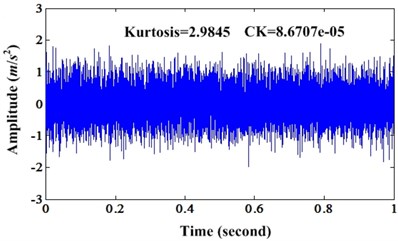
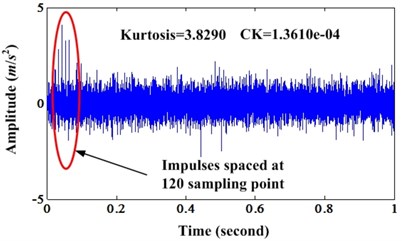
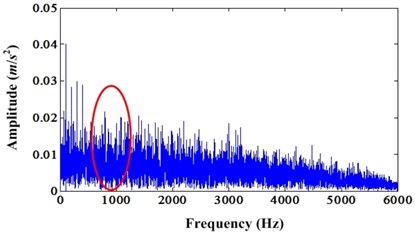
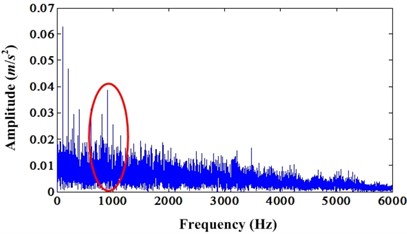
The enhanced results of simulation signal under noise level 0.5 can be depicted in Fig. 4 and Fig. 5. Fig. 4 is the comparison of original signal and enhanced signal. Fig. 5 is the envelope spectrum comparison of original signal and enhanced signal. Fig. 4 shows that both kurtosis and CK value of enhanced signal are bigger than the original signal. However, unlike the above cases, the enhanced signals have not continuous PIS. It only has one segment PIS. This is because of the noise influence. The envelope spectrums comparison also explained this phenomenon. Because of the noise influence, very limited enhancement can be found in envelope spectrum compared to the case of noise level 0.3. From Fig. 5, we can see that there are harmonics of fault frequency around 1,000 Hz. However, we cannot find these in the envelope spectrum of original signal.
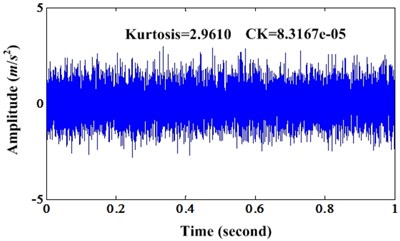
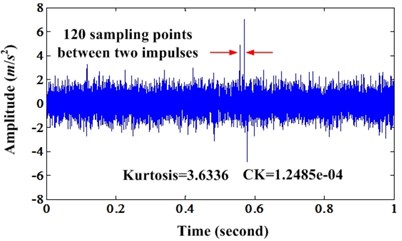
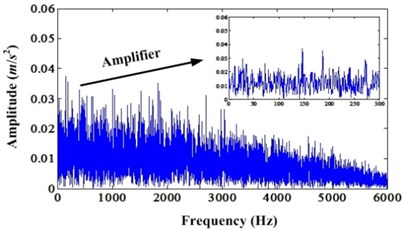
Then, we can continue increase the noise level to 0.8. Fig. 6 is the original signal and the enhanced signal. It shows that the PIS is enhanced. However, there is only very short part of signal which is enhanced depicted in Fig. 6(b). Fig. 7 is the envelope spectrums of original signal and enhanced signal. From the envelope spectrum of original signal, we cannot find any fault information. However, the envelope spectrum of enhanced signal can find the fault frequency but have not the harmonics. This denotes that the enhancement effect decrease with the noise increase.
Fig. 4a) Waveform of simulation signal under noise level 0.5; b) Enhanced signal of a)
a)
b)
Fig. 5a) Envelope spectrum of simulation signal under noise level 0.5; b) Envelope spectrum of enhanced signal under noise level 0.5
a)
b)
Fig. 6a) Waveform of simulation signal under noise level 0.8; b) Enhanced signal of a)
a)
b)
Fig. 7a) Envelope spectrum of simulation signal under noise level 0.8; b) Envelope spectrum of enhanced signal under noise level 0.8
a)
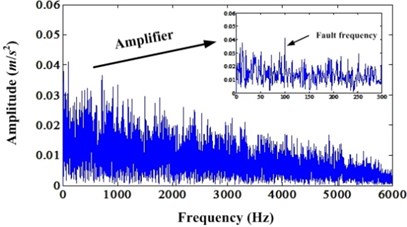
b)
3. Revised EMD algorithm
As explained before, mode mixing is a main problem of EMD. Wu and Huang [16] pointed out that there are two possible reasons of mode mixing. First, single IMF contains signals of widely disparate scales. Second, signals of a similar scale reside in different IMF components. Taking a signal for example, if decompose using EMD, denotes the high frequency component, denotes the low frequency component. If parts of are completely immersed in parts of , we say the mode mixing problem occurring. In decomposing actions, sifting process not only extracts the extrema of in the parts of that are immersed, but also extracts the extrema of in other parts of . This will lead to intermittency in the extrema of the signal. In other words, the extrema detected in sifting process belong to different signals. Therefore, this will cause a result that a single IMF comprised of different scales. Some parts are from signal and some others are from signal .
The mode mixing resolving approach consists of two steps. First, high frequency signal hidden in the extracted IMF is recovered. Second, a masking signal is constructed and used to recover the desired IMF. Proposed algorithms can resolve the mode mixing problem of two additive AM-FM signals and also can be extended to solve the mode mixing problem of more than two additive AM-FM signals. For bearing fault diagnosis, the fault signal always appears in the high frequency. So, this method is very useful for recovering the bearing fault signal. If the analyzed signal is a simple AM-FM signal, it can be defined as:
where , and . and are the low frequency and high frequency FM components respectively. excludes the signals containing segments with zero values. The first IMF of signal can be represented as:
where and , and , 0.
First, an AM-FM signal can be used to approximate the IMF . Then, the difference between signal and can be denoted as . Finally, can be derived as follows:
The extrema of the hidden frequency component can be retrived from . On the other hand, is upper bounded by a small value . Therefore, may be a threshold or some morphological operators can be applied to such that the values of on segments become zero. Calculated signal is for , and it contains a zero value for .
In order to construct the masking signal, signal where can be used. Because , then, we have:
Finally, the extrema of can be obtained:
On account of is a slowly varying function, positions of extrema of are close to those of . So, IMF of should keep a similar frequency function to . Through AM-FM demodulation of , a normalized can be obtained by dividing by the derived envelope. is desired masking signal.
Finally, the steps of recovering desired IMF are as follows:
1) If the input signal , then, it can be decomposed by EMD and acquire the IMF .
2) Usually, we assume exist a mode-mixing problem.
3) Signal can be estimated from and can be computed.
4) can be derived from by setting , where , is a parameter.
5) A sufficiently large value should be set and can be obtained.
6) Decompose using EMD to obtain the IMF .
7) Normalize by dividing the envelope of to obtain the FM signal .
8) Decompose using EMD to obtain the IMF . Finally, IMF from can be obtained in a similar manner.
9) Return the desired IMF is .
For detail algorithm derivation of revised EMD and its comparison to EEMD can be referred to [38]. In addition, there are many examples to explain the effectiveness of proposed method.
4. Proposed new framework for fault diagnosis and prognosis
Before explaining the framework, we introduce the MCKD briefly. MED selects a finite impulse response (FIR) filter to minimize the entropy of the filtered signal. However, MCKD selects a FIR filter to maximize the CK of the resulting signal. CK not only emphasizes the high kurtosis but also encourages periodicity about a specific period determined by fault. The CK defined as follows:
For CK, when 0 and 1, CK is the kurtosis norm. In reality, the function of CK is to detect the PIS in signal. For signals collected from rotating machineries, especially for early weak fault, the PIS is very weak compared to other frequency components. If using kurtosis norm to estimate the bearing fault level, this will achieve an error result. However, Eq. (7) and Eq. (8) is to judge if exist PIS in signal. Eq. (7) is the first shift CK and Eq. (8) is the th shift CK. Higher shift CK can be used to test long sequences of impulses in a signal. Value of can be selected based on different fault signal. For the incipient fault, should be smaller, because it is difficult to detect intense impulses in a long signal. For severe fault, can be bigger to detect the long sequences of impulses.
As we know, the effect of MCKD can be influenced by the noise level of vibration signals. So, we should to denoise it first. The detail processes of proposed fault diagnosis and prognosis method are explained as follows:
First, vibration signal acquired from rotating machinery should be decomposed using traditional EMD. Then, useful IMFs which contain intense PIS are selected according to the correlation coefficient between IMF and original signal. In this process, some low frequency signal and random noise signal are subtracted. Continually, these selected IMFs should be processed using revised EMD algorithm to alleviate the mode mixing problem existed in these IMFs according to proposed steps in Section 3. Finally, the vibration signal can be reconstructed using these recovered IMFs. The resulted signal will have low noise and more useful signal component.
Second, MCKD is used to enhance the PIS of the resulted signal after revised EMD processing. For MCKD, parameter is an important factor. In real engineering application, we need to detect different possible fault using different parameter which is related to the fault type, because for a normal component, we do not know which fault type it will have. For revised EMD, we also need to determine the parameter first.
Third, for diagnosis, we can do some spectrum analysis to detect the relevant fault frequencies. For example, for gear fault, Fourier spectrum should be conducted to detect the sideband frequency. For bearing fault, envelope analysis should be conducted to detect the bearing fault frequencies.
Finally, for prognosis, degradation indicators should be extracted from the enhanced signals. And, some prediction methods can be used to predict the future state of object component. In this paper, CK is used as the degradation indicator to tracking the health state of bearing.
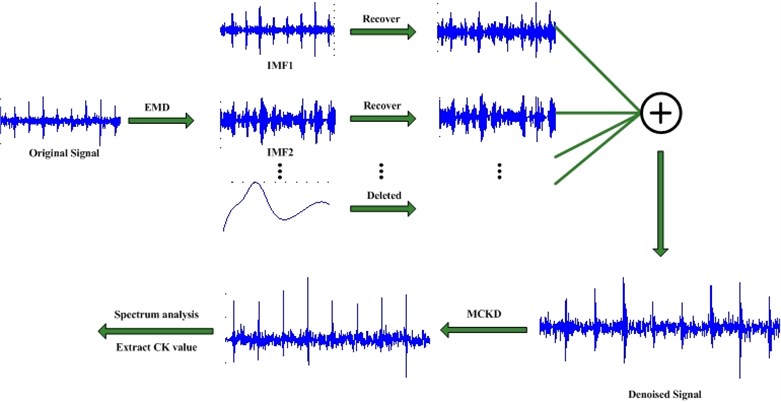
In conclusion, the fault diagnosis and prognosis framework can be illustrated in Fig. 8.
Fig. 8Proposed framework of fault diagnosis and prognosis
5. Verified proposed method using bearing fault data
5.1. Verified using simulation data
First, a simple simulation case is used to verify the effectiveness of proposed method for subtracting low frequency signals. Except of the random noise signal with level 0.1, we also can add two cosine signals with frequency 35 Hz and 136 Hz to the simulated bearing fault signal denoted in Eq. (1). The amplitudes of these two cosine signals are 0.1. Then, we can observe the frequency spectrum depicted in Fig. 9. We can see obvious frequency contents 35 Hz and 136 Hz.
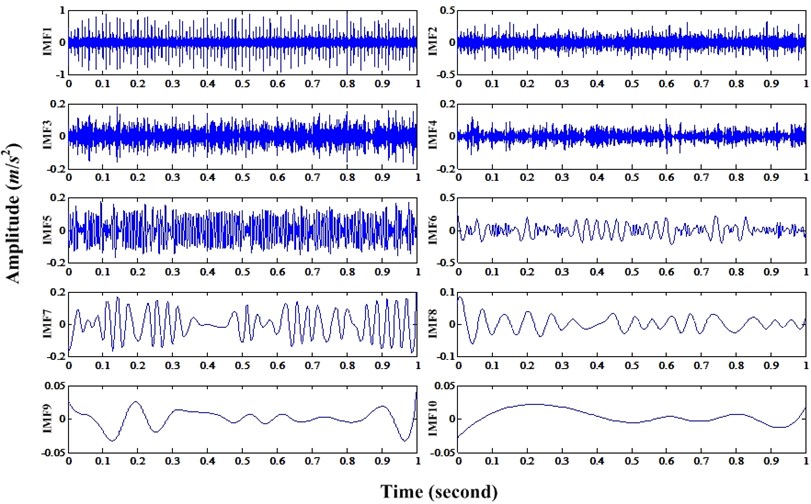
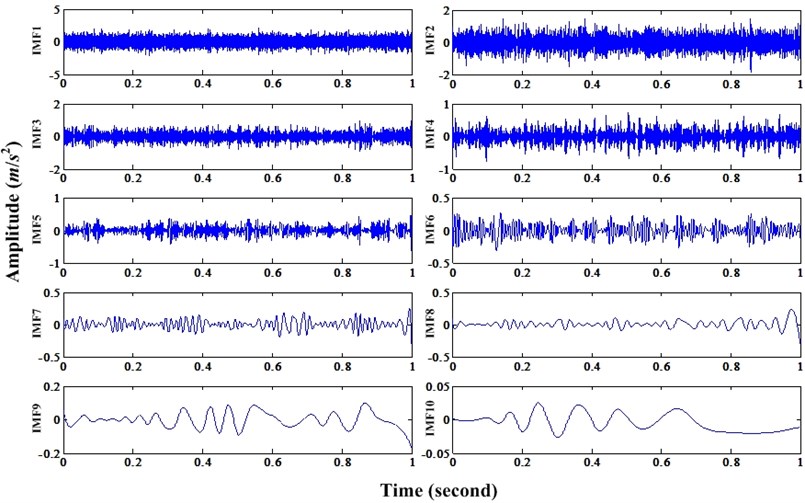
Then, this mixed signal is decomposed using traditional EMD. We can acquire ten IMFs. Afterwards, correlated coefficient between each IMF and original signal can be calculated. They are (0.6751, 0.2519, 0.1474, 0.0968, 0.3242, 0.3703, 0.3183, 0.0059, 0.0053, 0.0032) and the ten IMFs can be depicted in Fig. 10.
Generally, different IMF denotes different frequency signal. And, the frequency is from high to low of IMFs. Bearing faults always manifest themselves in high frequency zone and modulated with resonance frequency. So, the bearing fault information is most probably contained in IMFs with high frequencies. For IMFs with higher correlated coefficients denote they contain more fault related information. For the remaining IMFs, they usually contain low frequency information. So, they should be subtracted. Finally, we only select first four IMFs to do recovering operation and then reconstruct the bearing fault signal based on these resifted IMFs. The frequency spectrum of new bearing fault signal after denoise can be illustrated in Fig. 11. We can see that discrete frequency 35 Hz and 136 Hz has been subtracted. In real engineering cases, for bearing fault diagnosis, the signals of other components like gear, shaft etc will be subtracted through proposed method. Then, the bearing fault diagnosis will be easier.
Fig. 9Frequency spectrum of bearing fault signal mixed with discrete frequency and noise
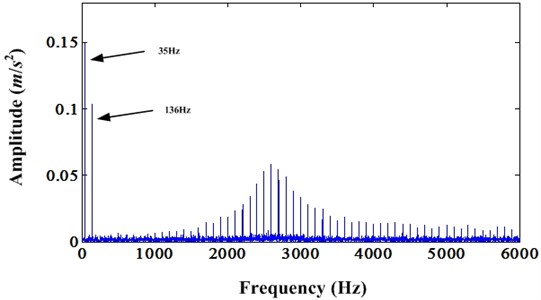
Fig. 10Ten IMFs of bearing fault signal mixed with discrete frequency and noise
As shown in Fig. 7 of Section 2, with the noise increasing, PIS produced by bearing fault are buried in noise. In order to demonstrate the validity of proposed method, simulation signal of bearing fault under noise level 0.8 is processed using proposed method. Fig. 12 is the EMD decomposition results of bearing fault simulation signal under noise level 0.8. According to the correlated coefficient value, first four IMFs are selected to do the recovering operation. Fig. 13 is the first four IMFs and corresponding recovered IMFs using proposed method in Section 3. For recovering process, the parameter is set to 0.5 in this paper. Then, these recovered IMFs can be used to reconstruct the bearing fault signal and enhanced by MCKD method. In this case, the parameters of MCKD are same to the cases in Section 2. Finally, we can acquire the envelope spectrum of resulted signal. It can be seen in Fig. 14. Compared to the Fig. 7 (b), we can see that the fault frequency (100 Hz) and its second harmonic (200 Hz) are obvious in Fig. 14. It demonstrates the proposed method can subtract the random noise and low discrete frequencies effectively.
Fig. 11Frequency spectrum of resulted signal
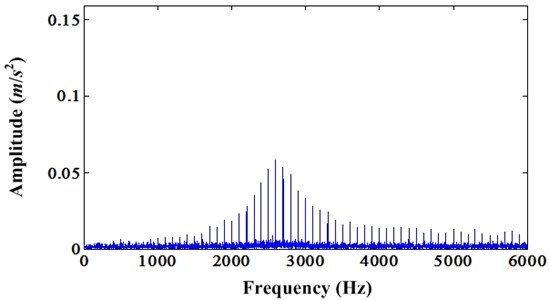
Fig. 12IMFs decomposed from bearing fault simulation signal under noise level 0.8
5.2. Verified using injected fault bearing data
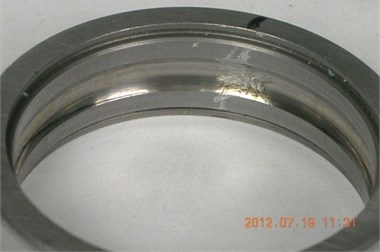
The test rig [40] was equipped with a NICE bearing with the following parameters: roller diameter 0.235 inch, pitch diameter 1.245 inch, number of elements is 8, and the contact angle equal to 0°. The input shaft rotation rate is 25 Hz. The sample frequency is 48,828 Hz and lasting 3 seconds. For outer race fault conditions, seven data sets are acquired respectively under load 25, 50, 100, 150, 200, 250, 300 lbs. We define the four fault characteristic frequencies as ball pass frequency inner race (BPFI), ball pass frequency outer race (BPFO), ball spin frequency (BSF), and fundamental train frequency (FTF). Through the geometric parameters of NICE bearing, the fault characteristic frequencies can be calculated as follows: BPFO (81.12 Hz), BPFI (118.88 Hz), BSF (63.86 Hz) and FTF (10.14 Hz). The outer race fault is depicted in Fig. 15.
Fig. 13First four IMFs and their recovered results using proposed method
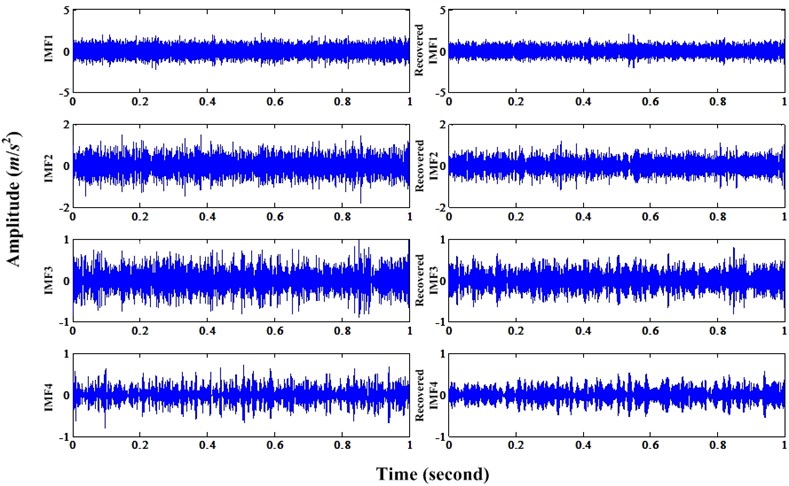
Fig. 14Envelope spectrum of resulted signal processed by proposed method under noise level 0.8
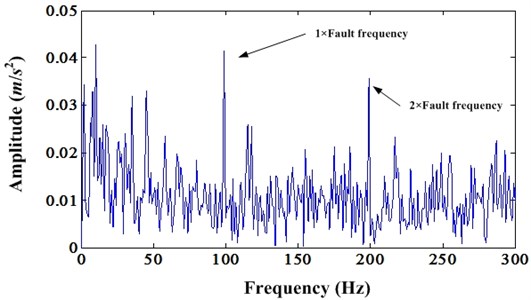
Fig. 15Outer race fault
Because the sampling frequency of this data sets are too high, if using short data to decompose, the spectrum will have low frequency spectrum. On the contrary, if using length data to decompose, it will take a long time to complete this work. In order to alleviate this problem, the bearing fault signal should be down sampled. In this case, it is down sampled from 48,828 Hz to 24,414 Hz. Then, bearing fault signal is decomposed by traditional EMD and the first four IMFs are selected for recovering according to correlated coefficient. The first four IMFs and their recovered signals can be shown in Fig. 16. Afterwards, the fault signal is reconstructed using recovered IMFs and enhanced by MCKD. The parameters of MCKD are same to the case in Section 2.
Fig. 16First four IMFs and their recovered results using proposed method
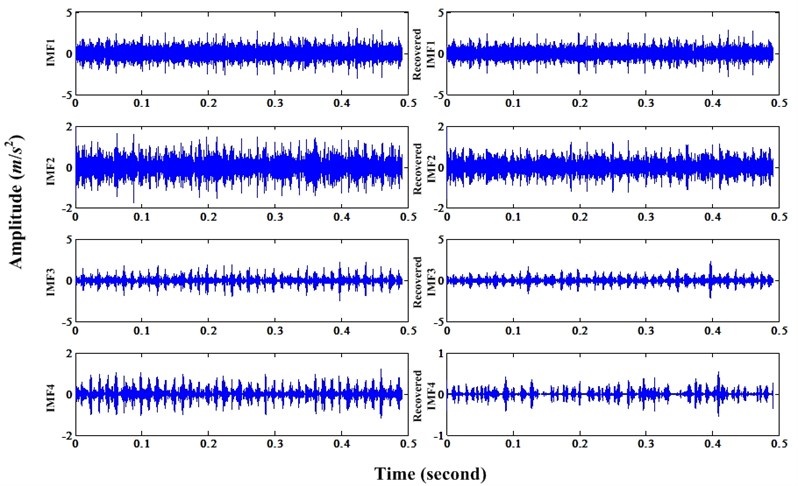
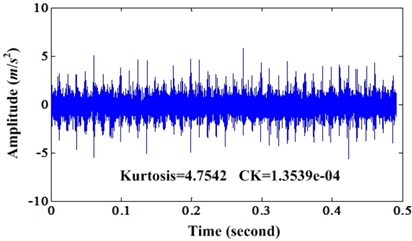
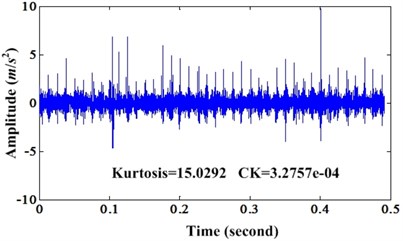
Fig. 17a) Waveform of bearing outer race fault signal; b) Enhanced signal of a)
a)
b)
Fig. 18a) Envelope spectrum of original bearing outer race fault signal; b) Envelope spectrum of enhanced bearing fault signal
a)
b)
Fig. 17 is the comparison of original signal and the enhanced signal by proposed method. We can see that not only kurtosis but also the CK of enhanced signal are bigger than original signal. Fig. 18 is the corresponding envelope spectrum of Fig. 17.
From Fig. 18, we can see the outer race fault frequency and its harmonics are enhanced by proposed method. Because there are obvious harmonics around 2,000 Hz in envelope spectrum of enhanced signal, but it cannot be found in the envelope spectrum of original signal.
5.3. Verified using real bearing fault data
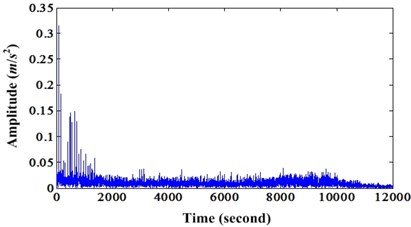
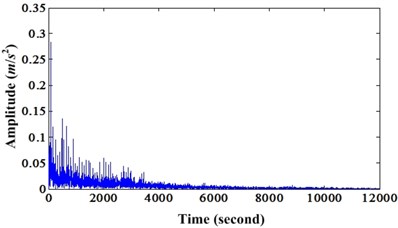
This case is a bearing fault of intermediate shaft from a wind turbine [40]. According to shaft rate and fundamental bearing fault frequencies, four bearing fault frequencies can be acquired: BPFO (51.89 Hz), BPFI (67.85 Hz), BSF (24.3 Hz) and FTF (2.76 Hz). Then, we can use proposed method to process this data set. In order to save the space, only results are given below. Fig. 19 is the comparison of original signal and enhanced signal of this real bearing fault case. Similarly, both CK and kurtosis value of enhanced signal are bigger than original signal. Fig. 20 is the corresponding envelope spectrums of original signal and enhanced signal. From Fig. 20, we can see the first BSF and its second harmonic are very obvious compared to the original envelope spectrum.
Fig. 19a) Waveform of bearing fault signal of intermediate shaft; b) Enhanced signal of a)

a)

b)
Fig. 20a) Envelope spectrum of original bearing fault signal; b) Envelope spectrum of enhanced signal
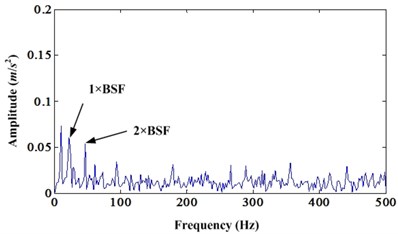
a)
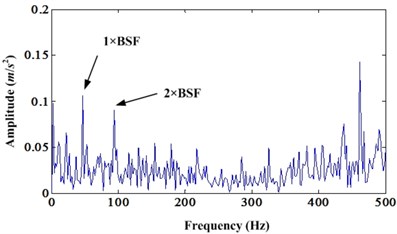
b)
6. Bearing degradation tracking using proposed method
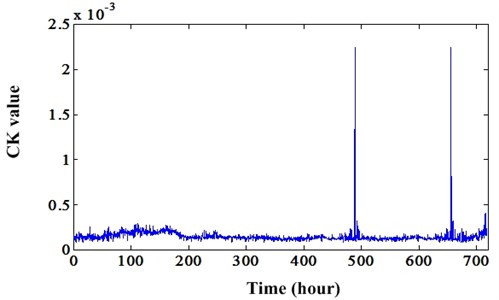
This bearing degradation data set is come from center on Intelligent Maintenance Systems [41]. There are four bearings on the shaft. The shaft speed was kept constant at 2,000 rpm and the load is 6,000 lbs. The bearing type is Rexnord ZA-2115. It is a double row bearing. Each row has 16 rollers. The pitch diameter is 71.501 mm. The roller diameter is 8.4074 mm and the tapered contact angle is 15.17°. According to these geometric parameters, we can acquire the bearing fault frequencies: BPFO (236.40 Hz), BPFI (296.93 Hz), BSF (139.92 Hz), and FTF (14.78 Hz). For this bearing degradation test, on each bearing, two PCB 353B33 High Sensitivity Quartz ICP Accelerometers were installed. So, there are a total of 8 accelerometers (one vertical and one horizontal on each). Vibration data was collected every 20 minutes by a National Instruments DAQCard-6062E data acquisition card. The data sampling rate is 20 kHz and the data length is 20,480 points. After test, it is reported that bearing 4 had severe outer race fault. So, when using proposed method to enhance the PIS in vibration signal, the should be the outer race fault period. The remaining parameters of MCKD are same to cases in Section 2. All the degradation data are processed using proposed method. Then, CK value is extracted to track the bearing degradation, because CK can reflect the PIS level more appropriate than kurtosis. Because of the page limit, only results of degradation path are given. Fig. 21 is the degradation indicator of enhanced signal by proposed method. Fig. 22 is the degradation indicator of original signal. Comparing these two degradation indicators, we can conclude that CK values of enhanced signal by proposed method can reflect the health state of bearing properly and have good degradation trend than CK values extracted from original signals. This will be very beneficial to the RUL prediction.
Fig. 21Degradation indicator (CK value) of enhanced signal by proposed method
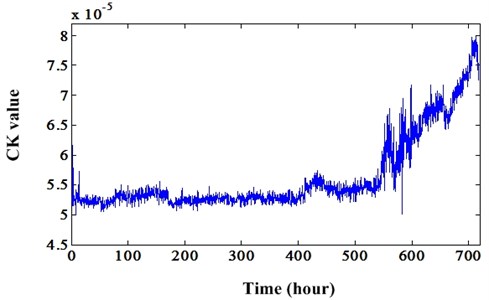
Fig. 22Degradation indicator (CK value) of original signal
7. Conclusions
In this paper, a novel bearing fault diagnosis and degradation indicator extraction method is proposed. Bearing fault always produce vibrations at its fault frequencies and modulated with resonant frequencies. And, resonance frequencies usually are higher than gear mesh frequency, shaft rate etc. So, proposed fault signal reconstruction method can subtract signals of low frequencies and random noises effectively. In this process, a new method is used to resolve the mode mixing problem existed in IMFs. This method can recover the hidden high frequencies in IMFs. After reconstruction, MCKD is used to enhance the PIS signal and CK value is selected as the final degradation indicator. Both simulation cases and real bearing fault cases demonstrate the validity of proposed method. For degradation tracking, CK value extracted from enhanced signal has better trend than CK value of original signal. In future, based on this good degradation indicator, RUL can be predicted using many existed prediction methods.
References
-
Endo H., Randall R. B. Enhancement of autoregressive model based gear tooth fault detection technique by the use of minimum entropy deconvolution filter. Mechanical Systems and Signal Processing, Vol. 21, Issue 2, 2007, p. 906-919.
-
Sawalhi N., Randall R. B., Endo H. The enhancement of fault detection and diagnosis in rolling element bearings using minimum entropy deconvolution combined with spectral kurtosis. Mechanical Systems and Signal Processing, Vol. 21, Issue 6, 2007, p. 2616-2633.
-
Barszcz T., Sawalhi N. Fault detection enhancement in rolling element bearings using the minimum entropy deconvolution. Archieves of Acoustics, Vol. 37, Issue 2, 2012, p. 131-141.
-
McDonald G. L., Zhao Q., Zuo M. J. Maximum correlated kurtosis deconvolution and application on gear tooth chip fault detection. Mechanical Systems and Signal Processing, Vol. 33, 2012, p. 237-255.
-
Li Z., He Z. J., Zi Y. Y., Wang Y. X. Customized wavelet denoising using intra- and inter-scale dependency for bearing fault detection. Journal of Sound and Vibration, Vol. 313, Issue 1-2, 2008, p. 342-359.
-
Wang Y. X., He Z. J., Zi Y. Y. Enhancement of signal denoising and multiple fault signatures detecting in rotating machinery using dual-tree complex wavelet transform. Mechanical Systems and Signal Processing, Vol. 24, Issue 1, 2010, p. 119-137.
-
Wang X. D., Zi Y. Y., He Z. J. Multiwavelet denoising with improved neighboring coefficients for application on rolling bearing fault diagnosis. Mechanical Systems and Signal Processing, Vol. 25, Issue 1, 2011, p. 285-304.
-
Zhao Y. Q. Multi-level denoising and enhancement method based on wavelet transform for mine monitoring. International Journal of Mining Science and Technology, Vol. 23, Issue 1, 2013, p. 163-166.
-
Chen J. L., Zi Y. Y., He Z. J., Wang X. D. Adaptive redundant multiwavelet denoising with improved neighboring coefficients for gearbox fault detection. Mechanical Systems and Signal Processing, Vol. 38, 2013, p. 549-568.
-
Sun H. L., Zi Y. Y., He Z. J. Wind turbine fault detection using multiwavelet denoising with the data-driven block threshold. Applied Acoustics, Vol. 77, 2014, p. 122-129.
-
Mert A., Akan A. Detrended fluctuation thresholding for empirical mode decomposition based denoising. Digital Signal Processing, Vol. 32, 2014, p. 48-56.
-
Tian P. F., Cao X. J., Liang J. N., Zhang L., Yi N. N., Wang L. Y., Cheng X. P. Improved empirical mode decomposition based denoising method for lidar signals. Optics Communications, Vol. 325, 2014, p. 54-59.
-
Kim N. S., Chung K. H., Ahn S., Yu J. W., Choi K. Denoising traffic collision data using ensemble empirical mode decomposition (EEMD) and its application for constructing continuous risk profile (CRP). Accident Analysis and Prevention, Vol. 71, 2014, p. 29-37.
-
Zheng Y., Sun X. F., Chen J., Yue J. Extracting pulse signals in measurement while drilling using optimum denoising methods based on the ensemble empirical mode decomposition. Petroleum Exploration and Development, Vol. 39, Issue 6, 2012, p. 798-801.
-
Huang N. E., Shen Z., Long S. R. A new view of nonlinear water waves: The Hilbert spectrum. Annual Review of Fluid Mechanics, Vol. 31, 1999, p. 417-458.
-
Wu Z., Huang N. E. Ensemble empirical mode decomposition: a noise assisted data analysis method. Advances in Adaptive Data Analysis, Vol. 1, 2009, p. 1-41.
-
Zhang J., Yan R. Q., Gao R. X., Feng Z. H. Performance enhancement of ensemble empirical mode decomposition. Mechanical Systems and Signal Processing, Vol. 24, 2010, p. 2104-2123.
-
Rehman N., Mandic D. P. Filter band property of multivariate empirical mode decomposition. IEEE Transactions on Signal Processing, Vol. 59, Issue 5, 2011, p. 2421-2426.
-
Zheng J. D., Cheng J. S., Yang Y. Partly ensemble empirical mode decomposition: An improved noise-assisted method for eliminating mode mixing. Signal Processing, Vol. 96, 2014, 362-374.
-
Žvokelj M., Zupan S., Prebil I. Multivariate and multiscale monitoring of large-size low-speed bearings using ensemble empirical mode decomposition method combined with principal component analysis. Mechanical Systems and Signal Processing, Vol. 24, 2010, p. 1049-1067.
-
Žvokelj M., Zupan S., Prebil I. Non-linear multivariate and multiscale monitoring and signal denoising strategy using kernel principal component analysis combined with ensemble empirical mode decomposition method. Mechanical Systems and Signal Processing, Vol. 25, 2011, p. 2631-2653.
-
Wu T. Y., Hong H. C., Chung Y. L. A looseness identification approach for rotating machinery based on post-processing of ensemble empirical mode decomposition and autoregressive modeling. Journal of Vibration and Control, Vol. 18, Issue 6, 2012, p. 796-807.
-
Feng Z. P., Liang M., Zhang Y., Hou S. M. Fault diagnosis for wind turbine planetary gearboxes via demodulation analysis based on ensemble empirical mode decomposition and energy separation. Renewable Energy, Vol. 47, 2012, p. 112-126.
-
Guo W., Tse P. W., Djordjevich A. Faulty bearing signal recovery from large noise using a hybrid method based on spectral kurtosis and ensemble empirical mode decomposition. Measurement, Vol. 45, 2012, p. 1308-1322.
-
Guo W., Tse P. W. A novel signal compression method based on optimal ensemble empirical mode decomposition for bearing vibration signals. Mechanical Systems and Signal Processing, Journal of Sound and Vibration, Vol. 332, 2013, p. 423-441.
-
Jiang H. K., Li C. J., Li H. X. An improved EEMD with multiwavelet packet for rotating machinery multi-fault diagnosis. Mechanical Systems and Signal Processing, Vol. 36, 2013, p. 225-239.
-
Wang X., Liu C. W., Bi F. R., Bi X. Y., Shao K. Fault diagnosis of diesel engine based on adaptive wavelet packets and EEMD-fractal dimension. Mechanical Systems and Signal Processing, Vol. 41, 2013, p. 581-597.
-
Liu Q., Chen F., Zhou Z. D., Wei Q. Fault diagnosis of rolling bearing based on wavelet package transform and ensemble empirical mode decomposition. Advances in Mechanical Engineering, 2013.
-
Georgoulas G., Loutas T., Stylios C. D., Kostopoulos V. Bearing fault detection based on hybrid ensemble detector and empirical mode decomposition. Mechanical Systems and Signal Processing, Vol. 41, 2013, p. 510-525.
-
Amarnath M., Krishna I. R. P. Detection and diagnosis of surface wear failure in a spur geared system using EEMD based vibration signal analysis. Tribology International, Vol. 61, 2013, p. 224-234.
-
Amirat Y., Choqueuse V., Benbouzid M. EEMD-based wind turbine bearing failure detection using the generator stator current homopolar component. Mechanical Systems and Signal Processing, Vol. 41, 2013, p. 667-678.
-
Zhang X. Y., Zhou J. Z. Multi-fault diagnosis for rolling element bearings based on ensemble empirical mode decomposition and optimized support vector machines. Mechanical Systems and Signal Processing, Vol. 41, 2013, p. 127-140.
-
Wang H. C., Chen J., Dong G. M. Feature extraction of rolling bearing’s early weak fault based on EEMD and tunable Q-factor wavelet transform. Mechanical Systems and Signal Processing, Vol. 48, 2014, p. 103-119.
-
Jiang F., Zhu Z. C., Li W., Zhou G. B., Chen G. A. Fault identification of rotor-bearing system based on ensemble empirical mode decomposition and self-zero space projection analysis. Journal of Sound and Vibration, Vol. 333, 2014, p. 3321-3331.
-
Tabrizi A., Garibaldi L., Fasana A., Marchesiello S. Early damage detection of roller bearings using wavelet packet decomposition, ensemble empirical mode decomposition and support vector machine. Meccanica, 2014.
-
Meng L. J., Xiang J. W., Wang Y. X., Jiang Y. Y., Gao H. F. A hybrid fault diagnosis method using morphological filter-translation invariant wavelet and improved ensemble empirical mode decomposition. Mechanical Systems and Signal Processing, Vol. 50-51, 2015, p. 101-115.
-
Yang C. Y., Wu T. Y. Diagnostics of gear deterioration using EEMD approach and PCA process. Measurement, Vol. 61, 2015, p. 75-87.
-
Hu X. Y., Peng S. L., Hwang W. L. EMD revisited: A new understanding of the envelope and resolving the mode-mixing problem in AM-FM signals. IEEE Transactions on Signal Processing, Vol. 60, Issue 3, 2012, p. 1075-1086.
-
Wang D., Tse P. W., Tsui K. L. An enhanced Kurtogram method for fault diagnosis of rolling element bearings. Mechanical Systems and Signal Processing, Vol. 35, 2013, p. 176-199.
-
Fault Data Sets. http://www.mfpt.org/, 2013.
-
Qiu H., Lee J., Lin J., Yu G. Wavelet filter-based weak signature detection method and its application on rolling element bearing prognostics. Journal of Sound and Vibration, Vol. 289, 2006, p. 1066-1090.
About this article

