Abstract
Extended finite element frame based on Abaqus is applied to research the crack propagation problem of two-dimensional long rectangular thin plate. Presuppose type I crack with different horizontal locations and longitudinal dimensions, the propagation characteristics of the edge crack is discussed with the objects of structural flexibility of the thin plate, crack propagation length and plastic zone of crack tip etc. The results indicate that the horizontal location of the initial crack has a small influence on the crack propagation characteristics, and it only affects the local flexibility of the thin plate as well as the dimension and shape of plastic zone of crack tip. The longitudinal dimension of the initial crack obviously nonlinear influence on various parameters of the crack propagation characteristics. In view of the disastrous consequence of crack propagation, the vibration characteristics of the thin plate with different crack dimensions and crack locations are discussed based on the experiment and simulation modal analysis on the thin plate, thus providing basis for prior estimation and control for crack generation and propagation.
1. Introduction
Fatigue and fracture have always been the problems concerned by solid mechanics and engineering materials. The material defects and stress concentration in the structure often cause fracture of the structure. Fracture mechanics starts to seek the quantitative relation among the crack length, material crack resistance and critical stress of rapid crack propagation ever since its occurrence. The dynamic process of crack propagation[1] directly participates in the process of component failure, and it directly affects the service life of the component.
Thin shell, thin plate and other thin-walled structures are commonly used bearing structures in engineering. With the development of information technology and manufacturing technology, fracture and fatigue at microcosmic levels have become the scientific problems which are urgently concerned. Thin plate structure bears compressive stress near the initial crack and bears tension stress along the crack propagation direction. The horizontal location and the longitudinal dimension of the initial crack will affect the distribution of the tension stress and compressive stress, which may cause failure. Extended finite element (XFEM) [1, 2] is an expansion of a traditional finite element method based on element division, and the mesh which it uses are unrelated to geometric structure and physical interface. It overcomes the difficulties brought by high density mesh distribution in high stress and deformation concentration zone. It doesn’t need to distribute the grids again when simulating crack propagation, which provides powerful tools [3, 4] for fracture analysis on the structure.
To increase the strength of the structure, it can improve the material performance [5, 6] on the one hand, and cognize the fracture process and mechanism [7, 8] on the other hand, thus realizing control at earlier stage to reduce crack failure [9]. Given the status which there are few researches on the fracture and its propagation of bearing thin plate components. This paper discusses the influence of the type I crack location and crack dimension of two-dimensional rectangular thin plate on the characteristics of crack propagation by means of the extended finite element model [10]. The discussion can be completed from the respects of structural flexibility of the thin plate, plastic zone of crack tip [11, 12] and crack propagation length etc. Finally, in view of the serious result due to crack propagation, it needs to identify the generation and propagation of the cracks in the structures and to take corresponding measures to control them. In term of experiments, ultrasonic non-destructive test has become an effective method [13, 14]. Correspondingly, in terms of theory, crack diagnosis based on modal analysis has become a feasible and economical method [15, 16]. Therefore, analysis is carried out on the characteristics of the vibration of the thin plate based on different dimensions and crack locations of the initial cracks, and modal parameters - modal displacement and frequency are the observation objects, which provides foundation for the crack diagnosis and control of the thin plate structures.
2. Theory of the extended finite element
2.1. Node function
For fracture analysis based on the extended finite element, the extended function mainly includes near-tip asymptotic function and step function. The near-tip asymptotic function is used for reflecting the stress singularity near the crack tip, while step function is used for representing the displacement jump feature on the crack surface. The approximation form of extended finite element method shall be:
where is a commonly used nodal displacement shape function, where represents the continuous part corresponding to displacement solving by finite element. and are the vectors of the extended degree of freedom of the nodes. is the step function of Heaviside, which is used for indicating the influence domain of the crack far from the crack tip. is the field base of Westergaard, i.e., the stress progressive function at the crack tip:
2.2. Fracture criterion
In the fracture mechanics model [4] based on Abaqus software, there are many fracture criterions such as maximum principal stress, principal strain, normal stress, normal strain, secondary traction and secondary separation etc. The maximum principal stress criterion is adopted in this paper:
where is the critical maximum principal stress. Macaulay brackets indicate that pure compression will not cause initial damage, as indicated in Eq. (5). When scale factor is larger than 1 in an allowed error range, the next incremental step will cause the emergence of a new crack or the extension of existing crack, thus causing macro fracture damage:
where is error amount.
2.3. Linear damage evolution equation
Linear damage evolution [17] consists of fracture separation amount and damage degree. The separation amount at initial fracture is small. The separation amount of the critical fracture is , so the separation before the critical point can be deemed as elasticity process. When the fracture occurs, i.e., the separation amount exceeds the critical value, the internal structure of the material shall be discontinuous. Thus, the tensile force it can bear also gradually reduces with the propagation of the crack, until the separation amount reaches complete facture failure. To describe the relationship between tangential and normal separation amount, the damage degree shall be determined by the relative value of the separation amount (effective separation amount), as shown in Eq. (7):
In in the equation, is the equivalent tensile force at initial fracture; is the maximum value that the equivalent separation amount reaches in the entire loading process.
3. Crack model of the limited long thin plate
Fig. 1 is a two-dimensional crack model of the limited thin plate. Its material is aluminum alloy, with the elasticity modulus of 72 GPa, Poisson’s ratio of 0.33. Its horizontal dimension is 2, and longitudinal dimension is 2, geometric dimension unit is mm. The horizontal location parameters and longitudinal dimension parameters of the initial crack are listed in Table 1 and Table 2 respectively.
Fig. 12D crack model of the finite thin-plate
Table 1The horizontal locations of the initial crack
1.2 | 1.8 | 2.4 | 3 | 3.6 | 4.2 | 4.8 | |
0.2 | 0.3 | 0.4 | 0.5 | 0.6 | 0.7 | 0.8 |
Table 2The longitudinal dimensions of the initial crack
2 | 0.3 | 0.6 | 0.9 | 1.2 | 1.5 | 1.8 | 2.1 |
0.1 | 0.2 | 0.3 | 0.4 | 0.5 | 0.6 | 0.7 | |
Note | 0.5, 10 MPa | ||||||
Maximum principal stress criterion is adopted in the calculation model, where error margin is set as 0.1. The power-law equation of fracture dissipation rate serves as the energy constraint equation; therefore, the crack propagation process shall be analyzed on the basis of linear damage evolution equation.
4. Results and discussions
4.1. Analysis of flexibility
According to fracture mechanics theories, the flexibility of structure can indirectly measure the energy release rate. Here, the concerned variables are the location and dimension of the crack. Although the applied load is a constant (10 MPa), since the maximum displacements at the loading point are different when the horizontal locations and longitudinal dimensions of the crack are different, the flexibilities of the thin plate shall be also different. The influences of the different initial locations of the crack and different initial dimensions of the crack on the flexibility of the thin plate are as shown in Fig. 2 and Fig. 3. Seen from Fig. 2, when the crack is located at the both end, the flexibility of the thin plate is the minimum. When the crack is located in the central location of the rectangular plate, the flexibility of the thin plate is small. However, when the crack is near either side of the plate center, ( 0.4 and 0.7), its flexibility is larger, and its flexibility when the crack is on the right side is larger than that when the crack is located on the left side.
Fig. 2Flexibility versus initial location of the crack
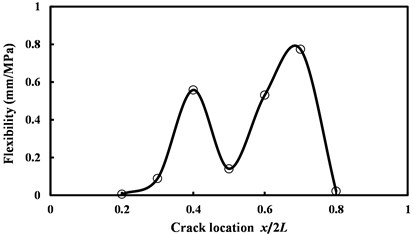
Fig. 3Flexibility versus initial size of the crack
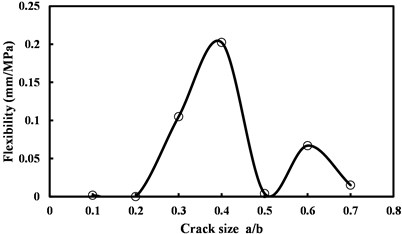
Seen from Fig. 3, when the dimension of the crack is small ( 0.2), the flexibility of the thin plate is very small, i.e., its structural rigidity is very large. When the crack dimension further increases, the flexibility of the thin plate will increase accordingly, and appear to be a linear progressive increase relationship. When the dimension of the crack increases to be almost half of the width of the rectangular plate, the flexibility of the thin plate shall reduce sharply and approach to minimum. When the dimension of the crack further increases, the flexibility will increase slightly before reduce.
Seen from the mentioned results, the influences of horizontal locations and longitudinal dimensions of the crack on the flexibility of the thin plate both don’t appear to be linear relationship. This is because that the fracture process of the crack is a dynamic process. On the one hand, there is certain randomness in the time response of the thin plate to external condition (for instance, loading), on the other hand, the propagation process of the crack is constrained by both the stress and the strain, and it is also constrained by energy conservation. As a result, the relationships among the variables will approach to be non-linear relationships. The larger the flexibility of the thin plate is, the deformation of the thin plate will be larger under certain loading conditions. Deformation includes elastic deformation and plastic deformation, and the final result of plastic deformation is the propagation of the crack and the fracture of the structure. Seen from the mentioned data, for the small cracks have small flexibility, and have large resistance against crack propagation, which is conducive to the structural stability and the safety of load bearing.
4.2. Crack propagation length
Fracture is a dynamic process. For the structures with initial cracks or structures will generate cracks, they shall be the status which is from small cracks to large cracks, from no crack to cracks. The crack propagation process is accompanied with the conversion of energy. This paper mainly discusses the crack propagation length here. The influences of the horizontal location and longitudinal dimension of the initial crack on the crack propagation length are as shown in Fig. 4 and Fig. 5.
Fig. 4Crack growth vs. the initial location of crack
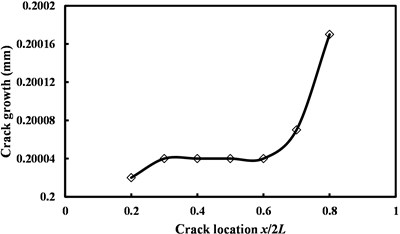
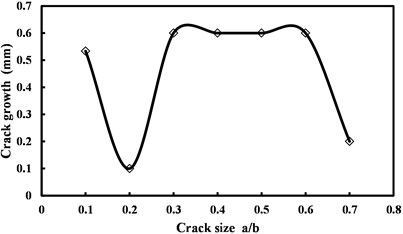
Fig. 5Crack growth vs. initial size of the crack
Seen from Fig. 4, the location of the crack has a small influence on the crack propagation length, and its change result is less than 1 μm. Specifically, as the horizontal location of the crack moves from the left side to the right side, the crack propagation length will increase slightly first, then stay unchanged. When the location of the crack further moves rightwards from location ( 0.6), the crack propagation length shall increase comparatively larger.
Comparatively speaking, the crack dimension has an obvious influence on the crack propagation length. Seen from Fig. 5, when the ratio between the crack dimension and the plate width is 0.2 and 0.7, the crack propagation length is comparatively small. When the ratio between the crack dimension and the plate width is in the range of (0.3, 0.6), the crack propagation length is comparatively large (all larger than 0.5 mm). Fracture mechanics generally holds that the larger the crack dimension is, the more dangerous the thin plate will be, i.e., the crack will propagate quickly. Comparing the results in Fig. 5, this is not contradictive to classical theories. Here, the researcher only carries out single factor analysis with the crack propagation length as the variable, however, the practical crack propagation process is a complicated dynamics process, which is not only influenced by external load, but also induced by the internal defects of the material, and it is also constrained by boundary conditions. The influences of various factors generated under different conditions are different. In addition, the damage caused by crack propagation is not only limited to the influence on the crack propagation length. What’s more important, the speed of crack propagation also has an influence which cannot be ignored. Limited by the length of the paper, we cannot discuss this in details here.
4.3. Crack tip plastic zone
When the thin plate suffers crack propagation, the work applied by external load makes the structure generate elastic deformation, in addition, it also makes the structure generate plastic deformation and fracture. Undoubtedly, plastic deformation absorbs quite a part of energy, and the change process of the energy is closely related to the propagation process of the crack. Under the external load, the material near the crack tip often yields, which indicates that there is plastic zone which can be used for buffering and retarding crack propagation near the crack tip.
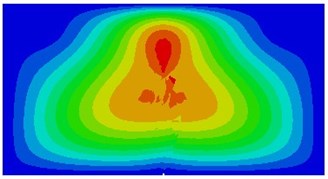
Under plane stress state, the third principal stress is zero. According to Mises yield condition, the boundary curve equation can be obtained as the followed:
where is the yield strength of the material. Non-dimensional plastic zone boundary is built based on this equation, as shown in Fig. 6.
Fig. 6Crack tip plastic zone of plane stress case
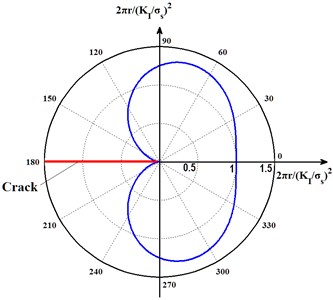
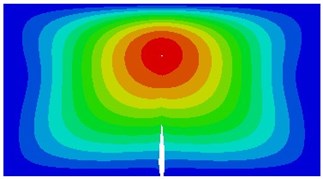
Fig. 7Crack tip plastic zone vs. the initial crack location
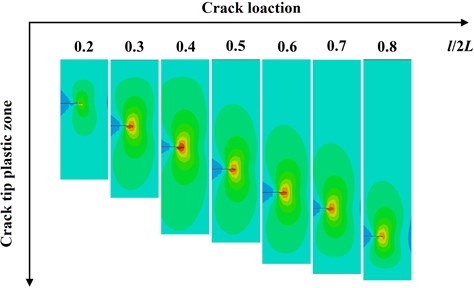
According to Fig. 7, the location of the initial crack has an obvious influence on the size and shape of the crack tip plastic zone. When the initial crack is near the left boundary of the rectangular plate ( 0.2), the plastic zone near the crack tip is very small. When the location of the crack moves from the left to the right, the area of the plastic zone near the crack tip will gradually increase. When 0.4, the area of the plastic zone near the crack tip will be the maximum. When the location of the initial crack further moves rightwards, the area of the plastic zone will gradually reduce. In the calculation example, when 0.8, it will reach the minimum value when the crack is located at the right side of the central line of the rectangular plate.
In addition, when the initial crack is located at the left side of the sym-center, the plastic zone in the part near the left side is small, and the plastic zone in the part far from the left boundary is large. When the initial crack is located at the right side of the sym-center, the plastic zone in the part near the right side of the crack boundary is small, and the plastic zone in the part near the left side of the crack boundary is large.
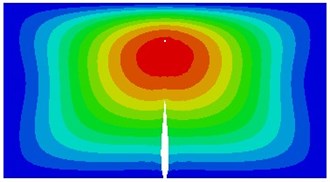
Fig. 8Crack tip plastic zone vs. the initial crack size
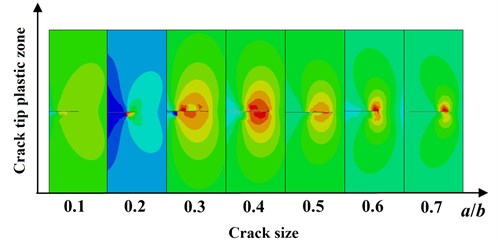
According to Fig. 8, the dimension of the initial crack has a complicated influence on the crack tip plastic zone. When the dimension of the crack is small ( 0.2), the shape of the plastic zone at crack tip will be left heaved (right depressed). At this time, the crack can be included in the range of short cracks whose initial propagation usually occurs after general yield. Crack tip plastic zone is not limited to the extended surface, instead, it extends two shear bands along the directions which is in 50° angle from the crack line [14]. When the dimension of the crack increases, complicated stress gradients will appear inside the crack tip plastic zone although the boundary of the plastic zone near the crack tip is axisymmetric with the initial crack line, the stress distribution is asymmetric.
In addition, when , the longitudinal dimension of the crack varies in the range of 0.3-0.5, the shape of the crack tip plastic zone is closer to the plastic zone under plane strain state. The shape of the crack tip plastic zone will not appear to be the plastic zone profile under plane strain state until is larger than 0.5. This is because of the follows. On the one hand, the defects that the extended finite element relies on the mesh, the crack surface must be set as the side of the element and the crack tip must be set as the node of the element when calculated, however, such setting will never eliminate the calculation result’s dependency on the grids. On the other hand, crack will cause crinkled effect of the structure during dynamic propagation process, thus affecting crack tip plastic zone. Thirdly, the smaller the crack dimension is, the larger the energy of the system will be [15], the dynamic process to achieve balance among various energies will be complicated.
4.4. Analysis of vibration characteristics
4.4.1. Test of experiment modal
The experimental thin plate is fixed inside a square frame which the size of the internal frame is 200×400 mm, then, they are fixed on a large-mass base in order to realize boundary conditions of four-side fixation, as shown in Fig. 9.
Due to the application of four-side fixation method, the constraint frequency of the structure can be obtained through experimental modal analysis and has a very good similarity with the finite element results.
Fig. 9Four-side fixation method in experiment
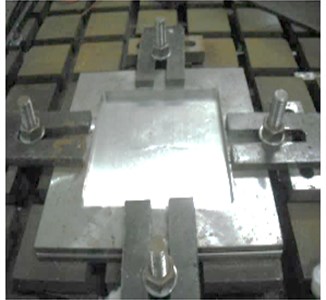
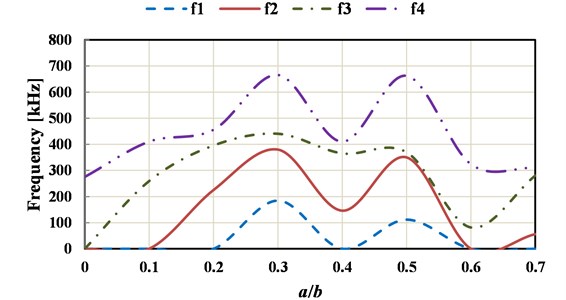
Fig. 10Influences of crack dimensions on the top 4 order natural frequencies
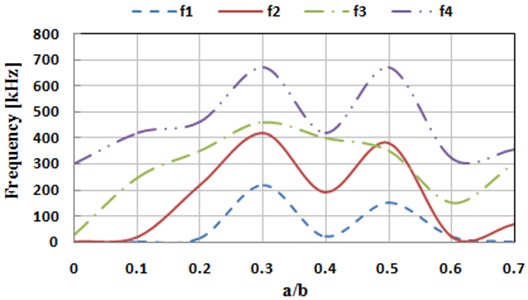
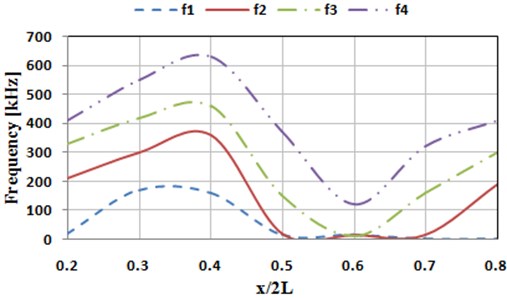
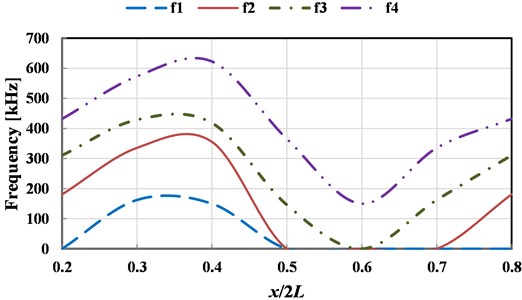
We choose SISO as the measurement method, and the thin plate is divided into 14 and 7 equal parts respectively along the length and width directions. Due to the application of four-side fixation method, edges of the thin plate cannot be measured, so that there are respectively 13 and 6 motivation points in length and width directions. There are 78 motivation points in total. During test, each set of data is tested for 3 times to obtain a mean value. Natural frequencies of the thin plate on the top 4 orders for different crack dimensions and horizontal locations are respectively measured, as shown in Fig. 10 and Fig. 11.
Fig. 11Influences of horizontal locations of crack on the top 4 order natural frequencies
4.4.2. Simulation analysis
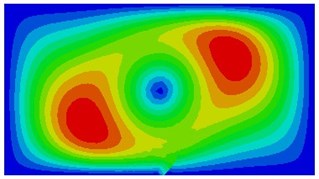
According to boundary conditions of the experiment, calculating the natural frequency on the top 4 orders under different dimensions of the initial cracks by simulation, and the result is shown in Fig. 12. It is shown through comparison between Fig. 12 and Fig. 10 that the experimental results and the simulation one have a good consistency in trends and values, indicating that the simulation model is real and reliable. In addition, it is shown in Fig. 10 or Fig. 12 that with the increase of crack dimension, the natural frequencies of the top 4 orders all occur changes to different extents. Moreover, for the thin plate structures including initial cracks with different lengths, the changes in the 1st, 2nd and 4th order frequencies are similar. The 3rd order natural frequency of the thin plate with crack is larger than the one without crack. Based on this, we will be able to judge whether there is any crack on a thin plate. Meanwhile, the crack propagation degree can be estimated according to the relative size of the natural frequency in Fig. 12.
Fig. 12The influences of the crack dimensions on the first four order natural frequencies
It is shown in the mentioned analysis that the 3rd natural frequency can be used to detect whether a thin plate structure has a crack, which is important for the engineering. Therefore, during simulation calculation of different initial crack dimensions, the 3rd order vibration mode of the thin plate is shown in Fig. 13. Seen from the figure, with increase in dimensions of the initial crack, the modal vibration mode will change to a certain extent, while number of most serious vibration zones decreases gradually.
Fig. 13The 3rd vibration mode under different initial crack dimensions
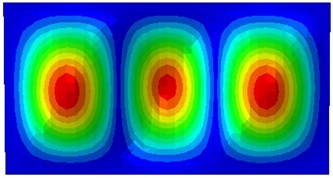
a) 0
b) 0.1
c) 0.2
d) 0.3
e) 0.4
f) 0.5
g) 0.6
h) 0.7
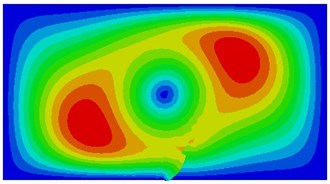
According to boundary conditions of the experiment, calculating the natural frequency on the top 4 orders under different horizontal crack locations by simulation, and the result is shown in Fig. 14. It is shown from comparison between Fig. 14 and Fig. 11 that the experimental results and the simulation one have a good consistency in trends and values, further indicating that the simulation model is real and reliable. In addition, it is shown in experiment or simulation results that when the horizontal location of the crack approaches to the symcenter of the thin plate, the frequency of vibration is small. The figure shows that when the relative horizontal location of the crack is ( 0.6), the natural frequencies on the top 4 orders of the thin plate are all minimum values. On the contrary, when the relative horizontal location of the initial crack is (0.3-0.4), the natural frequencies on the top 4 orders of the thin plate are all maximum values. Based on this, it can be inferred that the frequency response of the thin plate structure including cracks with different horizontal locations shall be not symmetrical about the symcenter. Therefore, whether the crack propagation direction is leftwards or rightwards can be judged by the relative size of the frequency. In the top 4 order frequencies, the 1st and the 2nd order frequencies are special. Specifically, when the horizontal location of the crack is located at 0.5-0.7, the top 2 order frequencies are both minimum (closing to 0.01 Hz). Therefore, for common load, the strength of the thin plate structure at such moment is extremely sensitive to the response of low order frequency, when even small acting force may cause serious damage to the structural strength.
Fig. 14The influence of the horizontal location of the crack on the top 4 order natural frequencies
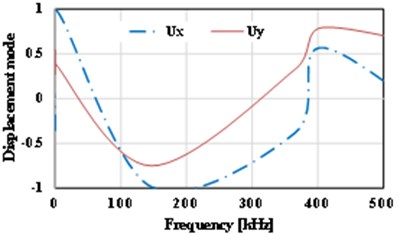
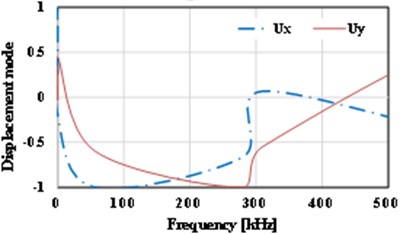
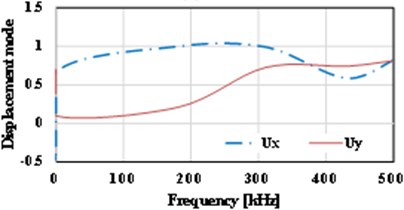
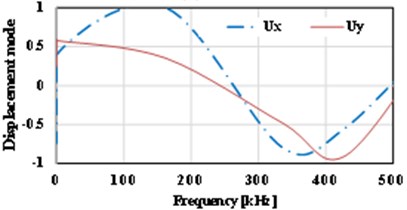
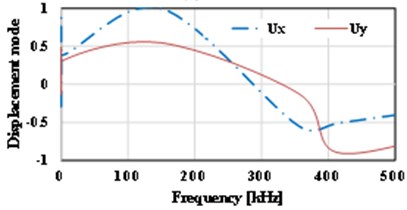
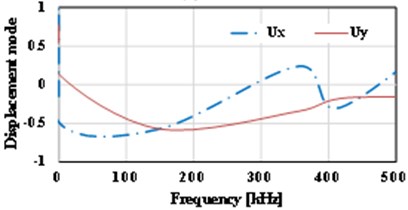
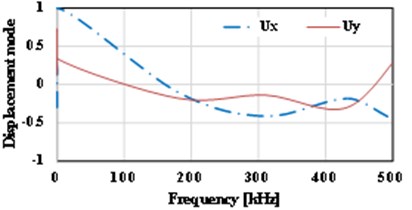
The displacement-frequency change curve of the thin plate with different crack dimensions under vibration is as shown in Fig. 15. It shows that with the increase of frequency of vibration, the displacement of the thin plate structure including initial cracks of different dimensions shows nonlinear change. When the dimension of the initial crack is small ( 0.5), the displacement changes of the thin plate structure can be divided into three stages, i.e., reducing stage, increasing stage and reducing stage, as shown in Fig. 15(a)-(d). For the thin plate with initial cracks of different dimensions in the limited frequency domain (0-500 kHz), with the increase of the dimension of the initial crack, the frequency corresponding to the maximum displacement (negative value) of the vibration will occur drifting and show the change tendency of reducing. Of course, the larger the initial dimension of the crack is, the lower the frequencies of the dangerous exciting loads on the crack will be, which is consistent with the conclusion in fracture mechanics. Meanwhile, it’s easy to find that with the increase of the initial dimension of the crack, the curve of displacement-frequency changes is increasingly unsmooth. It’s notable that when the dimension of the initial crack is larger than a critical value (Fig. 15 shows 0.6), the frequency corresponding to the maximum displacement (positive value) will reduce quickly (about 82 kHz). In addition, according to Fig. 15, apart from the special condition of longitudinal dimension of the crack ( 0.5), the frequencies corresponding to the maximum horizontal displacement () and the maximum longitudinal displacement () are not consistent, and there is large difference between the two directions. Compared with the displacement-frequency characteristics of the thin plate without crack (see Fig. 15(h)), there are more stationary points in the curve of displacement-frequency characteristics of the thin plate structure including initial cracks. The larger the crack dimension is, the more the stationary points will be. Here, it’s easy to understand that the number of the stationary points can reflect the order of the natural frequency.
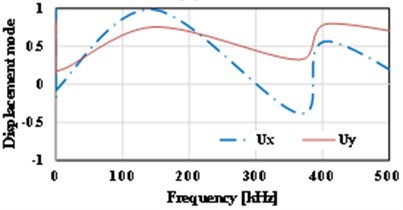
The curve of displacement-frequency changes of the thin plate with different crack locations under vibration is shown in Fig. 16. It shows that the influence of crack location on the curve of displacement-frequency is not as obvious as that of crack dimension. On the whole, it shows that the more the crack location approaches to the two sides of the thin plate, the more smooth the curve of displacement-frequency will be, and the more the crack location approaches to the symcenter of the thin plate, the more stationary points there will be on curve. With the horizontal location as the object, it shows that the change of its negative value is small. Apart from the value that reaches –0.9 when the relative location of the crack is 0.3, other values are approximate –0.5.
Fig. 15Displacement vs. frequency for the various crack sizes
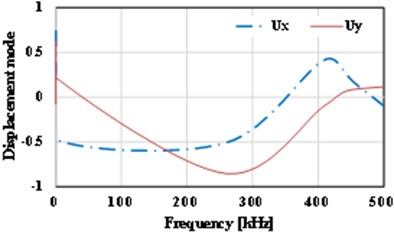
a) 0.1
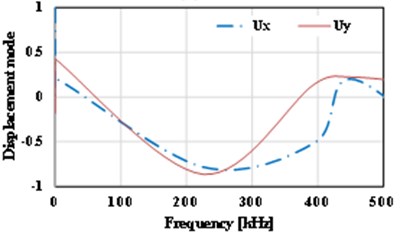
b) 0.4
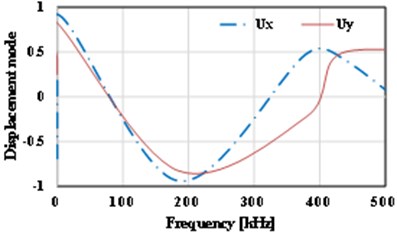
c) 0.3
d) 0.3
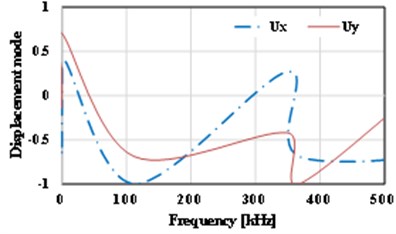
e) 0.4

f) 0.6
g) 0.7
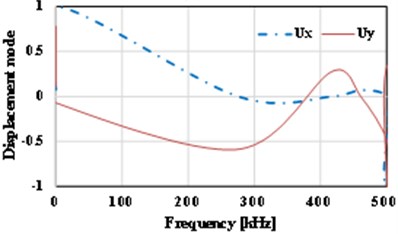
h) 0.8
The positive extreme values can reach 1, and the corresponding frequencies change with the change of the crack locations. Comparison is carried out on the curve of displacement-frequency under different crack locations, which shows that the curves corresponding to different crack locations have unique change tendencies compared with thin plate without crack (Fig. 15 (h)). Based on this, the horizontal location of the crack can be judged by ultrasonic non-destructive test, and it can provide useful information for judging the propagation direction of the cracks.
Fig. 16Displacement vs. frequency for the various locations of initial cracks
a) 0.2
b) 0.3
c) 0.4
d) 0.5
e) 0.6
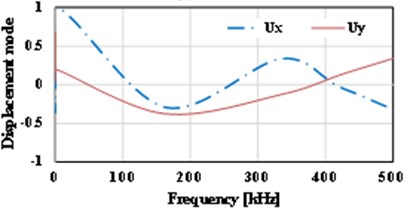
f) 0.7
g) 0.8
5. Conclusions
This paper studies the characteristics of Type I crack propagation of two-dimensional thin plate based on Abaqus software. With the research objects of the flexibility of the thin plate, crack tip plastic zone and crack propagation length etc., we emphasizes on discussing the influences of the relative horizontal location and longitudinal dimension of the initial crack on the propagation of the edge crack. The results show that the initial horizontal location of the crack has a small influence on the crack propagation length, but has an obvious influence on the crack tip plastic zone. The further the initial location of the crack is from the central line of the rectangular plate, the more irregular the crack tip plastic zone will be, and the smaller its area will be. The nearer the initial location of the crack is from the central line of the rectangular plate, the crack tip plastic zone will be distributed axisymmetric with the crack line, and the larger the area of the plastic zone will be. Both the initial longitudinal dimension of the crack and applied loads have obvious non-linear influences on the flexibility of the thin plate, crack propagation length, crack tip plastic zone. Unlike fracture mechanics theories, the shape of the crack tip plastic zone will be consistent with the crack tip plastic zone under plane stress state only when the dimension of the crack is larger than the plate width. In addition, when evaluating the reliability of the thin plate by means of the extended finite element method, selecting different evaluation parameters can obtain more complete and reliable results. In view of the result that may be caused by crack propagation, in this paper, based on the experiment and simulation modal analysis, the influences of the longitudinal dimensions and horizontal locations of the initial cracks on the natural frequencies of the thin plate are discussed, and comparative analysis is carried out on the curve of displacement-frequency corresponding to initial cracks under different conditions. The dimensions and propagation directions of the cracks are identified from the respect of the vibration response of the structure, which provides basis for inspection and control for crack generation and propagation at early stage.
References
-
Holobut P. Fatigue crack growth model for a thin steel plate containing hydrogen. International Journal of Fatigue, Vol. 32, 2010, p. 1895-1903.
-
Giner E., Sukumar N., Denia F. D., Fuenmayor F. J. Extended finite element method for fretting fatigue crack propagation. International Journal of Solids and Structures, Vol. 45, 2008, p. 5675-5687.
-
Sharafisafa M., Nazem M. Application of the distinct element method and the extended finite element method in modelling cracks and coalescence in brittle materials. Computational Materials Science, Vol. 91, 2014, p. 102-121.
-
Meng Q., Wang Z. Extended finite element method for power-law creep crack growth. Engineering Fracture Mechanics, Vol. 127, 2014, p. 148-160.
-
Adharapurapu R. R., Vecchio K. S., Jiang F. C., Rohatgi A. Effects of ductile laminate thickness, volume fraction, and orientation on fatigue-crack propagation in Ti-Al3Ti metal-intermetallic laminate composites. Metallurgical and Materials Transactions a-Physical Metallurgy and Materials Science, Vol. 36A, 2005, p. 1595-1608.
-
Austin T. S. P., Singh M. M., Gregson P. J., Powell P. M. Characterisation of fatigue crack growth and related damage mechanisms in FRP-metal hybrid laminates. Composites Science and Technology, Vol. 68, 2008, p. 1399-1412.
-
Botstein O., Arone R., Shpigler B. Fatigue crack-growth mechanisms in Al-Sic particulate metal matrix composites. Materials Science and Engineering a-Structural Materials Properties Microstructure and Processing, Vol. 128, 1990, p. 15-22.
-
Hadianfard M. J., Mai Y. W. In-situ SEM studies on the effects of particulate reinforcement on fatigue-crack growth-mechanism of aluminum-based metal-matrix composite. Journal of Materials Science, Vol. 30, 1995, p. 5335-5346.
-
Iqbal A. K. M. A., Arai Y., Araki W. Effect of hybrid reinforcement on crack initiation and early propagation mechanisms in cast metal matrix composites during low cycle fatigue. Materials and Design, Vol. 45, 2013, p. 241-252.
-
Zhao J. F., Zhou J. Z., Huang S., Jiang S. Q., Fan Y. J. Numerical simulation on fatigue crack growth of metal sheet induced by laser shot peening. International Journal of Modern Physics B, Vol. 23, 2009, p. 1646-1651.
-
Pavlou D. G. The influence of the crack tip plastic zone strain hardening on the metal high cycle fatigue behavior. Structures under Shock and Impact V, Vol. 2, 1998, p. 633-647.
-
Cui J. G., Ma J. S., Fu Y. H., Li N., Sun J., He J. W. Fatigue crack propagation in explosive bonded LY12/20g double-layer metal laminate I. Face-crack. Acta Metallurgica Sinica, Vol. 37, 2001, p. 1261-1265.
-
Li K., Chudnovsky A., Kin Y., Macheret J. Experimental investigation of fatigue-crack growth-behavior and damage mechanisms of fiber metal laminates under uniaxial and biaxial loading. Polymer Composites, Vol. 16, 1995, p. 52-59.
-
Jin L. A., Yang Q. X., Liu S. Z., Zhang C. A., Li P. Electromagnetic stimulation of the acoustic emission for fatigue crack detection of the sheet metal. IEEE Transactions on Applied Superconductivity, Vol. 20, 2010, p. 1848-1851.
-
Agarwalla D. K., Parhi D. R. Effect of crack on modal parameters of a cantilever beam subjected to vibration. Procedia Engineering, Vol. 51, 2013, p. 665-669.
-
El-Kafrawy A. Crack detection by modal analysis in 3D beams based on FEM. International Journal of Mechanics and Materials in Design, Vol. 7, 2011, p. 265-282.
-
Kim B. J., Shin H. A. S., Jung S. Y., Cho Y., Kraft O., Choi I. S., Joo Y. C. Crack nucleation during mechanical fatigue in thin metal films on flexible substrates. Acta Materialia, Vol. 61, 2013, p. 3473-3481.
About this article

The financial support of this work is provided by Jilin Province Science and Technology Development Project (20130206007NY).
