Abstract
Structural vibration response under ambient excitation is a stochastic process. The change in the characteristics of stochastic process can be used to evaluate the state of structure. Jensen-Shannon Divergence (JSD) is a mathematical expression widely used in time series analysis to account for the similarity of measurements. The aim of this article is to extend the JSD index, in conjunction with the Natural Excitation Technique, phase space reconstruction and singular value decomposition, for detecting damage in structures at an early stage. A simulation on the ASCE Benchmark structure with various damage scenarios and a laboratory experiment for a truss-type structure are carried out to validate the proposed JSD damage index. Both numerical and experimental results show that the proposed approach has better performance in contrast to other existing similar damage index such as Cross-entropy, and no mathematical model of the analyzed structure is required a priori.
1. Introduction
During the service of civil structures such as large-scale frames, long-span bridges and high-rise buildings, local damage of their critical locations may gradually accumulate, and finally results in structural failure. Therefore, the ability to detect damage in civil structures is becoming increasingly important and, as a consequence, wide variety of nondestructive evaluation methods is being developed.
Model-based damage detection methods [1, 2] depend on the accuracy of the mathematical model of healthy structure and the dynamic parameters of damaged structure. For large structures, due to the structural complexity and limitation of testing technologies, it is difficult to build accurate mathematical models of structures. Hence, the dynamic parameters of structures often contain certain errors, making the validity of these methods inaccurate [3].
Vibration-based damage detection methods [4-6] are generally realized as extracting damage features from the vibration responses of structure, and then judging the state of structure according to change of damage features. Feature selection is important to the result of structural damage diagnosis. Common damage features include natural frequency, modal shape, modal damping and other modal parameters. Although the vibration-based methods have been intensively studied and adopted for the purposes of structural health monitoring, they still pose a number of challenges in practical application, mainly due to the lack of sensitivity to local damages in structures.
Structural damage affects the dynamic properties of a structure, resulting in a change in the statistical characteristics of the measured acceleration time histories. Thus, damage detection can be performed using time series analysis of vibration signals measured from a structure before and after damage [7-9].
The structural response under operating conditions is a stochastic process [10]. Distribution function obtained from response can describe the statistical characteristics of the random process. The most simple statistical parameter of distribution function is the moment, such as variance [11] (second moment), standard deviation etc. But studies show that the moment method is only applicable to the Gaussian distribution, and there are no clear relations between the moment and variable uncertainty in the case of non-Gaussian distribution. In addition, structures are easily influenced by external excitations, randomness of the environment, and structural nonlinearity. As a result, the distribution function of vibration response is uncertain. Characterization of the statistical properties through the information entropy is an effective way to measure the average uncertainty, which is applicable for any kind of distribution. Li [12] proposed a damage index based on the cross-entropy, combined with the techniques of phase space reconstruction and singular value decomposition. The cross-entropy has been validated for structural damage detection under ambient excitations.
Since initially proposed and used to measure the difference between the probability distribution [13, 14] in 1991, the Jensen-Shannon Divergence (JSD) has been widely used in analysis of symbol sequence and feature description, such as pattern recognition [15-18], etc. JSD is mainly derived from the Kullback-Leibler Divergence (KLD). In fact, JSD is a result of symmetrization and smoothing of the KLD [13, 16]. Non-negativity, symmetry, continuity, boundedness, and other features making JSD widely adopted in the analysis of time-series data. However, it has not yet been applied in the field of structural damage diagnosis.
In this study, the JSD is extended to analyze acceleration time history for structural damage diagnosis. With this aim, the Natural Excitation Technique (NExT) and Phase Space Reconstruction (PSR) are combined together and used for damage diagnosis of structures.
This paper is organized as follows. Section 2 presents a brief background introduction of the NExT, PSR and JSD techniques. In Section 3, a numerical simulation is conducted on the ASCE benchmark structure, and damage diagnosis results using JSD index are discussed. In Section 4, the proposed JSD damage index is applied on a laboratory steel truss model for experimental investigation. At last, concluding remarks are summarized in Section 6.
2. Theoretic background
In this study, the NExT method is used to obtain the impulse response function of measured time history from white noise excitations. Then, the concept of phase space reconstruction of response system is presented, followed by the JSD index derivation.
2.1. The NExT method
The NExT has been extensively utilized for the modal analysis of structures. The underlying theory for the NExT is that the cross-correlation function of output data for a system subjected to Gaussian white noise excitation and impulse response function have similar mathematical expression [19]. This means that impulse response can be replaced by response of correlation function.
Assuming the external excitation is white noise, the response signal of point and point is and , respectively. Then, the correlation function of these two points in terms of time lag can be written as:
In Eq. (1), the superscript is the particular mode from a total of modes, is th ordinate of the th mode shape, is the th modal mass, is the constant associated with response at node , and are the th mode damping ratio and natural frequency, is the th mode damped natural frequency, and is the phase angle associated with the th modal response, respectively. The total number of correlation functions corresponding to a particular time lag is . The Markov parameter , representing impulse response, is composed of those correlation functions as:
2.2. Phase space reconstruction
The responses obtained by NExT can be extended to three-dimensional or higher dimensional spaces to make the information contained in acceleration time series fully revealed, which is called phase space reconstruction. Phase space is determined by two factors, the delay time and the embedding dimension. Phase space reconstruction is to project the original system space to an embedded dimension space. The false neighbor method [20] is used in this study to determine the embedding dimension. In the process of phase space reconstruction, two scattered points in a space become adjacent points on their projection plane, resulting in false neighbor points. Too small dimension may lead to many false neighbor points. When phase space dimension increases, the false neighbor points are gradually converged, then the embedded dimension can be determined.
If the sequence of discrete response are , ,…, , assuming that the embedding dimension is and the delay time is , is an integer multiple of . After the delay extended phase space reconstruction, the th vector can be expressed as:
in which, and phase space can be expressed as . Through singular value decomposition, we can obtain singular values from . These singular values constitute the singular spectrum of this time series. The number of singular values is related to the original system, and represents the number of different patterns each column of the singular values matrix contain, which demonstrates that singular spectrum can be seen as a signal division of a time series.
2.3. Jensen-Shannon divergence (JSD)
For an uncertainty system, we define its state characteristic with a random variable . For a discrete random variable, set ( 2), and the corresponding probability of each value in which and 1. Then the information entropy is: . If two different discrete random variables are and , and their corresponding probability density functions are and , respectively. Then the KLD of and can be defined as: . Based on the information entropy and KLD formula, the JSD is defined as:
where and are the random weight of and . , and . In this paper, we chose .
JSD can be used to detect the difference of two separate time series which is an ideal index for structural damage identification. First, use the NExT to obtain the impulse response function of acceleration data which is replaced by the response of correlation function. After phase space reconstruction we get the new impulse response function matrix which can make the information contained in acceleration time series fully revealed, such as matrix for undamaged structure and matrix for damaged structure mentioned before. Then after singular value decomposition of matrix and matrix , we can obtain singular values and from and , respectively. Set and , in which is the number of singular value. Then, we can calculate the JSD using the undamaged structural probability distribution and the damaged structural probability distribution .
JSD is able to reflect the difference of probability distribution from two separate time series, i.e., the undamaged structure and damaged structure, and can be regarded as a damage index for structural damage identification. In the situation that equals to , namely structural damage does not occur, the JSD value of two different time series will close to zero. Alternatively, the JSD value can become a positive value when structure subjected to damages. However, JSD value is always less than 1.
3. Numerical simulation
According to the calculation procedure established above, JSD of two acceleration time series measured from a structure before and after damage, is able to be obtained to determine damage location and extent, which provides a new index for structural damage diagnosis. In this section, the proposed JSD index is numerically validated through a simulation on the ASCE benchmark structure [21].
3.1. ASCE benchmark structure
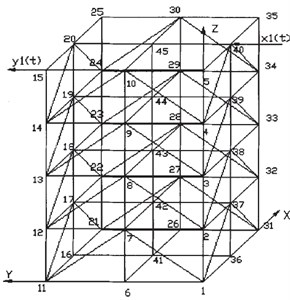
The structure shown in Fig. 1 is a benchmark model of the American Society of Civil Engineers (ASCE) proposed for evaluating various proposed damage detection methods. It is a four-layer model structure of steel frame, at the scale of 2 cross by 2 cross, with the plane size 2.5 m×2.5 m, height 3.6 m, and each side having eight bracings. Fig. 2 shows the schematic diagram of the benchmark model with node numbering. The structural damage patterns are devoted to local stiffness loss. This study investigates three kinds of damage scenarios defined as follows:
Case 1: No stiffness in the braces of the first story (i.e., the braces still contribute mass, but provide no resistance within the structure);
Case 2: No stiffness in one brace in the first story (between node 27 and 31);
Case 3: No stiffness in one brace in the first story (between nodes 27 and 31 nodes), and in one brace in the third story (between node 29 and 33).
Fig. 1Benchmark model
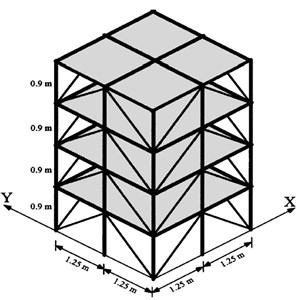
Fig. 2Node numbering
The model is instrumented with 4 accelerometers at each floor. In this study, only ambient vibration data in -direction are used to verify the proposed approach in this study. Ambient force is simulated by generating a filtered Gaussian white noise wave and applied on the model in -direction. Sampling frequency is 5000 Hz and sampling time 5 seconds. One typical set of measurements is shown in Fig. 3.
Fig. 3Typical acceleration time histories of benchmark model under different damage scenarios
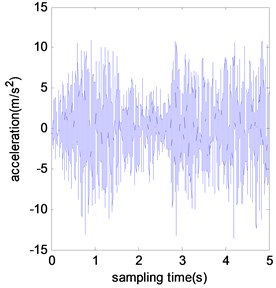
a) No damage
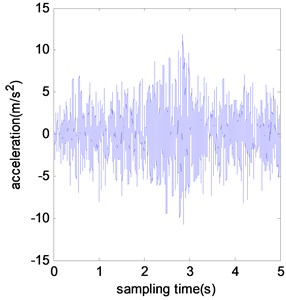
b) Damage case 1
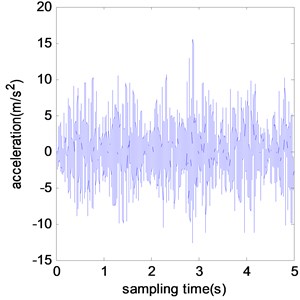
c) Damage case 2
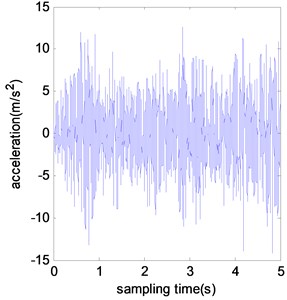
d) Damage case 3
Fig. 4Time delay results of phase space reconstruction under different damage scenarios (τ= 1/5000 s)
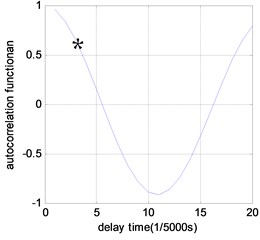
a) No damage
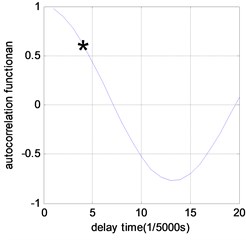
b) Damage case 1
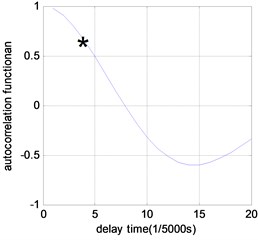
c) Damage case 2
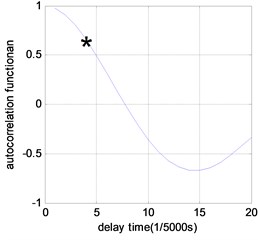
d) Damage case 3
After the acceleration data of benchmark model are collected for the undamaged and damaged scenarios, they are analyzed through above procedure to compute JSD. Autocorrelation function is used to determine the best time delay for acceleration signal phase space reconstruction. The delay interval used here is 1/5000 s. Fig. 4 shows the analysis results of time delay for different damage scenarios. It can be observed that the best time delay is 3 for undamaged case, and 4 for all other damaged cases.
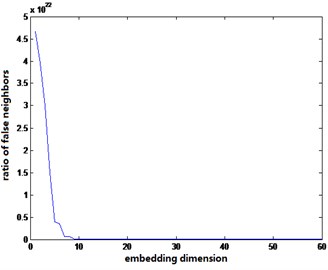
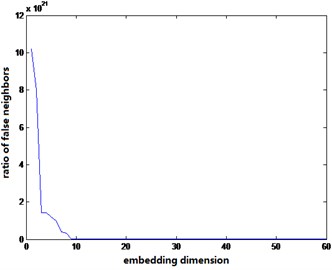
Fig. 5 shows the embedding dimensionality of intact and three damage cases after acceleration signal phase space reconstruction. It is observed the number of false neighbor points is close to convergence when the embedding dimension is about 20 to 60. Therefore, choosing embedding dimension 20, the dynamic characteristics of the original response system can be well expressed.
Fig. 5Embedding dimension determined by false neighbor method under different conditions
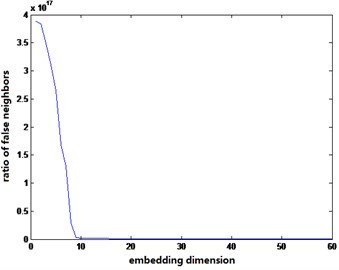
a) No damage
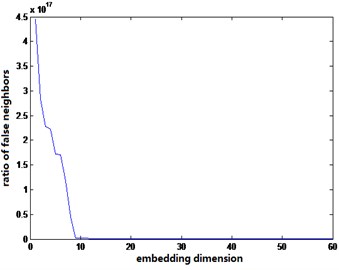
b) Damage case 1
c) Damage case 2
d) Damage case 3
Fig. 6Effect of noise on the singular spectrum
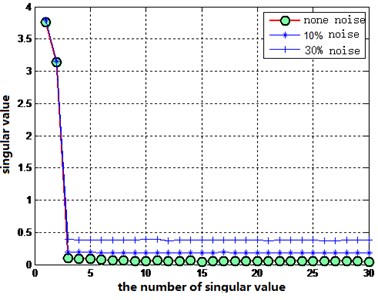
a) Without noise reduction
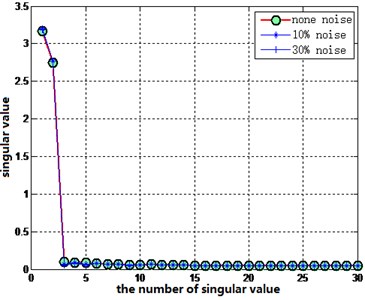
b) After SVD noise reduction
3.2. Noise reduction on the singular spectrum
It can be seen from Eq. (4) that only the singular spectrum value affects the size of JSD, so we only need to investigate the influence of noise on the singular spectrum. Fig. 6 shows the noise influence on the distribution of singular values of undamaged scenario, by adding 10 % and 30 % white noise into the acceleration time history. Then, the singular value noise reduction technique [22] is used. The result is shown in Fig. 6. It can be seen that the noise influence is well reduced.
3.3. Damage diagnosis results using JSD
Considering the embedding dimension 20-60, the JSD for the three damaged scenarios are obtained after phase space reconstruction and SVD. For comparison, existing index, the cross entropy [12] is added as shown in Fig. 7. Cross entropy has already been used as an efficient damage index in many time series analysis literatures. It is observed that JSD index is much stable than cross entropy with the variation of embedding dimensions of phase space, namely the amount of singular values. Fig. 7 highlights that the JSD is a better and more reliable damage index.
Fig. 7Damage diagnosis of benchmark model using JSD and Cross-Entropy under different embedding dimensions
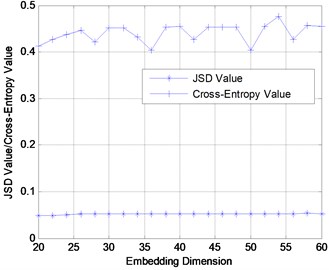
a) Damage case 1
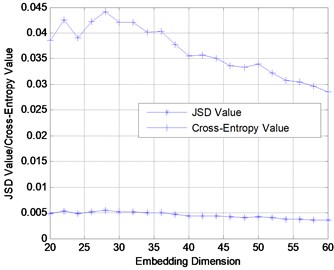
b) Damage case 2
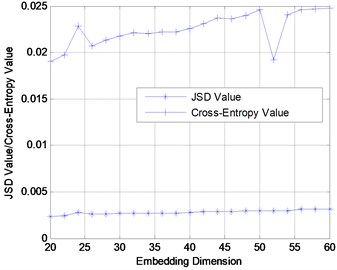
c) Damage case 3
4. Experimental validation
4.1. Description of the experiment setup
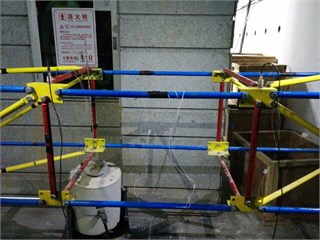
A truss-type structure model is constructed in laboratory to verify the proposed method. The test structure is a steel truss with 14 bays, as shown in Fig. 8(a). Each bay is 585 mm long, 490 mm wide, and 350 mm high. Totally, the steel truss has 52 longitudinal rods, 50 crosswise rods, and 54 diagonal rods. Each rod is forged with steel pipe. The section of the rods is hollow circular with an outer diameter of 18 mm, and inner diameter of 12 mm. Rods are bolted on gusset plates made of equilateral angle steel.
Excitation is provided by a vibration exciter applied at the location of Bay 6 underneath a bottom node. Ten Force-balance accelerometers and corresponding data acquisition systems are used to measure dynamic responses, as shown in Fig. 8(b). In all scenarios, time histories of the acceleration responses are recorded for 5 min with a sampling frequency of 1000 Hz. One typical set of time history acceleration measurements from the data acquisition interface is shown in as shown in Fig. 8(c).
Fig. 8Test setup
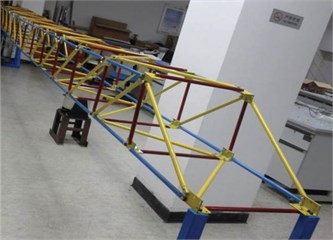
a) Test structure
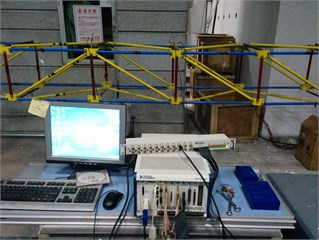
b) Test equipment
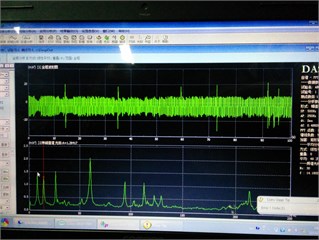
c) Data acquisition interface
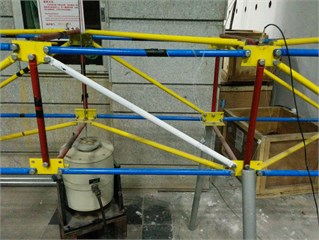
d) Damage case 1
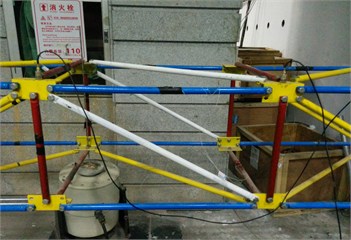
e) Damage case 3
f) Damage case 4
Table 1Configuration of the damage scenarios
Damage scenarios | Damage location | |
Case 1 | Intact | Bay 6 |
Case 2 | One diagonal rod replaced by one thinner rod | Bay 6 |
Case 3 | Three diagonal rods replaced by three thinner rods | Bay 6 |
Case 4 | Remove all the diagonal rods | Bay 6 |
4.2. Damage scenarios
The structure is tested in four states: the undamaged state and three damaged states, which are given in Table 1. The truss is first tested without any damage as ‘Case 0’. Afterward, the diagonal rods are replaced by 2 mm thick rods in white color at Bay 6 as shown in Fig. 7(a) and (b), with a number of 1 and 3 rods, corresponding to ‘Case 1’ and ‘Case 2’, respectively. In ‘Case 3’, all diagonal rods are removed at Bay 6, as shown in Fig. 8(d), (e), and (f).
4.3. Damage diagnosis using JSD
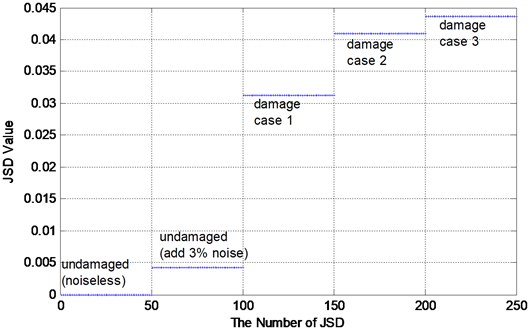
To investigate the stability of using JSD index on structural damage diagnosis, previous analyses are repeated by calculating the JSD values for 50 segments of acceleration time history in each case. Fig. 9 shows the statistical JSD values with the embedding dimension of each segment corresponding to the different damage scenarios. Each data set contains 5000 data points. The average JSD values and corresponding variations for damage case 1, 2, and 3 are 0.0508, , , , , , respectively, as listed in Table 2. There is a clear sign that there has been a change at different damage scenarios. Therefore, the damage for benchmark model is successfully identified and located by using ambient vibration data with the JSD index. Note that Fig. 9 also shows the JSD index has excellent robust performance in structural damage diagnosis. It is observed that JSD values of all damage scenarios can be clearly distinguished from that of undamaged case added 3 % noise influence.
Fig. 9JSD of truss model in three damage scenarios
As shown, JSD is a sensitive and stable index to structural damage. Moreover, through alternating the measurement points and excitation locations, it is found that JSD values at any measurement point on the benchmark model all change with structural damage irrespective of the damage location and excitation location. These characteristics make the JSD index superior than modal-based indices in identifying damage existence and a sound index for continuous online structural health monitoring.
Table 2Statistical features of 50 JSD segments under different damage scenarios
Statistical features | Undamaged (noiseless) | Undamaged (add 3 % noise) | Damage case 1 | Damaged case 2 | Damaged case 3 |
Average | 0 | 0.0042 | 0.0313 | 0.0409 | 0.0436 |
Variance | 0 | 0.000022 | 0.000267 | 0.000320 | 0.000251 |
5. Conclusions
In this paper, a new damage index in time series, JSD, is proposed based on the techniques of NExT, phase space reconstruction and singular value decomposition. JSD can be directly extracted from vibration responses under ambient loads, avoid applying external forces on structure and save cost. Compared to existing cross-entropy index, the effectiveness and robustness of JSD index have been verified through a numerical simulation on the ASCE benchmark model and a laboratory experiment. It should be pointed out however that the damage diagnosis method considered here is based on structural acceleration time history, which has no direct relation with structural parameters and insensitive to local damage. If accurate detection of damage location and extent are required, then a threshold from a baseline condition would be needed. Deviation from that threshold can be considered as a change and possible damage to be investigated further. This is one of the tracks to follow in the future.
References
-
Han J., Zheng P.,Wang H. Structural modal parameter identification and damage diagnosis based on Hilbert-Huang transform. Earthquake Engineering and Engineering Vibration, Vol. 13, Issue 1, 2014, p. 101-111.
-
Yang X. S., Yan W. M., Chen Y. J., et al. Damage detection method for long span cable-stayed bridge based on model updating. Journal of Vibration, Measurement and Diagnosis, 2012.
-
Perkins N. C. Modal interactions in the non-1inear response of elastic cables under parametric/external excitation. Non-Linear Mechanics, Vol. 27, Issue 2, 1992, p. 233-250.
-
Trendafilova I. Vibration-based damage detection in structures using time series analysis. Proceedings of the Institution of Mechanical Engineers, Part C: Journal of Mechanical Engineering Science, Vol. 220, 2006, p. 261-272.
-
Yin X. Z., Na T. Vibration-based damage diagnosis research on offshore platform. Journal of Zhejiang Water Conservancy and Hydropower College, 2009.
-
Lilien J. L., Pinto D. C. A. Vibration amplitudes caused by parametric excitation of cable stayed structures. Journal of Sound and Vibration, Vol. 174, Issue 1, 1994, p. 69-90.
-
Gao F., Lu Y. A Kalman-filter based time-domain analysis for structural damage diagnosis with noisy signals. Journal of Sound and Vibration, Vol. 297, Issues 3-5, 2006, p. 916-930.
-
Lei Y., et al. Structural damage detection with limited input and output measurement signals. Mechanical Systems and Signal Processing, Vol. 28, 2012, p. 229-243.
-
Lu Y., Gao F. A novel time-domain auto-regressive model for structural damage diagnosis. Journal of Sound and Vibration, Vol. 283, Issues 3-5, 2005, p. 1031-1049.
-
Zhao Y., Chi B. B. Identification Method of Structural Modal Parameter under Ambient Excitation. The World of Building Materials, 2009.
-
Georgakis C., Taylor C. A. Nonlinear dynamics of cable stays. Part 1: Sinusoidal cable support excitation. Journal of Sound and Vibration, Vol. 281, 2005, p. 537-564.
-
Li R., Yu D. J., Zeng W. A method of structure damage diagnosis based on singular-spectrum cross entropy under ambient excitation. Engineering Mechanics, Vol. 24, Issue 6, 2006.
-
Zhang J. X., Xu Z. Y., Zhao X. B. Study on the methods for finding borders between coding and noncoding DNA regions. China Journal of Bioinformatics, Vol. 8, Issue 2, 2010, p. 110-113.
-
Sun G. L. Wenxinkeli treatment of sinus bradycardia associated with the dinical observation of premature ventricular contractions. China Journal of Modern Drug Application, Vol. 6, Issue 11, 2012, p. 21-22.
-
Bian Y. The observation of mechanism of paroxysmal atrial fibrillation by dynamic electrocardiogram. Journal of Modern Electrophysiology, Vol. 18, Issue 2, 2011, p. 91-93.
-
Sun R. R., Wang Y. Y., Fang Z. X. Atrial arrhythmia recognition based on grey correlation and K-nearest neighbor. Space Medicine and Medical Engineering, Vol. 20, Issue 3, 2007, p. 193-197.
-
Xu H., Meng H., Wang J. Complexity analysis of pathological ECG signal basedon Jensen-Shannon divergence. Beijing Biomedical Engineering, Vol. 31, Issue 6, 2012.
-
Yao Z. J., Liu J. T., Lai Z. T., Liu W. Y. An improved Jensen-Shannon divergence based spatiogram similarity measure for object tracking. Acta Automatica Sinica, Vol. 37, Issue 12, 2011.
-
James G. H., Carne T. G., Lauffer J. P. The natural excitation technique (NExT) for modal parameter extraction from operating wind turbines. Unknown, 1993.
-
Research on Identification of Nonlinear Behavior and Fault of Rub-Impact in Rotors. National University of Defence Technology, Changsha, 2001.
-
Jiang S. F. Structural Optimization and Damage Detection. Science Press, Beijing, 2002.
-
Alonso F. J., Castillo J. M. D., Pintado P. Smoothing of raw kinematic signals. Journal of Biomechanics, Vol. 38, 2005, p. 1085-1092.
About this article

This work is financially supported by the National Key Technology R&D Program (Grant No. 2014BAL05B06), Guangdong Major Science and Technology Plan (Grant No. 2012A080104014), Shenzhen Overseas Talents Project (Grant No. KQCX20120802140634893), and the authors are grateful to the authorities for their support.
