Abstract
A combination of kurtogram and independent component analysis (ICA) is proposed in this paper to identify the faults of rolling element bearings (REBs) and gears existing simultaneously in a gearbox. In the proposed scheme, multi-channel vibrations are picked up from the gearbox at first. Then, the fast kurtogram algorithm is employed to extract the envelopes of each vibration from different channels. Subsequently, the envelopes are separated by an ICA algorithm into independent envelope components according to different sources. Finally, the characteristic frequencies of both the faulty REB and the faulty gear can be exposed simultaneously in the envelope spectral plots. A simulation and an experimental test are introduced to show the effectiveness of the proposed method.
1. Introduction
Envelope analysis or high-frequency resonance technique [1] has been widely employed for the identification of local faults in rolling element bearings (REBs) and gears at early stages for more than 30 years.
However, in some harsh conditions, more than one fault of REBs and gears exist simultaneously in a gearbox, and one of these faults generates much stronger vibration. In this case, only the characteristic frequencies of the stronger vibration can be found, and that of the others may be missed by using conventional envelope analysis. Extracting and exposing the most of characteristic information contained in the acquired vibration from a gearbox for faults diagnosis and condition monitoring is with significant importance. To address above issue, a combination of kurtogram and independent component analysis (ICA) is proposed in this paper to identify the incipient faults of REBs and gears existing simultaneously in a gearbox.
The paper is arranged as follows. Firstly, the briefs on the kurtogram and the ICA principles will be introduced in Section 2 and Section 3, respectively. Then, the proposed scheme will be presented in Section 4. A simulation and an experimental test on a gearbox test rig will be investigated and shown in Section 5 and conclusions will be drawn in Section 6.
2. Brief on kurtogram
2.1. Introduction on envelope analysis
In theory, the envelope analysis can be explained as that the rolling elements of REBs or the meshing of gears strike a local fault. It introduces a short duration impact. Due to the impulsive feature, even the weak vibration from the incipient faults of REBs or gears can lead to some high-frequency resonances of local structures in the rotating machinery, so that bearings, bearing houses, and sensors etc. can be excited. In signal processing field, the high-frequency resonance responses can be considered as high-frequency carriers (with resonance frequencies, respectively) that are modulated by the weak vibrations. On running condition of rotating machinery, the vibration from gearboxes with local faults includes the quasi-periodic or periodic impulsive trains generated by faulty REBs or gears. If the impulsive trains included in the vibration can be separated by a band-pass filter in a suitable high-frequency band for isolating most low-frequency disturbances in the gearboxes, the envelopes of the impulsive trains can be obtained by one of popular demodulation algorithms; and then the characteristic frequencies or the periods related to the local faults can be calculated from the envelopes by envelope spectra analysis schemes.
2.2. Envelope extraction based on kurtogram
Several demodulation approaches can be employed for the envelope extraction, for instance, the Hilbert transform [2], the wavelet transform [3] and the kurtogram [4]. It is worth mentioning that the newly developed kurtogram method takes the advantage of determining the optimal demodulation frequency band adaptively for the band-pass filtering and the fast kurtogram algorithm [4], which can be calculated efficiently. Thus it will be utilized in our study. A brief introduction of the kurtogram is introduced as follows.
A higher spectral kurtosis (SK) value means stronger impulsive components contained in the corresponding frequency band. Then, SK can be used as an indicator to locate the frequency band that includes the most impulsive components and to determine the optimal demodulation band for the envelope extraction. There are various versions of the SK, the new one developed by Antoni [4] is widely recognized and applied in applications. The SK is defined as in [4] by:
where is the time-frequency complex envelope of the band-pass filtered signal at a center frequency , and can be calculated by the fast kurtogram algorithm. It should be noted that from the viewpoint of a band-pass filter, the SK can be explained as the function of the center frequency and the bandwidth . The determination of the optimal combination (, ) leads to the so-called kurtogram. The fast kurtogram algorithm realizes the selection of the optimal demodulation frequency band by designing a tree-like multi-rate filter-bank structure with quasi-analytic band-pass filters, where the filter banks at different levels are composed by binary or 1/3-binary filter structures. The schematic of the binary filter structure is shown in Fig. 1.
Fig. 1Schematic of the binary frequency/frequency resolution plane of the fast kurtogram
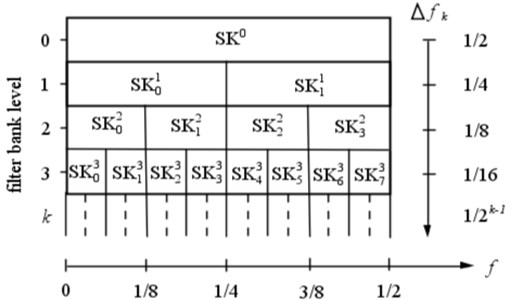
The detailed instruction of the fast kurtogram algorithm can be found in [4]. The filtered sequence with the maximum SK value is determined as the envelope extraction result, and the corresponding combination (, ) is the corresponding optimal filtering parameters. The step can be expressed by:
where and denote the optimal center frequency and the optimal bandwidth, respectively, is the optimal complex envelope, the notion ‘’ represents to obtain the parameters pertaining to the SK’s maximum value. Then, the optimal envelope is determined.
3. Instruction on ICA
3.1. Brief on ICA
As well known, the can be used to separate the observed mixtures into different independent components (ICs) according to the different statistical properties of sources. The simplest linear noiseless model of the ICA can be expressed as:
where denotes an observed -dimensional vector, , the element with 1, …, denotes the th observed mixture; represents an -dimensional random vector, , the element with 1, …, represents the th independent component or original source, i.e., the IC; is an × mixing matrix, and its element for 1, …, ; 1, …, is determined by the transfer path between the th sensor and the th source. According to the principles of matrix operations, if and can be obtained, the original sources or ICs can be obtained by:
where is called the separating matrix, is the inverse of matrix .
3.2. Further discussion on ICA
In vibration analysis, the observed vector can be obtained directly from a multi-channel synchronous acquisition by sensors, and the data from each channel represents an element (mixture) of . Generally, the matrix is not obvious and the solution for may not exist, but the ICA is able to estimate the separating transfer matrix based on the statistical properties of the element in the vector . Once is obtained, the vector can be calculated by Eq. (4). It is worth pointing out that there are two key constraints on utilizing the separability of the popular algorithms. Firstly, the dimension of independent components is required to be not more than the number of the observed vectors viz. in the standard ICA algorithms. Secondly, the independent component must have non-Gaussian distributions (at most one of the sources is Gaussian). Please refer to [5] for more details about the ICA.
4. Combination of kurtogram and ICA
4.1. Difficulty on gearbox faults identification at early stage
As aforementioned, if several REBs and gears faults exist simultaneously in a gearbox, then one of these faults corresponds to a stronger vibration level. The results from conventional envelope analysis often miss the characteristic frequencies of the weaker impulsive trains from incipient faults of REBs or gears. To address this issue, some schemes have been proposed such as the discrete/random separation (DRS) [6] and the cepstral editing procedure (CEP) [7]. In this paper, a new approach is proposed and introduced in next subsection.
4.2. Envelope separation scheme
Envelope analysis is a powerful tool for obtaining the characteristic frequencies of weak impulse trains generated by incipient faults of REBs and gears in gearboxes, and the is a novel method for its separation ability based on the observed mixtures. Intuitively, the combination of envelope and the ICA should contribute to obtain the characteristic frequencies from a gearbox where multiple faulty sources exist simultaneously. Inspired by this idea, this study has been investigated. The main steps of the proposed scheme are listed as follows.
1) Multi-channel data acquisition. The observed vibrations are synchronously acquired from a gearbox by the sensors (three piezoelectric acceleration sensors are employed in our study).
2) Envelopes extraction. The kurtogram scheme is utilized for the envelopes extraction. The envelope from each channel is extracted, respectively. It is worth mentioning that after this step, the strong noise beyond the demodulation frequency band is isolated and the incipient faults related impulsive components are enhanced.
3) Envelope ICs separation. As aforementioned, in the conditions where more than one fault of rolling element bearings (REBs) and gears exist simultaneously in a gearbox, the conventional envelope analysis may be invalid. To address this issue, the ICA is employed to separate the envelope mixtures according to the natural properties of the sources. After this operation, the faults related envelope mixtures from different sources in the same gearbox can be separated into different envelope ICs, which are corresponding to different sources, such as the faulty REB, the faulty gear and disturbances etc.
4) Squared envelope spectrum analysis. The squared spectrum analysis is applied to each envelope IC, and the corresponding characteristic frequencies can be exposed clearly for the diagnosis of the gearbox.
5. Experimental verification
To verify the introduced method, simulations and experimental tests have been carried out in our study. The results validate the proposed approach positively. A simulation and a test on a gearbox are introduced in the following subsections.
5.1. Simulation
Firstly, the vibration sources in the gearbox are simulated, which include the impulse trains generated by a faulty REB and a faulty gear respectively, the shaft related low-frequency harmonics, the gear mesh vibration and a Gauss noise.
A single impulsive response for simulating the vibration generated by a REB with a single local fault is given by:
where is the impulsive response, 8,000 Hz denotes a resonant frequency of the system, the constants 0.05 and 500 are the amplitude and the damping coefficient of the response respectively. Then, we repeat the 92 times per second (92 Hz) to simulate the impulse train generated by the faulty REB. In the same way, an impulsive response for simulating a gear with a single local fault is generated, which is defined by:
where is the impulsive response, the constant 0.5 defines the initial phase of the response respectively. Then, by repeating the 13 times per second viz. setting the shaft rotating frequency 13 Hz, one can simulate the periodic vibration generated by the faulty gear. The shaft related harmonic vibration is given by:
where denotes the harmonic vibration. The gear mesh vibration is given as in [8] by:
where denotes the gear mesh vibration, is the gear mesh frequency, , , and are the amplitude, the initial phase, the amplitude modulation function and the phase modulation function of the th harmonic of the mesh vibration respectively. In the study, we assume that 413 Hz and the mesh vibration includes 3 harmonics, 3, and let:
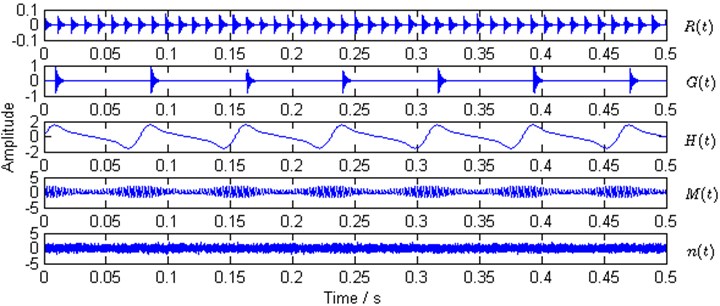
The Gauss white noise is simulated with power spectral density (PSD) –5 dB. Then, the sources in the gearbox are simulated, , which include five different sources. By setting the sampling rate as 40,960 Hz, the waveforms of the five simulated different sources are shown in Fig. 2 respectively.
Fig. 2Waveforms of simulation sources
Secondly, Eq. (3) is used to generate the observed mixtures by setting the values of the elements in the matrix randomly. In this study, three simulated vibrations are generated by:
The waveforms of the observed mixtures are shown in Fig. 3. Then one of the observed mixtures ( is selected in the study) is used to calculate the kurtogram by the fast kurtogram algorithm [4] for obtaining the optimal demodulation band in envelope analysis according to Eq. (2). The kurtogram is shown in Fig. 4.
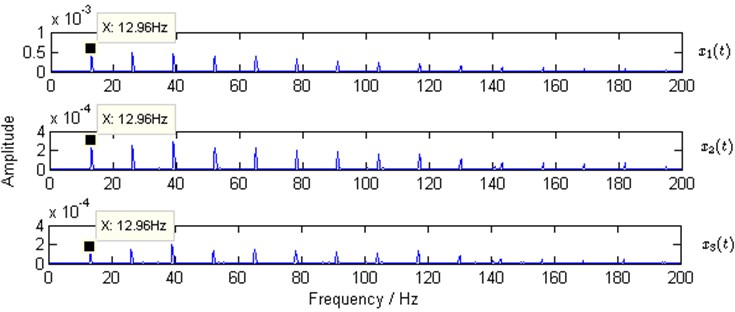
In Fig. 4, the optimal band (,) determined by the kurtogram is (8,000 Hz, 213.33 Hz). The center frequency (8,000 Hz) for the band-pass filtering in envelope analysis is consistent with the setting resonant frequency (8000 Hz) in Eq. (5) and Eq. (6). Consequently, the envelopes of , and are extracted respectively, and the squared envelope spectra are shown in Fig. 5. It is clear that the setting characteristic frequency 13 Hz (12.96 Hz in Fig. 5) of the simulated faulty gear and its harmonics are all exposed. However the characteristic frequency of the simulated faulty REB is missed.
Fig. 3Waveforms of simulated observed mixtures
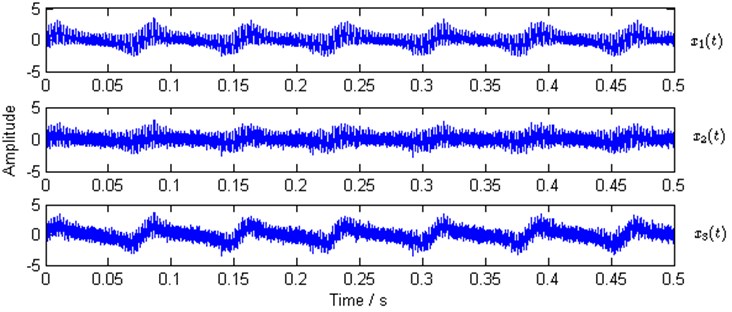
Fig. 4Kurtogram of x1(t), (SKmax=1.2 at level 6.5, ∆fo= 213.33, fo= 8000 Hz)
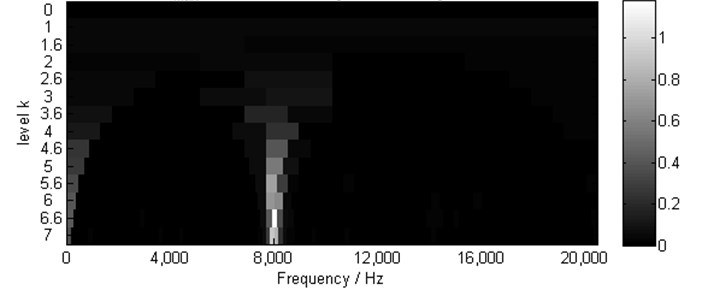
Fig. 5Squared envelope spectra of simulated observed mixtures
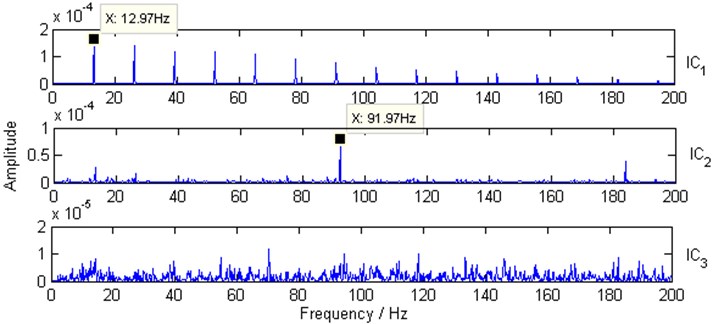
By utilizing the proposed method, the three envelopes are separated into three envelope ICs by the fastICA algorithm [5] at first, then the squared envelope spectra of envelope ICs are calculated. The results are shown in Fig. 6.
The characteristic frequency of the simulated faulty gear 13 Hz (12.97 Hz in Fig. 6) and the characteristic frequency of the simulated faulty REB 92 Hz (91.97 Hz in Fig. 6) are clearly identified in the spectra corresponding different envelope ICs simultaneously.
Fig. 6Squared envelope spectra of envelope ICs
5.2. Experimental test on a gearbox
The picture of the gearbox test rig is shown in Fig. 7. A faulty REB with outer race fault and a faulty gear with a broken tooth have been machined artificially and mounted on the input shaft end. The REB type is N1007 (the number of rolling elements 15, the contact angle 0, the diameter of the rolling element 6.75 mm, and the pitch circle diameter 48.5 mm). The rotating speed of the input shaft is about 600 rev/min (the rotating frequency of the input shaft 10 Hz). The faulty REB is mounted on the input shaft.
Theoretically, the ball pass frequency of outer race (BPFO) of the faulty REB can be calculated as in [9] by:
Fig. 7Gearbox test rig
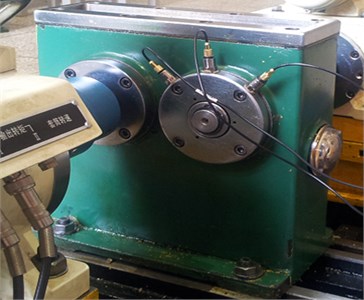
The broken tooth gear is mounted on the output shaft, which is running at the rotating speed about 400 rev/min (the rotating frequency of the output shaft 6.67 Hz). A NI USB9234 (4-channel synchronous sampling) is utilized for data acquisition with the sampling rate 20 kHz; three piezoelectric accelerometers (140609R#, sensitivity 12.6 pC/g, 140608R#, 12.9 pC/g and 140607R#, 12.5 pC/g) are mounted on the bearing house of the input shaft (see Fig. 7) and a charge amplifier is employed.
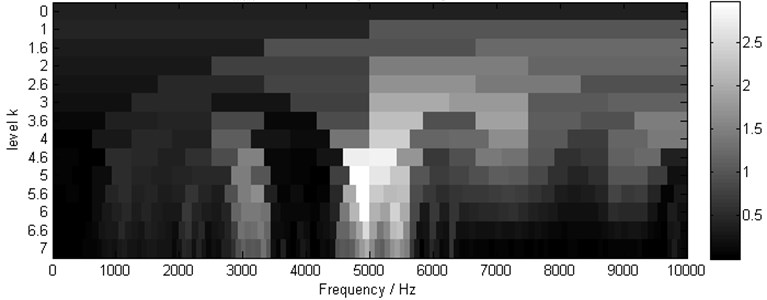
To evaluate the proposed scheme, comparisons of the conventional envelope analysis scheme and the proposed scheme have been conducted and introduced as follows. The kurtogram of vibration from the channel 1 is shown in Fig. 8, where 3 is located at level 5, and the optimal combination (,) are 4843.75 Hz and 312.5 Hz.
Fig. 8Kurtogram of vibration from channel 1, (SKmax= 3 at level 5, ∆fo= 312.5, fo= 4843.75 Hz)
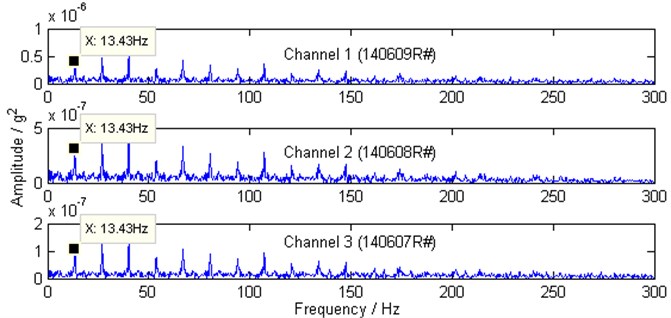
By performing the conventional envelope analysis without the ICA, the obtained squared envelope spectra are shown in Fig. 9, and it can be found that only the characteristic frequency harmonics corresponding to the faulty gear can be clearly found, where 13.43 Hz is about the 2× component of the output shaft speed. However, the characteristic frequencies related to the faulty REB are hardly to identify.
Fig. 9Squared envelope spectra of vibrations form channel 1, channel 2 and channel 3 by conventional scheme
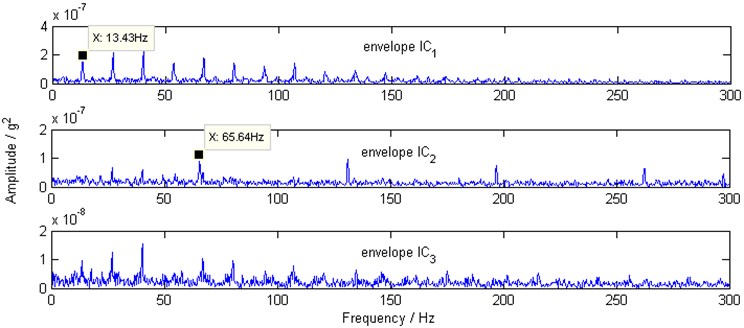
By applying the proposed scheme, the obtained squared envelope spectra are shown in Fig. 10. The characteristic frequencies of the faulty gear can be found in the spectrum of the envelope IC1, and the characteristic frequencies of the faulty REB, 65.64 Hz component and its harmonics can be clearly identified in the spectrum of the envelope IC2 simultaneously. It is worth mentioning that the rotating speed of the input shaft is set on the control panel, and the rotating speed of the output shaft is calculated by the gear ratio, so that the actual rotating speed of the input shaft and the output shaft are slightly different to the setting value. This may explain why the characteristic frequencies of the faulty gear and the characteristic frequencies of the faulty REB are slightly different to the ideal values.
Fig. 10Squared envelope spectra of envelope IC1, envelope IC2 and envelope IC3 by proposed scheme
6. Conclusions
The combination of kurtogram and provides a feasible way to identify the faults of REBs and gears existing simultaneously in a gearbox. Results of the experiments illustrate the validity of the proposed scheme.
References
-
McFadden P. D., Smith J. D. Vibration monitoring of rolling element bearings by the high-frequency resonance technique – a review. Tribology International, Vol. 17, Issue 1, 1984, p. 3-10.
-
Ho D., Randall R. B. Optimisation of bearing diagnostic techniques using simulated and actual bearing fault signals. Mechanical Systems and Signal Processing, Vol. 14, Issue 5, 2000, p. 763-788.
-
Nikolaou N. G., Antoniadis I. A. Demodulation of vibration signals generated by defects in rolling element bearings using complex shifted Morlet wavelets. Mechanical Systems and Signal Processing, Vol. 16, Issue 4, 2002, p. 677-694.
-
Antoni J. Fast computation of the kurtogram for the detection of transient faults. Mechanical Systems and Signal Processing, Vol. 21, Issue 1, 2007, p. 108-124.
-
Hyvärinen A., Karhunen J., Oja E. Independent Component Analysis. John Wiley and Sons, Inc., , 2001.
-
Antoni J., Randall R. B. Unsupervised noise cancellation for vibration signals: part II – a novel frequency-domain algorithm. Mechanical Systems and Signal Processing, Vol. 18, Issue 1, 2004, p. 103-117.
-
Randall R. B., Sawalhi N. A new method for separating discrete components from a signal. Sound and Vibration, Vol. 45, Issue 5, 2011, p. 6-9.
-
Combet F., Gelman L. Novel adaptation of the demodulation technology for gear damage detection to variable amplitudes of mesh harmonics. Mechanical Systems and Signal Processing, Vol. 25, Issue 3, 2011, p. 839-845.
-
Randall R. B., Antoni J. Rolling element bearing diagnostics – a tutorial. Mechanical Systems and Signal Processing, Vol. 25, Issue 2, 2011, p. 485-520.
About this article

Project supported by the National Natural Science Foundation of China (Grant No. 51365023) and (Grant No. 51265018).
