Abstract
Dynamic properties of the machine tools especially the spindle systems contribute greatly to the reliability of the machine tools. The increasing use of modal analysis as a standard tool to estimate the dynamic modal parameters means that both experienced and inexperienced analysts are faced with new challenges: uncertainty about the accuracy of results. Therefore, the key requirement for experimental modal analysis is a reliable, efficient and accurate experimental method in spindle system analysis. Several processes, such as reference and response selection in modal test however would make the system identification process for structural dynamics inaccurate. To investigate the results accuracy when applying experimental modal analysis on machine tool spindle, this work hence further studied the experimental setup itself based on the reference and response selection. The reference selection and reference optimization method is developed for the accuracy and efficiency improving purpose. First, by comparing results from different reference quantity and direction test, the method to select reference points is studied. Then the modal parameters are verified by the complex mode indicator functions and finite element analysis to study the influence of the reference on the modal analysis accuracy. Next, improved algorithm of response points optimization is developed based on the MAC matrix to minimize the number and location of measuring response points. Lastly, the general standard and method to select the reference and response points are put forward. The approach setting-up the experimental impact test provides reliable and accurate results and can reduce the testing time at the same time.
1. Introduction
With recent developments in manufacturing industries, there is a growing demand for dynamic performance of the machine tools. The heart of every modern machine tool is the main spindle unit which is often designed as a motorized spindle. This core component contributes heavily to productivity, precision and quality of the machined products [1]. Numerous works have been carried out and to study the dynamic performance of spindle units. Generally, there are two types of methods to estimate the dynamics. One is finite element method (FEM), the other is experimental modal analysis (EMA) and its related improved methods. However it is difficult to accurately calculate the dynamic parameters using digital model with complex and abstruse joints [2]. The experimental modal analysis is necessary to study and analysis the original dynamics of machine tool spindle system and can assist in the design and optimization of new structures. The method is based on the performance of forced vibration tests, involving the measurements of the frequency response functions. Based on the method, the structure can be described in terms of the natural characteristics which are the frequency, damping and mode shapes.
In the field of EMA method, Altintas et al. [3] used the impact modal analysis to experimentally verify the predicted behavior of spindle systems by finite element method. Garitaonandi [4] verified and improved the finite element (FE) model of the centerless grinding machine by correlation and updating techniques using experimental modal analysis performed in the machine as reference results. Z. Wu et al. [5] applied the four critic modal frequency and the frequency response function (FRF) from impact test to verify the thermodynamics coupled model of high-speed motorized spindle system. These works only simply applied the experimental modal analysis and ignored the accuracy influenced by the method itself.
Compared with the traditional EMA, some researchers focus their study on the excitation of the system, and a random excitation technique was development to identify the operational modal parameters without the knowledge of any of the inputs. It is so called operational modal analysis (OMA), which only uses the operational or natural responses of the structure without using any artificial excitation. The accuracy of the test is greatly based on the signal and noise. In this area, B. Li et al. [6] presents a new technique to generate a strong and broadband excitation to meet the white noise excitation requirements of operational modal analysis, thus characterizing the dynamic properties of a machine tool during machining within the chosen revolution speed range. Furthermore, I. Zaghbani and V. Songmene [7] used the dynamic parameters by OMA to predict machine dynamic stability lobes, and experimental validation shown that some depths of cut that are stable with standard stability lobes become unstable with dynamic stability lobes. V. Gagnol [7] and H. Zhou [8] found that the machine’s dynamic characteristics would be influenced by the high rotating speed. However, these researches cannot cover the OMA’s problem that the mode shapes cannot be mass normalized, and only the un-scaled mode shapes can be determined for each mode [9]. To overcome the problem, X. Mao [9] developed an active excitation modal analysis method (AEMA) to estimate the dynamics of a machine tool structure by sensitivity of the eigenproperties to structural modifications. However, all of the work about OMA requires no force measurement, but relies on all the system modes to be excited from the unmeasured excitation which can never be verified. EMA will generally find all the modes when proper test techniques are utilized. Hence, all the development of OMA still cannot replace the powerful tradition EMA method.
Therefore, it is important and necessary to investigate the experimental modal analysis method of the machine tools and spindle systems. There are two challenges facing the EMA in this field, one is the increasing complexity of the fully assembled spindle, and the other is the requirement of reduction of time available for testing and analysis and a demand for increased accuracy adequate. The EMA accuracy is based on the accuracy of the data test system and the accuracy of modal parameter identification method [10]. Nowadays, the development of the hardware brings the high accuracy of the data acquisition and processing; the new methods of different parameter identification algorithm make it easier to identify the modal parameters of structures. In other words, the experimental modal testing method and its setup play a crucial role in accuracy of modal results. Then all the testing process are mainly depends on testers’ experience and repeated experiments, there is no standard of the method. Therefore, to achieve the dynamic characteristics of the structure accurately, efficiently and reliably, study on the specific experimental modal analysis method of the spindle system is quite important.
In this paper, the experimental modal method is studied by analyzing the references and responses of the impact modal test on a high-speed grinding machine spindle, and the method can be extended to the application of other machine tool spindle system. First, the influence of the reference quantity and directions on the modal analysis result accuracy is studied. The results are verified by the complex mode indicator functions (CMIF) and finite element analysis, meanwhile, indicate that the specific method of one reference point at appropriate place is effective and reliable to obtain the modal parameters of machine tool spindle system accurately. Next, the minimizing number and location of measuring response points is calculated based on improved optimization algorithm using modal assurance criterion (MAC), to ensure that the modal shapes of the spindle system can be accurately identified. Lastly, the general standard and method to select the reference and response points are put forward to meet the requirement of accurate experimental impact test. This paper provides the new specific experimental method for accurate and reliable measurement of the modal characteristics of machine tools spindle system.
2. Experimental modal analysis technique
The impact testing software provides a process solution for modal testing using an impact hammer, including the geometry building, setup of channel, trigger, bandwidth and windowing, measuring and data validating. In order to investigate the reference and response influence on the accuracy of impact modal analysis, all the other factors are kept the same to avoid interference. The PloyMAX which is a broadband modal identification algorithm developed in recent years [11, 12] is applied on the data to achieve the modal parameters.
2.1. PloyMAX algorithm
The least-squares complex frequency-domain (LSCF) method identifies a common-denominator model and was introduced to find initial values for the iterative maximum likelihood method. These “initial values” yielded very accurate modal parameters with a very small computational effort and provide very clear stabilization diagrams. The PolyMAX method is a further evolution of the LSCF estimation method. Just like the FDPI (Frequency-domain direct parameter identification) method, PolyMAX uses measured FRFs as primary data. In the PolyMAX method, following so-called right matrix-fraction model is assumed to represent the measured FRFs:
where is the matrix containing the FRFs between all inputs and all outputs; are the numerator matrix polynomial coefficients; are the denominator matrix polynomial coefficients and is the model order. A so-called -domain model is used in Eq. (1) with: , is the sampling time. Eq. (1) can be written down for all values of the frequency axis of the FRF data. Basically, the unknown model coefficients and are then found as the least-squares solution of these equations. Once the denominator coefficients are determined, the poles and modal participation factors are retrieved as the eigenvalues and eigenvectors of their companion matrix:
The poles are in the diagonal matrix , with eigenfrequencies and damping ratios as follows:
2.2. Complex mode indicator function (CMIF)
The CMIF approach uses a decomposition of the FRF matrix to determine the number of references necessary in order to obtain an adequate experimental modal model. Using only this limited set of data, subsets of references of this FRF matrix are evaluated to determine suitable locations for the references prior to actually performing the modal survey [13]. The FRF matrix is defined as follow:
where and when degrees of freedom system has 2 conjugate complex roots, is the pole of the modal, is the inverted of modal participation factor matrix. The Complex Mode Indicator Function is defined as the eigenvalues solved from the normal FRF matrix at each spectral line and is normally expressed using Singular Value Decomposition notation as:
In which [] is the FRF matrix; [] is the left singular matrix corresponding to the matrix of mode shapes; [] is the diagonal singular value matrix; [] is the right singular matrix corresponding to the matrix of modal participations. To any modal of the system, frequencies of local singular value peaks indicate damped natural frequencies, and using the regular matrix as:
It comes with the CMIFs:
where is eigenvalue of the regular matrix of FRFs, is eigenvalue of the matrix of FRFs, is the freedom from 1 to . At the resonance of a mode, at least one CMIF will peak; repeated modes would be indicated by two or more CMIFs peaking at the same frequency.
2.3. Modal assurance criterion (MAC)
One of the most popular tools for the quantitative comparison of modal vectors is the Modal Assurance Criterion (MAC) [14]. It is bounded between 0 and 1, with 0 representing no consistent correspondence and 1 indicating fully consistent mode shapes. The MAC matrix is defined as:
where and are two mode shape vectors of mode and . To ensure the linear independence of the tested modal vectors, the minimum off diagonal terms modal assurance criterion is considered as an effective method for optimal sensor placement [15].
3. Experimental results and discussion
3.1. Experimental setup
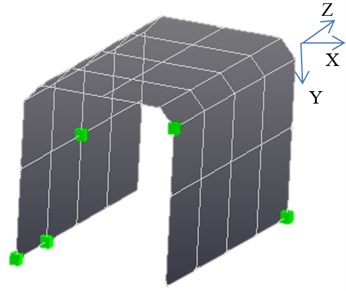
The sensor including the reference and response determines the accuracy of the testing data and the modal analysis results of the spindle system. To study the topic, the experiment is setup as shown in the Fig. 1. The impact modal test is applied on the spindle system with two methods of hammer and accelerometer as reference.
3.2. Reference number of the experiment
Basically there is no difference between a hammer reference and accelerometer reference modal test, which is the one row or column of the FRF matrix in modal test. But there are some very basic practical aspects that may cause some differences, so the modal analysis results in admissible difference of two methods. Normally, multiple reference measurements reduce the likelihood of “missing” a mode during the curve fitting process [17]. Multiple reference curve fitting offers advantages when the FRF data contains closely coupled modes or truly repeated modes. However it is depends on the theoretical analysis of general structures. To some cases like the spindle systems, what really important is the error sensitive modes. Furthermore, the multiple references may reflect on the redundancy of modal information and results in the selection error of the modal parameters.
Fig. 1Experimental setup
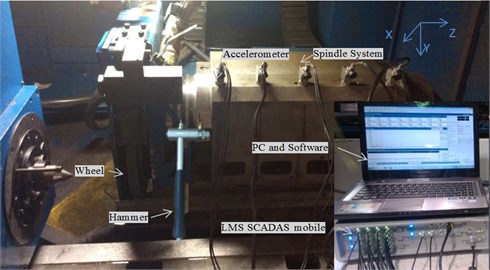
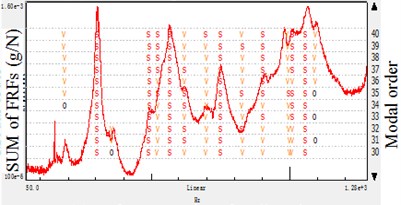
Fig. 2Stabilization diagram of different reference number: hammer-reference modal analysis
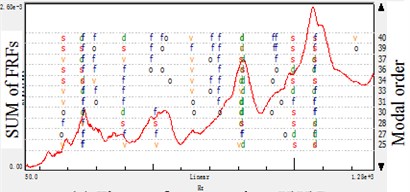
a) Three reference points \\
b) Two reference points \
c) One reference points
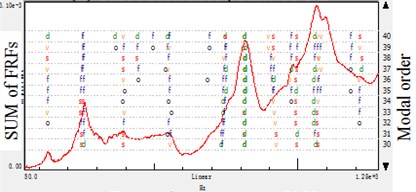
Fig. 3Stabilization diagram of different reference number: accelerometer-reference modal analysis
a) Three reference points \\
b) Two reference points \
c) One reference points
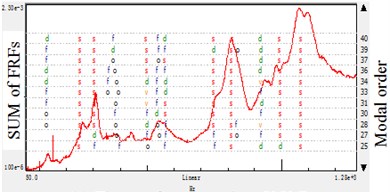
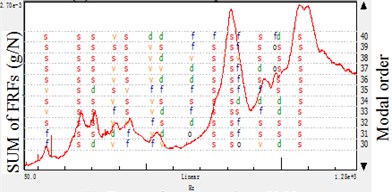
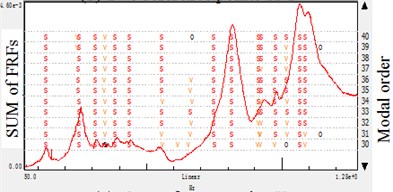
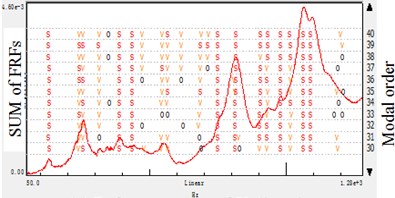
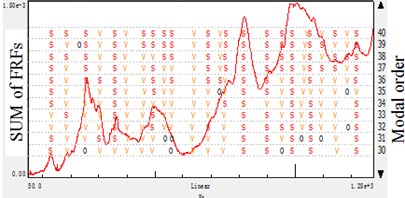
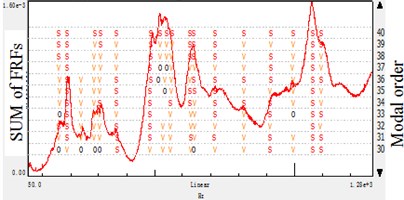
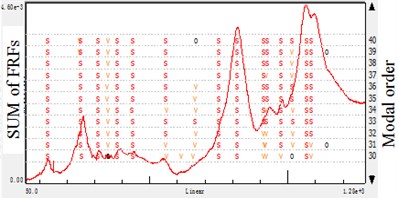
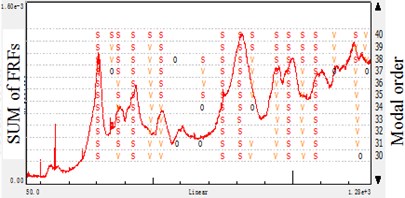
In this paper, the same experiment is done and the frequency range of 50-1280 Hz is applied on the impact test. Then the estimate results of every processing is showed in the stabilization diagram, the symbols have following meaning: ‘’: new pole, ‘’: stable frequency, ‘’: stable frequency and damping, ‘’: stable frequency and eigenvector, ‘’: all criteria stable. Also the figure shows the sum of the FRFs and the modal order in estimation.
By the results shown in Fig. 1 and Fig. 2, it is concluded that whatever the reference is based on hammer or accelerometer, the stabilization diagram indicate that adding the reference quantity will result in instability using the same modal size in a test. It is because the multiple reference points would bring redundant information in data processing, and reflect on the modal parameters calculation. Especially for the different test in moving hammer and accelerometers, the data noise would also bring the modal information deviation.
For some structures, the more reference is selected the easier the modes could be obtained in the modal test. This is because that it is not theoretically possible to find a proper reference degree of freedom (DOF) where all the modes have sufficiently high participation for proper modal model extraction. Furthermore, the multi-reference test is also required in cases where the structure has more modes with the same resonance frequency. However, for the structure like machine tool spindle systems, it is not likely to have local modes and the structure fixed is not certain symmetrical. In the paper, modal parameters are got from the modal estimation with the help of mode indicator functions, FRFs, modal synthesis FRFs and modal validation tools. As indicated in the Tables 1 and 2, the single-reference got more comprehensive information than the multi-reference experiment in the same modal frequency bandwidth and estimation order. It is concluded that the added reference DOF(s) does not add more information about these modes but on the contrary bring the trouble in modal parameter selection with redundant information. Therefore, in impact modal analyses of those spindle systems, it is not simply to add reference DOF(s), but to selection the better position to achieve the concerned modal information.
Table 1Experimental modal analysis results of different reference number: hammer-reference
Mode order | and | , , | ||||
Frequency (Hz) | Modal shape description | Frequency (Hz) | Modal shape description | Frequency (Hz) | Modal shape description | |
1 | 130.371 | Deflection in the direction | 130.809 | Deflection in the direction | ||
2 | 250.662 | Waving in the direction | 246.171 | Waving in the direction | 251.366 | Waving in the direction |
3 | 387.993 | Deflection in the and direction | 390.054 | Deflection in the and direction | 392.275 | Deflection in the and direction |
4 | 435.886 | Deflection in the direction | ||||
5 | 552.572 | Deflection in the and direction | 558.653 | Deflection in the and direction | ||
6 | 749.180 | Bending in the and direction | 749.865 | Bending in the and direction | ||
7 | 814.289 | Bending in the direction | 814.289 | Bending in the direction | 813.934 | Bending in the direction |
8 | 930.252 | Bending in the and direction | 924.147 | Bending in the and direction | ||
9 | 977.541 | Bending in the direction | 994.609 | Bending in the direction | 994.622 | Bending in the direction |
10 | 1071.170 | Deflection in the and direction | ||||
11 | 1089.031 | Deflection in the direction | ||||
Table 2Experimental modal analysis results of different reference number: accelerometer-reference
Mode order | and | , , | ||||
Frequency (Hz) | Modal shape description | Frequency (Hz) | Modal shape description | Frequency (Hz) | Modal shape description | |
1 | 130.004 | Deflection in the direction | ||||
2 | 251.422 | Waving in the direction | 250.578 | Waving in the direction | 249.068 | Waving in the direction |
3 | 383.051 | Deflection in the and direction | 306.494 | Deflection in the and direction | 303.904 | Deflection in the and direction |
4 | 437.733 | Deflection in the direction | 430.747 | Deflection in the direction | ||
5 | 557.835 | Deflection in the and direction | 558.653 | Deflection in the and direction | ||
6 | 750.370 | Bending in the and direction | 751.695 | Bending in the and direction | 747.543 | Bending in the and direction |
7 | 816.231 | Bending in the direction | 812.016 | Bending in the direction | 816.419 | Bending in the direction |
8 | 920.096 | Bending in the and direction | 921.971 | Bending in the and direction | ||
9 | 975.939 | Bending in the direction | 994.095 | Bending in the direction | 996.173 | Bending in the direction |
10 | 1069.820 | Deflection in the and direction | 1070.019 | Deflection in the and direction | 1072.499 | Deflection in the and direction |
11 | 1085.896 | Deflection in the direction | ||||
Table 3Experimental modal analysis results of different reference directions: hammer-reference
Mode order | ||||||
Frequency (Hz) | Modal shape description | Frequency (Hz) | Modal shape description | Frequency (Hz) | Modal shape description | |
1 | 130.371 | Deflection in the direction | 130.607 | Deflection in the direction | 160.498 | Deflection in the direction |
2 | 250.662 | Waving in the direction | 254.700 | Waving in the direction | 189.706 | Waving in the direction |
3 | 387.993 | Deflection in the and direction | 359.117 | Deflection in the and direction | 367.118 | Deflection in the and direction |
4 | 435.886 | Deflection in the direction | ||||
5 | 552.572 | Deflection in the and direction | 627.770 | Deflection in the direction and waving in the direction | ||
6 | 749.180 | Bending in the and direction | 753.188 | Bending in the and direction | 714.753 | Bending in the and direction |
7 | 814.289 | Bending in the direction | 817.087 | Bending in the direction | ||
8 | 930.252 | Bending in the and direction | 953.800 | Bending in the and direction | ||
9 | 977.541 | Bending in the direction | 991.160 | Bending in the direction | ||
10 | 1071.170 | Deflection in the and direction | 1072.807 | Deflection in the and direction | ||
11 | 1089.031 | Deflection in the direction | 1057.932 | Deflection in the direction | 1095.934 | Deflection in the direction |
3.3. Reference direction of the experiment
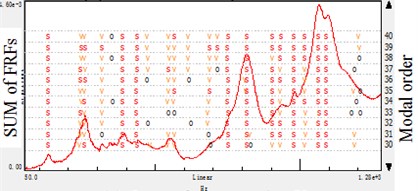
In order to get the best information of reference DOF, in this paper, the direction section of reference at one position is experimented and analyzed. The position is based on the proper modal extraction position verified at the non-node of the mode. As demonstrate in the Fig. 4 and Fig. 5, the single-reference tests of different reference directions are conducted with both hammer and accelerometer referenced methods. By contrast, the -direction stabilization diagram contains more modal information than others. And the -direction results in very different graph by the effect of some possible spurious modes.
Fig. 4Stabilization diagram of different reference directions: hammer-reference modal analysis
a) Reference points direction
b) Reference points direction
c) Reference points direction
Fig. 5Stabilization diagram of different reference directions: accelerometer-reference modal analysis
a) Reference points direction
b) Reference points direction
c) Reference points direction
To further study the modal analysis parameter results in Table 3 and Table 4, the -direction results have the most integrated of the spindle. And the -direction would lose some mode, -direction do similarly but give prominence to the -direction mode which is less important in this case. When analyzing the spindle structure which is fixed on the machine tool in -direction, it is discovered that the -direction have the most modes, the empirical analysis matches the experimental results.
In cylindrical grinding, the radial and tangential vibration is more important than that of axial. Therefore, the modes of the and directions occupy the dominant position in the research, and the proper modal extraction should be in these error-sensitive directions. Based on the study, it is concluded that the error-sensitive modes is important to analysis the spindle systems rather than the global ones. Furthermore, the error-sensitive modes are effective in experiment-based model updating.
Table 4Experimental modal analysis results of different reference directions: accelerometer-reference
Mode order | ||||||
Frequency (Hz) | Modal shape description | Frequency (Hz) | Modal shape description | Frequency (Hz) | Modal shape description | |
1 | 130.004 | Deflection in the direction | ||||
2 | 251.422 | Waving in the direction | 493.901 | Deflection in the direction | ||
3 | 383.051 | Deflection in the and direction | 375.958 | Deflection in the and direction | 524.049 | Waving in the direction |
4 | 437.733 | Deflection in the direction | 430.995 | Deflection in the direction | 567.843 | Deflection in the and direction |
5 | 557.835 | Deflection in the and direction | 622.271 | Deflection in the direction and waving in the direction | ||
6 | 750.370 | Bending in the and direction | 751.479 | Bending in the and direction | 751.781 | Bending in the and direction |
7 | 816.231 | Bending in the direction | 813.643 | Bending in the direction | 832.234 | Bending in the direction |
8 | 920.096 | Bending in the and direction | 940.617 | Bending in the and direction | ||
9 | 975.939 | Bending in the direction | 986.345 | Bending in the direction | 1000.525 | Bending in the direction |
10 | 1069.820 | Deflection in the and direction | ||||
11 | 1085.896 | Deflection in the direction | 1083.377 | Deflection in the direction | 1088.902 | Deflection in the direction |
4. Verification
4.1. Finite element method result
To see the reliability of the modal analysis results, a finite element model is developed to assistant observe the modal parameters of modal frequency and shape. The FE model of spindle system is modeled according to the followings:
a) Some small features which would not affect the system modal stiffness and modal mass, for example small holes, shaft shoulders and angle of chamfers are neglected in this model.
b) The mesh type of global system is hexahedron 20.
c) The bolt and screw property are specified as the property of the bar element.
d) The clearance fit property in the spindle is modeled as a contact connection with negative clearance value and both parts are linked together in the tangential directions. The fitting parts conclude the outer ring with the bearing support, the inner ring with the shaft, the stator with the support and the rotor with the shaft.
e) As bearings, the spider element is applied, with one center node represents the inner ring of bearing. The outer ring is connected with it by treating the balls of bearing as springs in , and directions.
f) Other small parts are assumed to be completely constraint to the main parts.
g) The bottom of the spindle system is regard as DOFs restraint to the ground to simulate the fixing situation in the machine tool.
The material of the shaft is 42 CrMo, the rotor and stator is composed of silicon sheet and copper, 45 steel are respectively used for spindle box, bearings and other parts. The spindle system is fixed on the ground to simulate the condition that the spindle box is installed on the machine. The model, with more than 250000 nodes is depicted in Fig. 6 and dynamic characteristics of spindle system were then studied using Nastran software. A total of 14 mode shapes and natural frequencies were extracted in the 0-1280 Hz frequency range. The comparison between the EMA and FEM results are shown in Table 5. Expect for the 3 grinding wheel modes, the other 11 modes of EMA ( direction single reference) and FEM are in acceptable agreement, which in other way indicate the direction single reference impact test have the reliable analysis of this system. In this paper, the FEM is not the topic issue, so there is no more discuss about the modeling error.
Table 5Comparison of EMA(X direction single Hammer-reference) and FEM results
Mode order | Hammer-reference modal frequency (Hz) | FEM Modal frequency (Hz) | Error (%) | FEM Modal Shape description |
1 | 130.371 | 113.7 | 12.79 | Deflection in the direction |
2 | 250.662 | 290.4 | 15.85 | Waving in the and direction |
3 | 387.993 | 399.7 | 3.02 | Deflection in the and direction |
4 | 435.886 | 489.4 | 12.28 | Deflection in the direction |
5 | 552.572 | 603.2 | 9.16 | Deflection in the and direction |
6 | 749.180 | 711.8 | 4.99 | Bending in the and direction |
7 | 814.289 | 822.7 | 10.33 | Bending in the direction |
8 | 930.252 | 979.1 | 5.25 | Bending in the and direction |
9 | 977.541 | 1011.5 | 3.47 | Bending in the direction |
10 | 1071.170 | 1015.2 | 5.23 | Deflection in the and direction |
11 | – | 1017.4 | – | Torsion of Wheel |
12 | – | 1051.7 | – | Torsion of Wheel |
13 | – | 1118.3 | – | Torsion of Wheel |
14 | 1089.031 | 1137.8 | 4.48 | Deflection in the Z direction |
4.2. CMIFs
Due to the shortages of FEM, the verification is applied using the CMIFs. The CMIF will exhibit frequencies of local peaks to indicate damped natural frequencies. Depending on the number of references, higher order CMIFs can be computed to determine the multiplicity of the repeated root. To different references, if the added reference would influence the local peaks number. If the number of peaks observed in the CMIFs plot is unchanged, then these reference locations are likely to not be needed to adequately excite all the modes. On the other way, if the number changed, then these reference locations are needed to adequately excite all the modes. Therefore, the CMIFs plot can determine the number of references necessary in order to obtain an adequate experimental modal model.
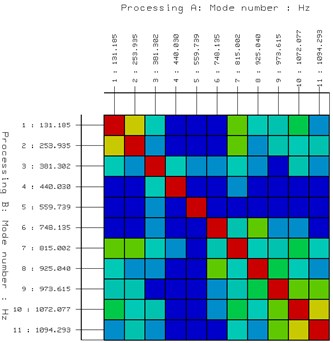
Fig. 6Finite element model of the spindle system
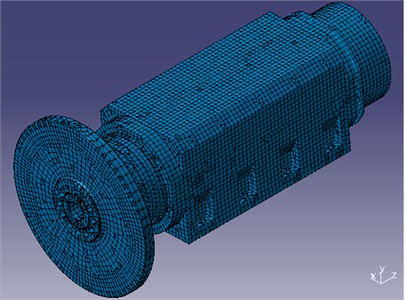
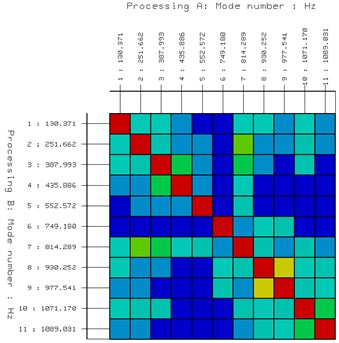
Fig. 7CIMFs of different reference points
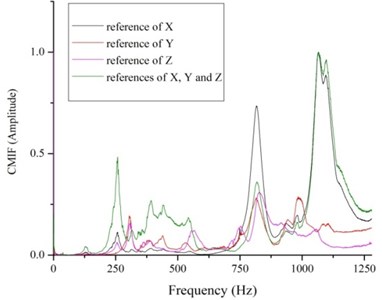
As displayed in the Fig. 7, the four different CMIFs exhibit frequencies of local peaks. From the view of all the frequency range, the -reference and -reference functions have the most peaks. What is more, the peaks of -reference function between 300 to 600 Hz have small amplitude while the -reference function has many noisy peaks during the frequency range. And according to the figure, comparing the -reference and -reference with the -reference function, adding the references, the peaks of CMIFs plot is unchanged. What is worse, it will bring more data noise to the system. Therefore, hybrid experimental-numerical study show that the -reference impact modal testing method on the proper extraction position is a feasible and reliable way to achieve the accurate experimental modal parameters.
5. Optimization of response points
In modal analysis, the reference analysis conducted above is the fundamental and the response further decides the modal analysis results. In order to get the efficiency and economy test, approach to optimize the response placements for modal testing purposes need to be presented. Logically, the number of degrees of freedom to be selected as response is the more the better so that the linear independence of the mode shapes to be measured is maximized, at least much more than the modal order of the system [16].
It is known from the structural dynamic principle that the structural inherent modes should comprise a group of orthogonal vectors at the nodes. To ensure the linear independence of the tested modal vectors, the minimum modal assurance criterion is considered as an effective method for optimal sensor placement. In this research, the original maximum off diagonal MAC value is set as the optimization object to achieve the minimum number and location of response points that is necessary. In other way, the other points are not needed to get the experimental modal parameters according to the MAC value requirement but to have a better modal shape description.
Therefore, an improved algorithm of response points optimization is developed based on the MAC matrix as shown in the Fig. 8. The procedure used here is to initialize the selection of the sensor set with a small set of locations; then to add one sensor at a time, choosing from all the DOFs available in the data to reduce the off diagonal elements of MAC matrix to an acceptable magnitude; finally, a optimization result is adopted to find the locations of the sensors.
Fig. 8Procedure of response location optimization
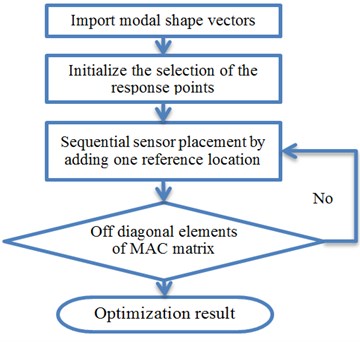
Fig. 9Optimization results of response location
The optimization procedure results in 5 response points (including the reference point) from the 45 points presented in Fig. 9, and all the points have 3 degrees of freedom. And then a new test is done by the reduced 5 response points. The new EMA results show the same modes and the MAC matrices show a similar behavior for the original (Fig. 10(a)) and the optimized response set-up modal matrix (Fig. 10(b)). This is a good indicator for an appropriate response selection. However, the MAC matrix with respect to the optimized modal matrix exhibits some larger off-diagonal terms than the one related to the original one and this means that the linear independence of the reduced modes is worse. Yet, since the off-diagonal terms are still small and do not introduce any problem. The optimization results show that by the procedure, the least response points is got to meet the efficiency and economy test objective, keeping the independence of modes at the same time. It is a great reduction of time available for testing, and a promotion of condition monitoring of the machine.
Fig. 10Modal analysis results and MAC matrix of different modes
a) Before optimization
b) After optimization
6. Conclusions
As to experimental modal analysis of machine tools spindle system, reference and response points are often selected according to experience and repeated experiments, which would leads to efficiency and accuracy problems. In this paper, by analyzing the problems raised in the modal test of reference and response points, the preceding chapters showed the specific experimental method to select the reference number and directions, and the optimization approach for response placement in the field. And the result accuracy of the reference selection is verified by the FEM and CMIFs, and the test efficiency is improved in response optimization and supported by the MAC matrix comparisons. The approach therefore seems to provide reliable results and should be considered as general standard and method for setting-up to meet the requirement of accurate experimental impact test:
1) Whatever the EMA reference is based on hammer or accelerometer, to achieve better results, it is not simply to add reference DOF(s), but to selection the better position to achieve the concerned modal information. Otherwise, redundant data information would bring the trouble in modal parameter selection on the contrary.
2) It is better to pick up the point that positioned on the unrestrained and error sensitive direction of the machine system based on the non-mode nodes requirement.
3) With only 5 (from 45) response locations, every mode in the given frequency band can be excited accurately and the linear independence of the modes is good. So when selecting the response points, not all the nodes are necessary but should include the critical position of the modal shape.
In this article, significant progress has been made in addressing the key problem of discriminating reference and response locations in the identification of the dynamics of complex structure system. The present procedure in experimental modal analysis offers a heuristic approach hereto. The founding of reference and response selection and optimization ease the process dramatically, opening the way to an efficient and accurate process of the EMA in machine tool spindle. The method in the paper is necessary to improve the EMA and has very strong application background to experimental study the dynamic characteristics of the machine tool spindle. However, more work need to be done to make the method as quantitative as possible.
References
-
Abele E., Altintas Y., Brecher C. Machine tool spindle units. CIRP Annals – Manufacturing Technology, Vol. 11, 2010, p. 781-802.
-
Mao X., Lu B., Li B., Cai H., Liu H., Pen F. An approach for measuring the FRF of machine tool structure without knowing any input force. International Journal of Machine Tools and Manufacture, Vol. 86, 2014, p. 62-67.
-
Altintas Y., Cao Y. Virtual design and optimization of machine tool spindles. CIRP Annals – Manufacturing Technology, Vol. 54, Issue 1, 2005, p. 379-382.
-
Garitaonandia I., Fernandes M. H., Albizuri J. Dynamic model of a centerless grinding machine based on an updated FE model. International Journal of Machine Tools and Manufacture, Vol. 48, 2008, p. 832-840.
-
Wu Z., Li B., Yang J., Sheng X. A thermodynamics coupled modeling approach for analysis and improvement of high-speed motorized spindle system. Journal of Vibroengineering, Vol. 15, Issue 3, 2013, p. 1119-1129.
-
Li B., Cai H., Mao X., Huang J., Luo B. Estimation of CNC machine-tool dynamic parameters based on random cutting excitation through operational modal analysis. International Journal of Machine Tools and Manufacture, Vol. 71, 2013. p. 26-40.
-
Zaghbani I., Songmene V. Estimation of machine-tool dynamic parameters during machining operation through operational modal analysis. International Journal of Machine Tools and Manufacture, Vol. 49, 2009, p. 947-957.
-
Zhou H., Wang C., Zhao Z. Dynamic characteristics of conjunction of lengthened shrink-fit holder and cutting tool in high-speed milling. Journal of Materials Processing Technology, Vol. 207, Issue 1-3, 2008, p. 154-162.
-
Gagnol V., Le T. P., Ray P. Modal identification of spindle-tool unit in high-speed machining. Mechanical Systems and Signal Processing, Vol. 25, 2011, p. 2388-2398.
-
Cao S., Zhang W., Xiao L. Modal analysis of vibration structure: theory, experiment and application. Tianjin, 2011
-
Peeters B., van der Auweraer H., Guillaume P. The PolyMAX frequency-domain method: a new standard for modal parameter estimation. Shock and Vibration, Vol. 11, 2004, p. 395-409.
-
Peeters B., Guillaume P. Automotive and aerospace applictions of the LMS PolyMAX modal parameter estimation method. Proceedings of the 22th Intemational Modal Analysis Conference, Dearbom, USA, 2004.
-
Avitabile P., Haselton D., Modal J. Test reference selection using an SVD procedure, 14th International Modal Analysis Conference, Detroit, Michigan, 1996.
-
Miroslav P., Michal B., Tomáš H. Modal assurance criterion. Procedia Engineering, Vol. 48, 2012, p. 543-548.
-
Carne T. G., Dohrmann C. R. A modal test design strategy for model correlation. Proceedings of the 13th International Society for Optical Engineering Conference, New York, USA, 1995.
-
Shye K., Karsen C. V., Richardson M. Modal testing using multiple references. 5th International Modal Analysis Conference, 1987.
-
Schedlinski C., Link M. An approach to optimal pick-up and exciter placement. Proceeding of SPIE International Society for Optical Engineering, Vol. 2768, 1996, p. 376-382.
About this article

This project is supported by National 863 High Technology R&D Program (No. 2012AA041309) and Innovation Fund of Ph.D. of Donghua University (No. 13D310304).
