Abstract
The purpose of this project is to improve the optimization design of complex mechanical structure based on the combination of response surface model and multi-objective genetic algorithm (MOGA). First of all, we built the finite element model (FEM) for the printed electronics inkjet printer through experimental modal analysis (EMA) and finite element analysis (FEA). The analysis of the static and dynamic characteristics of the FEM confirms the weak points of the structure and its actual performance. Next, using central composite design (CCD) method, it selects sample points in the design space and carries out numerical simulation and establishes the initial second order response surface model with eight design variables to further determine the inkjet printer’s first order natural frequency, weight and maximum deformation of the inkjet head. Finally, it carries out an approximation optimization of response surface model using MOGA to obtain the Pareto optimal solution set. Our simulation results determine that the optimal solution can increase the first order natural frequency of the inkjet printer by 36.3 % to effectively avoid the resonance region caused by the servo motor excitation. The maximum deformation of inkjet head decreases by 33 % and the weight of the inkjet printer can be reduced by 19.5 %. We believe that optimization can improve the performance of the inkjet printer and reduce its weight at the same time. The method proposed in this study is suitable for multi-objective optimization of complex structures similar to the printed electronics inkjet printer.
1. Introduction
In recent years, inkjet printing technology has been widely used in printed circuit boards (PCBs) [1, 2]. By means of precisely controlled movable system and the inkjet head, a preprogrammed inkjet printer sprays conductive ink onto the substrate to form circuits. Hence it can fabricate circuit boards on a large scale as efficiently as a traditional inkjet printer prints on papers [3, 5]. Due to the delicacy and high accuracy of the printed circuits, even a tiny vibration or deformation of the inkjet printer will affect the printing quality. Thus, the design of the inkjet printer has to consider the machine’s stiffness and vibration. As a kind of complex mechanical structure, the existing optimizations of printed electronics inkjet printer normally adopted scheme comparison method. Designers usually modify repeatedly the shape and size of the structure, adopt a limited number of parameter combinations to simulate, analyze and perform parameters sensitivity analysis, and finally choose the parameter combination of the best performance. This method cannot ensure the optimum scheme, not to mention how time-consuming the parameter selection and numerical simulation analysis process are. Therefore it cannot meet the requirements of modern printing design and manufacture of electronic inkjet printer.
Over the years, optimization methods of the response surface model and MOGA have become one of the research hotspots. Tang Yong adopted the method of second order response surface model with the integration of non-dominated genetic algorithm in the optimization of the loading path of T-shaped tube hydroforming [6]. Wang proposed a self-adaptive response surface model, which in nature is a kind of dynamic optimization method with the function of updating response surface model. The model has great advantage in terms of overall convergence and optimization efficiency [7]. Linan et al. verified the applicability of multi objective genetic algorithm in robot structure design through its application in the optimization of amphibious robot structure parameters [8]. Wang Ping et al. combined MOGA in their experimental design in the automobile structure optimization to harness the system uncertainty and ensure the reliability of the final optimization results [9].
Inspired by the above researches, this paper discusses the application of a multi-objective optimization method combining response surface model and genetic algorithm in printed electronics inkjet printer structure design. Based on a certain type of printed electronics inkjet printer, it analyzes its static and dynamic characteristics through EMA and FEA. Then it introduces the response surface method and genetic algorithm and proposes the method of iterative approximation in the structure optimization of inkjet printer. Targeting at solving problems revealed in previous characteristic analysis of the printer, it determines the multi-objectives of the optimal model as the inkjet printer weight, first order natural frequency and the maximum deformation of inkjet head. Then it establishes the initial second order response surface model based on experimental design and numerical simulation, and approximates iteratively the optimum solution through genetic algorithm. Finally it chooses the suitable and satisfactory solution among the obtained Pareto optimal solution set and carries out its numerical simulation verification.
2. FEM of the inkjet printer
2.1. FEA of the inkjet printer
Considering the relative movement between parts and different materials they are made of, the model mainly contains six parts: base, bed, a workbench, lateral guide rail and leadscrew, a longitudinal guide rail and leadscrew, and an inkjet head unit. The bed comprises of table, column and top beam. While the base is made of SPCC and bed of granite, the inkjet head unit and workbench are of Unifont90, and the guide rail and leadscrew are of GCr15. Fig. 1 is the CAD model of a certain type of inkjet printer.
Fig. 1CAD model of the inkjet printer: 1 – Workbench; 2 – Longitudinal guide rail and leadscrew; 3 – Inkjet head unit; 4 – Lateral guide rail and leadscrew; 5 – Bed; 6 – Base
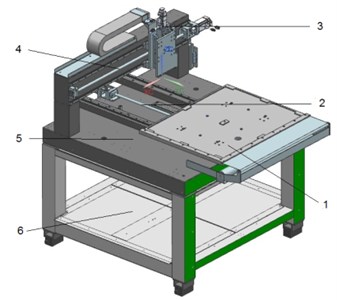
Fig. 2FEM of the inkjet printer
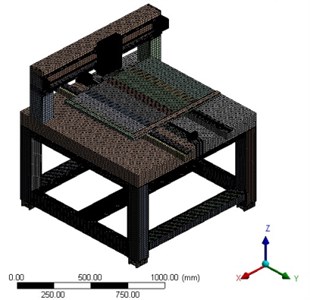
To avoid finite element mesh distortion brought by some detailed structure features such as chamfer, auxiliary hole and to further improve the mesh partition quality, the FEM of inkjet printer has to simplify or remove some parts or detailed features which have no or little impact on the analysis [10]. The inkjet printer is mesh partitioned into hexahedral solid 186 unit grid to improve the accuracy and reduce calculation scale. The FEM, as shown in Fig. 2, utilizes slice, edge sizing, body sizing and hex dominant, etc. to control the shape and size of grid. The type of contact between the parts and component is defined as Non Separation.
Although the above FEM strives to reflect the real inkjet printer structure, it cannot guarantee its accuracy and reliability due to the simplification of model, idealization of material, and simulation of combining surfaces in the process of model establishment. So this study will combine the FEA with EMA to modify and verify the FEM through the analysis of the natural frequency and vibration of the inkjet printer. Hence it ensures that the established FEM is valid for further analysis and optimization.
Since the inkjet printer is supported by four iron pads attached to the bottom surface, there is no relative sliding between the inkjet printer and ground and the friction is idealized as infinite. So the four bottom supports are constraint as fixed, and their six degrees of freedom are defined. Due to the excitation frequency of the motor is about 50 Hz, frequency range to be analyzed is 0-200 Hz. The first five order natural frequency values and the corresponding vibration modes are shown in Table 1.
Table 1Comparison of experimental results and numerical results
FEA (Hz) | EMA (Hz) | Relative error (%) | Description of vibration mode | |
1 | 46.721 | 46.096 | 1.36 | Roll motion along axis |
2 | 49.26 | 47.39 | 3.95 | Roll motion along axis |
3 | 77.996 | 76.71 | 1.68 | Twist motion along axis |
4 | 118.25 | 112.66 | 4.96 | Top beam of the bed roll motion along axis |
5 | 145.89 | 152.6 | 4.40 | Bed twist motion along axis |
2.2. EMA
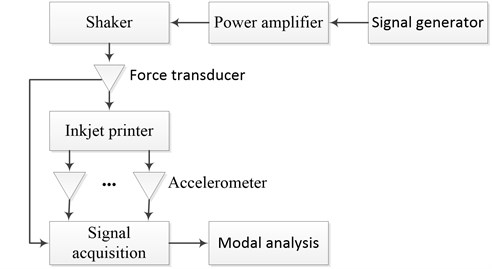
By giving excitation to fixed points and then collecting response signals, we carried out an EMA to verify the accuracy of the FEM. The measurement system is shown in Fig. 3. Apart from the inkjet printer, it consists of three main parts: exciting system, response signal collecting system and modal analyzing and processing system. Exciting system includes the signal generator, the power amplifier and the shaker while the accelerometer, force transducer and signal acquisition are responsible for collecting response signals. LMS Test.lab is used for modal analysis and process.
Fig. 3Block diagram of the testing system
The inkjet printer was placed in its normal operating position in the modal test. The measuring points and exciting points were arranged mainly on parts of comparatively bigger deformation based on the FEA results. Single point excitation method was used to vibrate the whole machine. The excitation signal was sinusoidal, and the frequency range was 0-200 Hz. The location of exciting points should fully motivate system vibration and the motivation direction should conform to that of the vibration. The location of measuring points should reflect as accurately as possible the vibration position of the mode. In this study, the measuring and vibrating point distribution is as shown in Fig. 4 with E1 and E2 as the exciting points, T1, T2, T3 and T4 as the measuring points. The frequency response curves are shown in Fig. 5.
Fig. 4Exciting points (E1, E2) and measuring points (T1, T2, T3, T4) distribution from
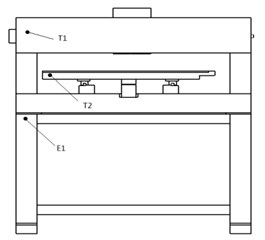
a) Front
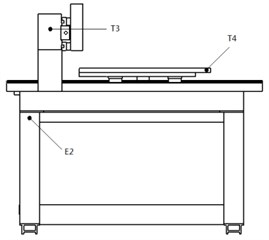
b) Flank
Fig. 5FRF experimental results of measuring points
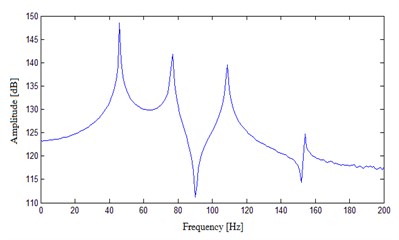
a) T1
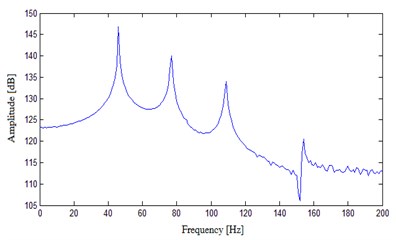
b) T2
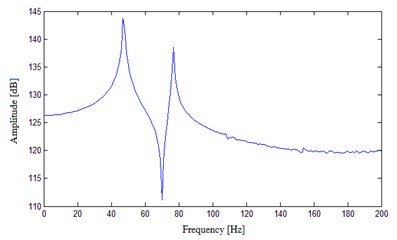
c) T3
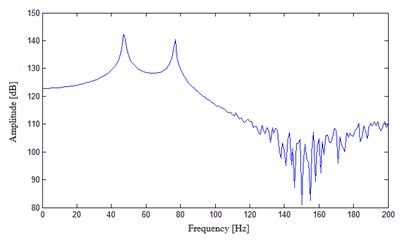
d) T4
The results show that the EMA can well stimulate the natural frequency of the system structure. The comparison of experimental results and those of FEA, as shown in Table 1, indicates the relative errors are less than 5 %. The high consistency has proved the reliability of the FEM and the analysis results.
2.3. Static and dynamic characteristic analysis
The printing performance is mainly decided by the inkjet printer’s mechanical structure and control system. The performance of the latter is also realized through the system’s mechanical structure. Therefore, the properties of mechanical structure decide directly the working performance of the inkjet printer [11, 12]. The static characteristics of the inkjet printer are reflected in the structural deformation caused by global gravity and driving forces while its dynamic characteristics are mainly manifested in the motor vibration.
2.3.1. Static characteristic analysis
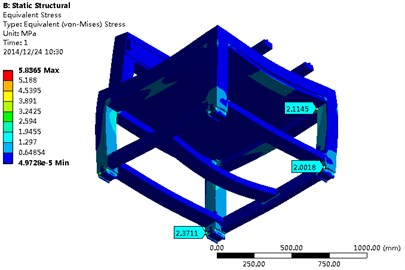
Apart from the fixed constraint, standard earth gravity was imposed to the inkjet printer. The deformation of the whole structure and the stress response were set to be output, as shown in Fig. 6 and Fig. 7.
Fig. 6Nephogram of inkjet printer deformation
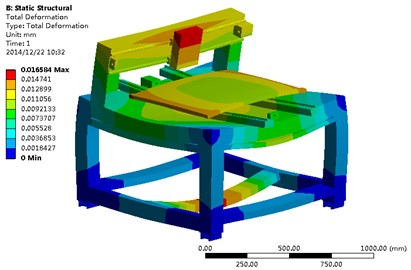
Fig. 7Nephogram of inkjet printer stress
From Fig. 6, the maximum deformation is 0.016584 mm. The twisting deformation appears in the upper part of inkjet head module around the axis while the workbench presents downward deflection in its center along the -axis. Deformations of other parts are secured within 0.015 mm. So the whole structure satisfies the design requirements. The figure displays relatively big deformation in the base due to the gravity of the machine. So the thickness of the columns and beams in the base and the beam lengths along direction should be adopted as design variables to improve the stiffness of the inkjet printer.
As shown in Fig. 7, the inkjet printer generally takes on blue, which means the overall stress is below 0.64854 MPa. The base is under relatively greater stress, with the maximum of 5.8365 MPa. It can be explained by the fact that the base is made of hollow material, but bears the weight of the whole machine. So it is the weak stress region. It can be strengthened through enhancing the thickness of the base columns and beams. While the maximum stress of the whole inkjet printer is far below the allowable stress of SPCC material, the inkjet printer structure excepting the base part has great possibility to be optimized from the perspective of the machine’s overall strength.
2.3.2. Dynamic characteristic analysis
As sophisticated electronic circuit printing equipment, when the inkjet printer is working, its motion system is in the constant movement of starting, accelerating, smooth operating, decelerating and braking. During the process, the inkjet printer will be unavoidably affected by the motor excitation, which may lead to structure resonance and consequently affect the printing quality.
The inkjet printer is driven by a servo motor, which is directly connected with the rotating shaft (leadscrew). So when the motor is running at a high speed, its incentive effect on inkjet printer cannot be ignored. Suppose is the motor excitation frequency as, is the motor rotating speed, is the upper and lower floating error [13, 14], then:
The rotating speed of the inkjet printer’s servo motor in this study is 3000 rpm. By Eq. (1), its excitation frequency is about 50 Hz. According to the modal analysis results, the first order natural frequency of the inkjet printer is 46.721 Hz and second is 49.26 Hz. Since they both are close to the motor excitation frequency of 50 Hz, the optimization design shall pay particular attention to differ the natural frequency from the motor excitation frequency to avoid the structure resonance.
3. Response surface methodology (RSM)
In the optimization of large and complex structure, the objective functions and the constraint conditions of the mathematical model are often hard to be explicitly expressed. The derivatives are also often discontinuous. So it denies the optimal solution through the general optimization algorithm based on gradient. But the problem can be solved by substituting the structure finite element calculating results with response surface model based on statistics [15]. RSM is a kind of optimization method combining mathematical statistics and experimental design. It specifies the set of design points to carry on experimental design. By constructing explicit approximate expressions, it replaces implicit objectives and constraint functions with explicit functions, so as to get response surface model to predict the response value of the non-test points [16].
3.1. CCD
In order to construct the response surface model, this study adopted the CCD, a method evolved from second order whole plot factor and subplot designs. The nonlinear relationship between the evaluation index (output variable) and the factors can be evaluated by increasing a design point (equivalent to an increase of a level) in the second order experiment. In addition, CCD can be applied to different design and operation domains [17]. Therefore, the method has the virtue of reflecting the characteristics of the whole design space with fewer sample points. It is of high design efficiency and wide adaptability. For the experiment of second order factor, the test points include the following three parts: 1 central point, axial points and analysis points. The total testing points needed can be calculated through the following formula:
where is the number of design variables, is the factorial coefficient.
3.2. Response surface model
This study chose the second order polynomial response surface model with higher accuracy. The model with design variables can be expressed as [18]:
where indicates the output variable, is the design variable, represents the number of design variables, is the unknown coefficient vector, which can be obtained by the least square regression method.
3.3. Evaluation of response surface model
The perfection degree of the approximate function model established, i.e. the response surface model, directly affects the optimization results. Therefore, it should be evaluated. Goodness of fit is usually used to measure the fitting degree of the response surface model to the experimental data [19]. The negative correlation coefficient varying within [0, 1] is the index to measure the correlation degree. The closer it is to 1, the less error it indicates, hence, the higher the response surface accuracy:
where is the square sum of the response value and the estimated response value while is the square sum of the difference between the response value and the average response value.
3.4. MOGA
In the process of actual engineering optimization, it often involves multiple parameters. This is the multi-objective optimization. These objectives are often inter-connected and restricted. The promotion of one target performance often leads to the decrease of other target performance. So there usually does not exist a singly optimal solution to realize all optimal indexes. Instead only a set of multiple optimal solutions can be reached, known as Pareto optimal solution set. The superiority of these optimal solutions cannot be compared with each other. The selection may require trade-offs and comprises among the criteria being considered [20]. MOGA takes optimal solutions in the feasible region as individuals in a population, and encodes them as chromosomal strings for selection, crossover and mutation. Through the population ranking and crowding distance calculation, on the basis of fitness, the individuals evolve from generation to generation to gradually approach the optimal solution [21]. MOGA provides an effective direct search method. It has been widely used since the global optimal method it furnished has strong applicability to solve big and complex optimization problems.
In the optimization of inkjet printer, weight reduction and promotion of the structure dynamic and static characteristics are inter-restricting. So it belongs to multi-objective optimization design problem. The optimization target is to reduce the inkjet printer weight as far as possible under the condition that mechanical structure of overall inkjet printer meets the requirements of both static and dynamic characteristics and the work performance. The MOGA is used to optimize the structure design of inkjet printer in this study.
4. Multi-objective optimization procedures based on response surface model
The basic idea of combining response surface model with MOGA is as follows: First, determine the design space, select sample points, and complete the initial response surface model fitting and optimization; In the following iterative process, decide whether to change the design space according to the results of optimization and restructure it when necessary; add more sample points and update the response surface model, then optimize it, continue the iteration when the optimization cannot meet the convergence. The process of building and optimizing one response surface model is called a loop. The specific steps of the optimal design approximation are as follows:
(1) Establish the mathematical model of the optimization problem.
(2) Select sample points using CCD.
(3) Calculate the response value of the samples selected in step (2) by FEA.
(4) Use the discrete data of step (3) to carry out the first fitting of the response surface model.
(5) Use genetic algorithm to optimize the response surface model in step (4) until the optimization reaches convergence by the criteria of the optimization algorithm.
(6) Establish the numerical simulation of the optimal solution obtained in step (5). If the optimization target value has not been improved, the initial point of the next loop sticks to previous optimization points.
(7) Check whether the loop satisfies the convergence condition, which is defined as the improved value of each objective function of adjacent two loops is less than a certain value:
where is the first variable target value obtained after loops while is the second variable target value. If it satisfies the conditions for convergence, the optimization of the model finishes. If it does not, move to step (8).
(8) Calculate the response surface error, namely the difference between objective function values in the numerical simulation and response surface model. If the difference is greater than a certain value, or the target values of this loop have not been improved, then reduce the optimization interval and increase experiment points, and update the response surface model. If the target values have been improved, and the design space lies in the allowable range, then increase optimization interval and increase experiment points, and update the response surface model. And then return to step (5). The optimization process is a repeated cycle, until the convergence condition in step (7) is satisfied.
The optimization interval will be changed after each loop. So design points have to be increased and the response surface model updated after each loop. The optimization technology does not focus on the precision of a particular response surface model in the design space, but on that of those are close the optimum solution. It locates the design space that contains the optimum solution through the loop optimization to obtain the optimum solution for the entire design space.
5. Optimization design of the inkjet printer
5.1. Problem description
The analysis of both the static and dynamic characteristics of the inkjet printer shows: a) under working condition, the inkjet printer’s maximum stress is 5.8365 MPa, far below the allowable stress. Thus the effect of stress on the structure can be neglected in the inkjet printer optimization; b) the maximum deformation is for 0.016584 mm, which occurs in the upper position of the inkjet head module (as shown in Fig. 6). For an electronic circuit printing equipment of high precision, it should be further optimized; c) the first two natural frequencies of the inkjet printer are 46.721 Hz and 49.26 Hz, very close to the motor excitation frequency 50 Hz. It indicates they may cause resonance in operation. Therefore the natural frequency should be optimized.
5.2. Establishment of optimum model
5.2.1. Objective function
Optimization objectives are to reduce the inkjet printer weight and to improve the structure’s first order natural frequency and static stiffness. Since the maximum deformation occurs in the upper position of the inkjet head module, the maximization of the static stiffness structure is equal to the minimization of deformation. Mathematical model of the multi-objective optimization design of inkjet printer is described as follows:
where is the inkjet printer weight, is the first order natural frequency, is the maximum deformation of inkjet head, is the design vector, and is the upper and lower value respectively, is the design variables and is its number.
At the same time, in order to ensure that the natural frequency of the structure can be far away from the excitation frequency of the motor, the constraint condition is imposed as:
where is the motor excitation frequency.
5.2.2. Design variables
The inkjet printer dimensions depend on the specification of the PCBs, which usually are generally fixed. This study selects 8 parameters as the design variables for optimization design as specified in Table 2. According to previous analysis, these 8 parameters sway relatively great influence on the static and dynamic characteristics of the inkjet printer.
Table 2Initial values of design variables
Design variable | Initial value (mm) | Value range (mm) | Description |
P1 | 100 | 90-110 | Thickness of table |
P2 | 100 | 90-110 | Length of column along axis |
P3 | 120 | 108-132 | Length of column along axis |
P4 | 215 | 193.5-236.5 | Length of column along axis |
P5 | 6 | 5.4-6.6 | Thickness of base’s column |
P6 | 3 | 2.7-3.3 | Thickness of base’s top beam |
P7 | 5 | 4.5-5.5 | Thickness of base’s bottom beam |
P8 | 20 | 18-22 | Length of base’s bottom beam along axis |
Fig. 8The sensitivity of target to output variables
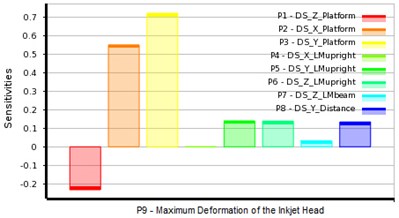
a) P9 – maximum deformation of the inkjet head
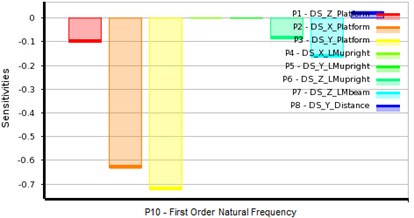
b) P10 – first order natural frequency
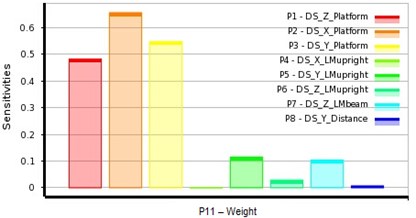
c) P11 – weight
5.2.3. The initial second order response surface model
For the polynomial response surface model fitting, the number of minimum experiment points is equal to the polynomial items. But it is general the case that the more the sample points are in the design space, the more accurate the response surface fitting is. So most optimization cases will choose more than double of the minimum experiment points. This study selected 8 design variables and 81 sample points. Then the response value of each sample was calculated by numerical simulation.
The effect of each design variable on the 3 output variables can be calculated by data statistics, as shown in Fig. 8. Design variables P3, P2 and P1 have great influence on the maximum deformation of inkjet head. But unlike p2 and p3, p1 has negative effect on the deformation. That is, the bigger p1 is, the less deformation occurs, thus the higher the stiffness is inkjet head. P3, P2, P7 and P1 are responsible for the change in the first order natural frequency. All these variables have negative correlation with the first order natural frequency, that is, when these design variables increase, the first order natural frequency decreases, hence the dynamic stiffness decreases. It can be explained that when these design variables increase, the bed weight increases and the gravity center of the inkjet printer goes higher. Design variables affecting the inkjet printer weight most are P1, P2 and P3.
To secure the accuracy of response surface, fitting curve was used to measure the model’s fitting precision. As shown in Fig. 9, sample points of the three optimization objectives (maximum deformation of the inkjet head, the first order natural frequency and inkjet printer weight) are located near the diagonal, that is, their multiple correlation coefficient approaches 1 and fitting degree of the response surface model is good.
Fig. 9Fitting curve
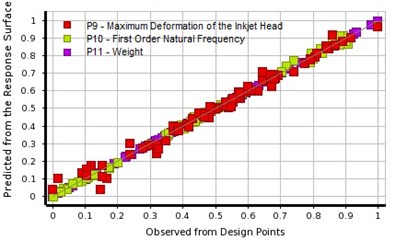
Table 3Comparison of conventional method and proposed method
Design variable | Original design | Conventional method | Proposed method |
P1 / mm | 100 | 93.52 | 90.01 |
P2 / mm | 100 | 106.72 | 109.53 |
P3 / mm | 120 | 117.1 | 108.01 |
P4 / mm | 215 | 207.32 | 193.52 |
P5 / mm | 6 | 5.45 | 5.9361 |
P6 / mm | 3 | 3.24 | 3.0402 |
P7 / mm | 5 | 5.16 | 4.6389 |
P8 / mm | 20 | 21.74 | 20.935 |
Maximum deformation of the inkjet head P9 / mm | 0.011788 | 0.00915 | 0.0078943 |
First order natural frequency P10 / Hz | 46.721 | 56.164 | 63.665 |
Weight P11 / Kg | 671.64 | 584.9 | 540.51 |
5.3. Optimization results and analysis
Cyclic approximation optimization technique of MOGA (NSGA-II) was applied to the optimization of the inkjet printer. Appropriate sample points were selected in the response surface model as initial samples for genetic algorithm. Here the number was set as 1000 and the calculation convergence criterion was 80 %. The maximum number of iterations was 20 while the three optimization objectives of maximum deformation of the inkjet head, the first order natural frequency and inkjet printer weight had the same weight ratio. Pareto optimal solution set was obtained after calculation as shown in Fig. 10. Table 3 compares one of the optimal solutions from the Pareto with the conventional optimization method.
Fig. 10Pareto optimal solution set of inkjet printer multi-objective optimization
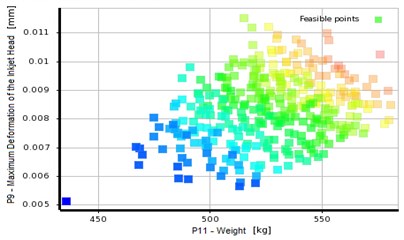
a) P9-P11
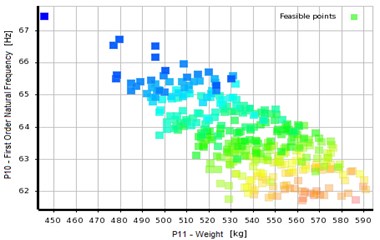
b) P10-P11
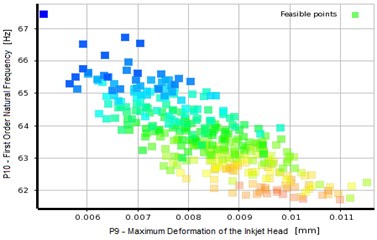
c) P10-P9
The optimization results reveal the inkjet printer weight reduces by 19.5 % and maximum deformation of the inkjet head decreases by 33 % after the multi-objective optimization of the column using response surface model. The first order natural frequency increases to 63.665 Hz, far from the servo motor excitation frequency 50 Hz. In addition, comparing with the conventional method, the optimal design method based on the response surface model is more reliable to obtain satisfactory results.
6. Conclusions
This paper proposes an optimization method combing response surface model with MOGA. It takes a certain type of printed electronics inkjet printer as an example, finds the parts that affect the static and dynamic performance of the printer, determines multi-objective optimization scheme, and establishes the initial response surface model of the three output variables for further calculation. The approximation optimization technique based on non-dominated sorting genetic algorithm is then adopted to complete the optimization calculation. The combination of response surface model and MOGA can realize global optimization of high accuracy. Comparing with the conventional optimization method, it has the virtue of high computational efficiency. The optimization method proposed in this paper is also applicable to the optimization of similar complex mechanical structures.
References
-
Gong Y. L. Printed electronics review (2). Printed Circuit Information, Issue 8, 2009, p. 12-17, (in Chinese).
-
Song R. The Research and Realization of Ink-Jet Printing Technology on All-Printed Electronics. South China University of Technology, 2012, (in Chinese).
-
Ye F. Development of Inkjet Detection System in Printed Electronic Inkjet Printer. East China University of Science and Technology, 2013, (in Chinese).
-
Yang Z. G. Research status, technical characteristic and industrialization prospect of printed electronics. Printed Circuit Information, Issue 1, 2010, p. 8-12, (in Chinese).
-
Tang X. F., Yang Z. G., Wang W. J. A simple way of preparing high-concentration and high-purity nano copper colloid for conductive ink in inkjet printing technology. Colloids and Surface A: Physicochemical and Engineering Aspects, Vol. 360, Issues 1-3, 2010, p. 99-104.
-
Tang Y. Research on Thermal Hydroforming Process of Aluminum Alloys. Hefei University of Technology, 2010, (in Chinese).
-
Wang G. G. Adaptive response surface method using inherited Latin hypercube design points. Journal of Mechanical Design, Vol. 125, Issue 2, 2003, p. 210-220.
-
Li N., Wang M. H., Ma S. G., et al. Mechanism-parameters design method of an amphibious transformable robot based on multi-objective genetic algorithm. Journal of Mechanical Engineering, Vol. 48, Issue 17, 2012, p. 11-20, (in Chinese).
-
Wang P., Zheng S. L., Wu G. Q. Multidisciplinary design optimization of vehicle body structure based on collaborative optimization and multi-objective genetic algorithm. Journal of Mechanical Engineering, Vol. 47, Issue 2, 2011, p. 102-108.
-
Zhao K. M., Chun B. K., Lee J. K. Finite element analysis of tailor-welded blanks. Finite Elements in Analysis and Design, Vol. 37, Issue 2, 2001, p. 117-130.
-
Yang X. D., Dong Z. M., Yang K., et al. Two scale analysis of elastic structures of particle reinforced composite materials with finite element method. Journal of Mechanical Engineering, Vol. 48, Issue 8, 2012, p. 34-38.
-
Ghosh S., Mukhopadhyay S. N. A material based finite element analysis of heterogeneous media involving Dirichlet tessellations. Computer Methods in Applied Mechanics and Engineering, Vol. 104, Issue 2, 1993, p. 211-247.
-
Tokhi M. O., Mohamed Z. Modeling of a flexible robot manipulator using finite methods: a symbolic approach. Journal of Low Frequency Noise Vibration and Active Control, Vol. 18, Issue 2, 1999, p. 63-76.
-
Schmitz T. L. Predicting high-speed machining dynamics by substructure analysis. CIRP Annals, Vol. 49, Issue 1, 2000, p. 303-308.
-
Matsumoto M., Abe J., Oda J. Structural optimization for configuration design of the motorcycle body. Proceedings of the 6th International Pacific Conference on Automotive Engineering, Vol. 2, Issue 10, 1991, p. 1399-1406.
-
Faravelli L. A response surface approach for reliability analysis. Journal of Engineering Mechanics, Vol. 115, Issue 12, 1989, p. 2763-2781.
-
Box G. E. P., Draper N. R. Experimental Model Building and Response Surfaces. John Wiley and Son, 1987.
-
Kok S., Stander N., Roux W. Thermal optimization in transient thermoelasticity using response surface approximations. International Journal for Numerical Methods in Engineering, Vol. 43, Issue 1, 1998, p. 1-21.
-
Chen X. G., Li W. H., Chen X., et al. Response surface methodology for optimization of small peptide preparation from paphia undulate meat by acid hydrolysis. Food Science, Vol. 32, Issue 21, 2011, p. 218-222, (in Chinese).
-
Deb K., Partap A., Agarwals S., et al. A fast and elitist multi-objective genetic algorithm: NSGA-II. IEEE Transactions on Evolutionary Computation, Vol. 6, Issue 2, 2002, p. 182-197.
-
Shi H. M., Chen J. H. The principle of genetic algorithm and its application in mechanical engineering. China Mechanical Engineering, Vol. 3, Issue 3, 1992, p. 18-21, (in Chinese).
About this article

This paper is supported by six talent summit foundation of Jiangsu Province, China (No. ZBZZ-038) and by the Jiangsu Overseas Research and Training Program for University Prominent Young and Middle-aged Teachers and Presidents.
