Abstract
Feature extraction has always been a significant research topic for in-situ fault diagnosis applications. In this research, measurement uncertainty of vibration signal is defined and extracted as a pre-processing step for statistical feature calculation. An Empirical Mode Decomposition (EMD) detrending method combined with hurst exponent criterion is applied to extract uncertainty. Decision tree and Least Square Support Vector Machine (LS-SVM) algorithms are introduced as statistical feature selector and classifier respectively. Misalignment, rub-impact, pedestal looseness as well as eccentricity faults are set on experimental rig in sequence for data collecting and to test the proposed method. As the diagnosis accuracy shows, the extracted uncertain components are more sensitive to rotor faults compared to original vibration signal. HE-EMD (Hurst Exponent-Empirical Mode Decomposition) is proved a rational tool to pre-process vibration signal for an enhanced diagnosis ability. This paper shows effectiveness of a multi-fault diagnosis method with uncertainty components as state indicator and thus provides new approaches for condition monitoring of rotating machinery.
1. Introduction
Non-stationary characteristics of monitoring signals are likely to be remarkable in many situations because of the complexity of rotating mechanics and time-variant running environment. In the last decades, series of adaptive signal analysis algorithms have been developed and widely applied to many in-situ applications, however, the adaptive ability is not powerful enough yet, this brings obstacles for users to give reasonable explanations to non-stationary phenomena. In order to enhance the analyzing practicability and effectiveness of multi-fault diagnosis approach, some advanced algorithms have been proposed, such as the statistical feature extraction method.
Statistical feature of vibration signal have been considered as useful mathematical measure and playing a key role in structural health monitoring (SHM) tasks [1-6]. In the last ten years, many statistical condition monitoring and multi-fault diagnosis applications have been accomplished and reported by researchers [7], the well-accepted way to perform this technique could be summarized by the following three steps: (1) Feature extraction based on domain transformation; (2) Feature selection based on sensitivity analysis; (3) Classification-based diagnosis with soft computing algorithms. In previous research, both “Vibration, Acoustic and Acoustic Emission” signal analysis techniques have been developed.
Vibration feature extraction based diagnosis technique has been widely used to monitor rotating machinery [8-15]. Baydar and Ball yielded satisfactory results by using wavelet transformation to detect gear failure [10]. Wavelet based monitoring method could also be found in [11] where Hurst exponent features are utilized as classification objects. The analysis ability of transformation methods depends on the similarity level between basis function (such as wavelet) and the analysis object, when these two are not fitted well, residue components will be generated inevitably and this leads to information loss. More importantly, it may directly produce a deteriorated diagnosis result. In Amarnath and Krishna’s research, severity of gear fault is evaluated successively based on statistical analysis of Empirical Mode Decomposition preprocessed signals [16]. V. Sugumaran et al. proposed a condition monitoring framework including statistical feature extraction and selection process [17, 18] to avoid this defect and also enhance the analysis ability. In their research, the decision tree algorithm is adopted to perform feature selection. This process offers an opportunity to gain analysis adaptability for non-stationary situations as it is independent of transformation function. For statistical feature extraction process, a pre-processing method called uncertainty extraction is proposed in our research to help select the most sensitive feature among all candidates and to further improve the diagnosis accuracy. With selected features, classification task could be accomplished by soft computing classifiers [15, 18]. Compared tos transformation based methods, statistical diagnosis approach is applicable to both stationary and strongly non-stationary fault classification problems.
Acoustic Emission (AE) analysis based diagnosis technique has also attracted researchers’ attention. Statistical features like spectral kurtosis, crest factor or wavelet coefficients are extracted as state indicator for machine condition monitoring [19-23]. Similar to acoustical emission signal processing, research about diagnosis methods with low and medium frequency acoustic signal have also been reported [24-28]. Frequency spectrum feature extraction and mutual information based feature selection processes are adopted for rotating machine state speculation. In both vibration and acoustic signal measurement process, as noticed by researchers, measurement uncertainty is ubiquitous and often unavoidable between each test. In order to indicate the uncertainty level as well as its effect on decision-making about the test, statistical features are calculated and provided along with the routine information of every test result.
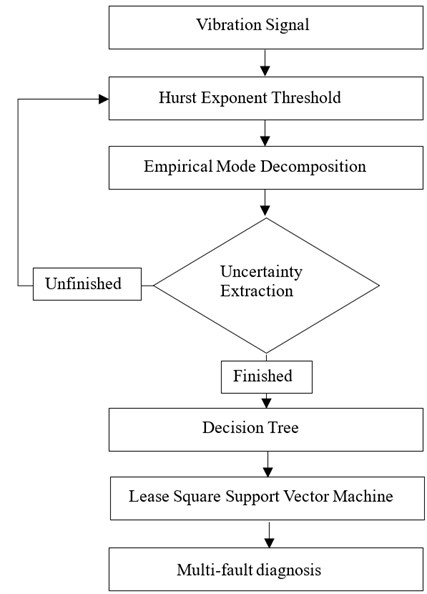
Fig. 1Uncertainty extraction based multi-fault diagnosis system
In this research, the uncertainty component is defined and expressed by Hurst Exponent. Some may confuse this with “noise” in testing, however, it is different and more general: according to the Hurst Exponent criterion, the uncertainty component is defined by “complexity” rather than higher frequency. For non-stationary situations, “complexity” is rational to define uncertainty components. As the certain components tend to be stable and hold a lower level of “complexity”, a threshold of Hurst Exponent is set for non-stationary signal processing method. Empirical Mode Decomposition is adopted to eliminate certain components, which is called “detrending” in this research, for in Empirical Mode Decomposition, the certain component is called “trend” term. The remaining part of original signal is defined “Uncertainty” because they all exceed the complexity threshold.
As shown by Fig. 1, the vibration uncertainty extraction based multi-fault diagnosis system is presented. Firstly, in Section 2, the experimental rig is described as well as the experiment details. In Section 3, statistics of vibration signal are discussed as candidates for feature selection. Hurst Exponent-Ensemble Mode Decomposition based uncertainty extraction method is proposed, a comparison between original and processed data is given as illustration in Section 4; Section 5 shows the Decision Tree based feature selection process; Section 6 describes LS-SVM based diagnosis method as well as the sensitivity results which proves effectiveness of proposed method.
2. Experimental rig
A schematic diagram of experiment rig for vibration measurement is shown in Fig. 2. Two balanced disks dimensioned 75 mm (OD) × 23 mm (thickness) are set on two shafts respectively. This system is comprised of two single disk rotors symmetrically arranged with shafts connected by a rigid coupling unit. Four oil lubricated journal bearings and supporters are mounted on stiff pedestals. The total length of two shafts is 0.6 m and the diameter is 10 mm. Rotary speed control for acceleration, deceleration and steady states is implemented by PC. With a first critical speed of 2000 RPM, experimental data are all collected when speed stabilizes at 4500 RPM. Five accelerometers are fitted to four pedestals and the shield. All sensors have a sampling frequency 4096 Hz for all training and testing datasets acquisition.
Fig. 2Experiment rig for vibration measurement
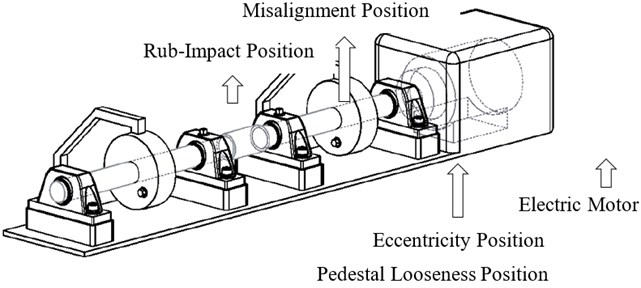
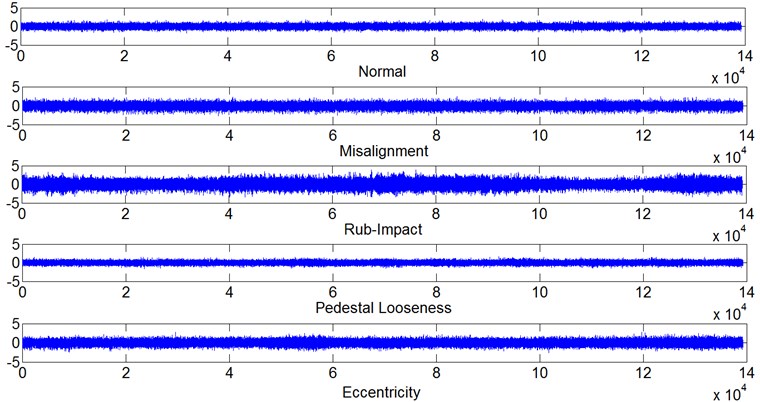
Faulty states discussed in this research include Normal, coupling Misalignment, Rub-Impact, Pedestal Looseness and Eccentricity. All of these states are set on experimental rig in sequence and tested for 10 times. As Fig. 2 shows, angular Misalignment fault is set by a coupling unit which connects two rotors; Rub-Impact fault is made by installing a screw on the mounting frame around the shaft which keeps an adjustable small clearance between the shaft and screw. Pedestal Looseness fault is set by retightened bolts between bearing house and pedestal, the manmade gap is also adjustable. Eccentricity fault is made by installing a 1.2 g weight screw on the disk of the rotor. Some typical vibration time series are given in Fig. 3.
3. Statistical feature extraction
The statistical feature extraction concepts and its usage in multi-fault diagnosis were discussed previously [12-14, 16, 17]. Herein, in order to detect rotor faults through analysis of uncertainty, statistical variables such as high order statistics, and crest factor, etc. are considered to be state indicator candidates in feature extraction process.
In this research, several statistics are calculated, they are: mean, skewness, kurtosis, min, max, median, mode, MAD (Mean/median absolute deviation), standard deviation, variance, etc. For vibration time series, abnormal behaviors could be detected by analyzing these features. In previous research [13], a feature selection method is applied to all calculated statistical features to pick out the most sensitive ones for classification. Their idea is intuitionistic, with fewer features, classification problem is a low-dimensional one, and classifier could give a better result. For classification problems, optimal feature does not exist, among all these candidates, some may be more sensitive to status compared to others. These sensitive attributes are supposed to be selected as the classification targets. In order to further simplify the classification problem, a pre-processing method called HE-EMD method is proposed and adopted. The corresponding idea could be elaborated as follows: Rotating machines in different status behave distinctively, as their monitoring signal, the vibration time series exhibit heavy non-stationary characteristics, especially for those rotors in abnormal status. HE-EMD method is adopted to extract non-stationary component, which is called “Uncertainty”, from original time series. For HE-EMD method divides original signal into two parts based on “complexity”, the more complex part is supposed to be the non-stationary components.
Fig. 3Vibration time series of rotor in several abnormal states
4. HE-EMD based uncertainty extraction
According to previous research, the mathematical definition of “Uncertainty” has been given by statistical expressions [29-31]. In this research, the non-stationary signal processing algorithm Empirical Mode Decomposition is adopted to decompose the original signal into series of non-stationary modes. For all intrinsic modes, Hurst Exponent will be calculated. A Hurst Exponent threshold is resorted to define “complexity” and quantify its “complex” level. For those components which exceed the threshold of “complexity”, for their non-stationary characteristic is sufficiently significant, their summation will be defined as the uncertainty component of the original signal. Considering the conservation characteristic of Empirical Mode Decomposition, this uncertainty extraction process will not produce fictitious results and is reasonable.
4.1. Hurst exponent criterion
Hurst Exponent is utilized as a criterion to differentiate data into two types: Random Walk and Noise. The most significant difference between them is the auto-correlation level [32-34]: with the increase of Hurst Exponent value, especially when exceeding 1, the auto-correlation characteristic becomes stronger, this means certainty fluctuation exists and dominates the time series. As these certainty fluctuations have less influence on non-stationary characteristic, eliminating them from original signal will help further reduce information redundancy before feature extraction process. In this research, time series with value under 1 are considered as uncertain components and feature extraction targets. The Hurst exponent formulations pair are defined by the following 5 equations:
where is the th point in data series, is the statistical mean, is the segment length of when is segmented. is the number of segments.
After calculating Hurst Exponent of experimental data, values of normal and abnormal datasets are all found below 1:0.7147 for normal data and 0.3655, 0.4859, 0.7571, 0.6388 for abnormal data respectively. For any data segment, value greater than or even close to 0.5 still reflects “long-range dependence”, in this case, a pre-process of “detrending” is a proposed for uncertainty extraction to enhance its significance.
4.2. EMD detrending
In order to obtain uncertainty component of original signal, Empirical Mode Decomposition algorithm is applied to detrend the time series. According to [35], this algorithm decomposes original data into several additive non-stationary components, each component represents a specific mechanism.
Steps of Empirical Mode Decomposition algorithm are listed as:
(1) is input into program;
(2) Extract the IMF (Intrinsic Mode Function) (1,…, );
(3) Calculate the local extrema function;
(4) Interpolate and produce envelops;
(5) Calculate the mean;
(6) Update residue and iteration of (1)-(5);
(7) Until decomposition finishes and get ( stands for number of IMF).
After times of iteration, original signal can be decomposed into IMFs and a residue , which is the trend of . A threshold of Hurst Exponent 0.5 is referred for uncertainty extraction. Those Intrinsic Mode Functions with Hurst Exponent greater than 0.5 will be removed. The remaining Intrinsic Mode Functions with Hurst Exponent less than 0.5 will be added up to “Uncertainty” component of the dataset.
The vibration signal is collected repeatedly on a cascade rotor system, with different manmade faults: coupling Misalignment, Rub-Impact, Pedestal Looseness and Eccentricity. Empirical Mode Decomposition detrending is applied to the vibration datasets. Through this detrending process, uncertainty components are “brought to the front” and thus dominating the processed time series which makes them more sensitive to abnormal states.
4.3. Vibration measurement uncertainty
In this research, Hurst Exponent is calculated for all original datasets as well as the corresponding detrended ones to exhibit their uncertainty level. A comparison is illustrated in Table 1 as a support of HE-EMD method, for after detrending, the uncertainty level shows a significant change. The uncertain level calculation is referred to Eqs. (1)-(5).
According to Table 1, it is clear that after HE-EMD detrending, uncertainty level of these time series, normal and abnormal ones, increases significantly ( value decreases). This difference reveals that the proposed detrending method effectively enhances the significance of uncertainty. However, the effect of the detrending process on feature selection and extraction is still pending, it is discussed in the next section by decision tree algorithm.
Table 1Uncertainty level of original and detrended data
State | ||
Original | Detrended | |
Normal | 0.7147 | 0.3498 |
Misalignment | 0.3655 | 0.3618 |
Rub impact | 0.4859 | 0.3776 |
Pedestal looseness | 0.7571 | 0.3435 |
Eccentricity | 0.6388 | 0.3270 |
5. Decision tree based feature selection
To simplify the classification problem and ensure a stable diagnosis rate, the most sensitive statistics are selected from all feature candidates. Data mining technique is utilized. Decision tree is an information gain based algorithm generally used in previous research [12-14, 17, 18, 36]. Two relevant variables named information entropy and information gain function are defined as:
where is number of classes, is the possibility of belonging to th class. And information gain function measures value variation of entropy after whole training data set partitioned by feature . is set of possible values of feature . is the subset of when feature has value .
In this case, all statistical features listed in Section 3 are calculated for 80 segments of each 5 states (total 400 segments). These features are input to decision tree algorithm and the output is the decision rules. Based on following analysis and comparison, the most sensitive features will be selected. Two important feature selection rules are listed below:
(1) From top to bottom, the importance of statistical feature is descending, but all features appear in decision tree (wherever near leaf or root) will be selected. To ensure no information loss, those less important features (near leaf) are also included;
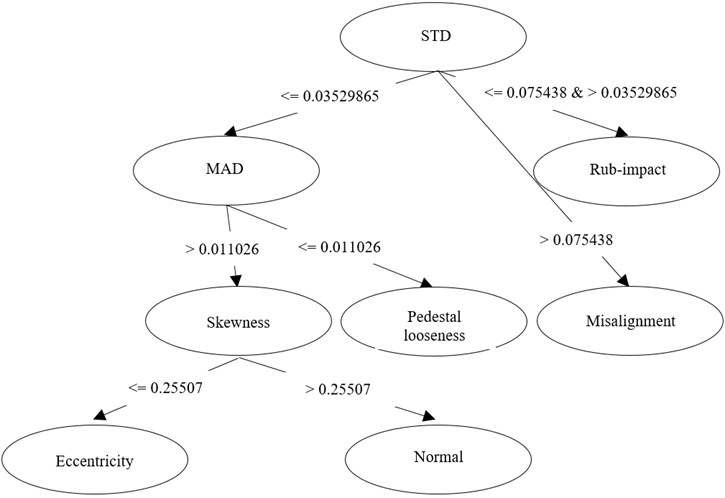
(2) For the same dataset, simpler decision rules or tree structure (as shown by Fig. 6) is preferred because fewer statistical features will be selected (5 in Figs. 4-5 but only 3 in Fig. 6).
Three decision trees generated from original, trend and detrended data (uncertainty data) are shown in Fig. 4, Fig. 5 and Fig. 6.
Fig. 4Decision tree of original vibration data
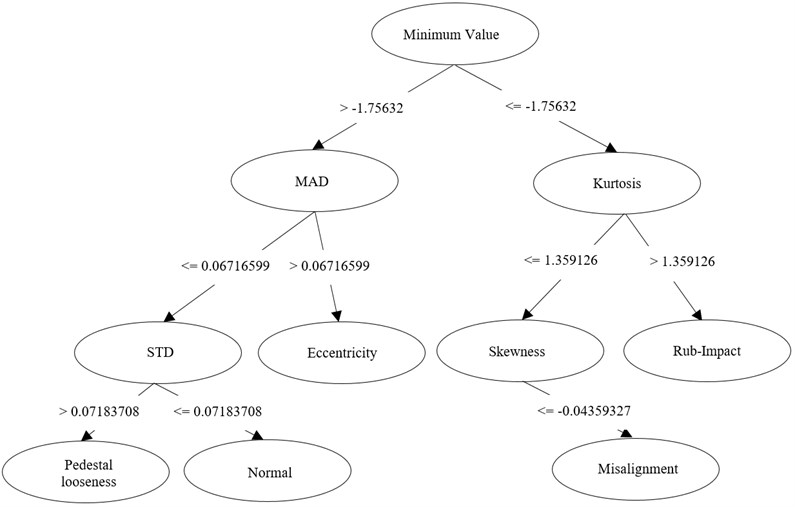
Fig. 5Decision tree of trend (certain) component
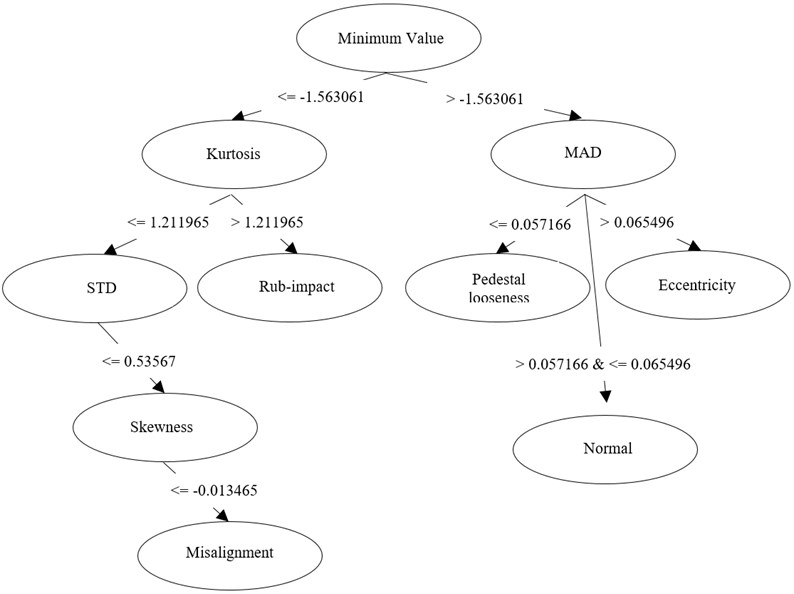
(1) Minimum value is the most important feature for original and trend data because it separates all segments into two main categories. For these two types of data, 5 statistical features as: Minimum value, Kurtosis, MAD, STD and Skewness are sensitive features for states indication.
(2) Compared to original and trend data, decision tree of detrended data is succinct as shown in Fig. 6. The simplified tree structure leads to a reduced feature set, consequently, only three features as: STD, MAD, Skewness are selected. In following part of classification, these three-dimensional-vectors of each data segment will be classified for multi-fault diagnosis.
After enhancing significance of uncertainty by the novel “Hurst Exponent-Ensemble Mode Decomposition” method, information redundancy is reduced. It is beneficial for classification.
Fig. 6Decision tree of uncertain component
6. LS-SVM based multi-fault diagnosis
After decision tree based selection process, these features will be classified by classifier in order to infer the rotor state. As reported by state-of-art research, a Least Square Support Vector Machine classifier is chosen to perform classification of statistical feature vectors because of its ability to solve problems with enormous data samples, meanwhile keeping classification on time because of less iteration [37-39].
6.1. Least square twin support vector machine
Standard C-SVM (Soft-Margin Support Vector Machine) formulations are given by following Eq. (8) and Eq. (9):
where the training set includes input patterns and class labels . is the total number of training samples. and stand for the classification surface coefficients. is the penalty factor, is the slack variable. Both are defined for non-separable data classification.
In Least Square Support Vector Machine (LS-SVM) formulations, inequality constrain Eq. (9) is replaced by the equality constrain:
where is the tuning parameter. is the least square error.
According to [37], when handling with large datasets, comparable classification accuracy and considerably lesser computational time could be easily obtained with LS-SVM algorithm. Hence in this research, it is applied to classification for multi-fault diagnosis.
6.2. Training and testing
The LS-SVM classifier is trained by 5 groups of 400 feature data (5 dimensional vectors for original/trend data and 3 dimensional vectors for detrended data) generated by rotor experiment rig. Radial Basis Function kernel function is selected. After Coupled Simulated Annealing optimization, the value of optimal kernel parameter is 1.49, and the value of optimal regularization parameter is 25.1. In order to prove effectiveness of the proposed method, the trained classifier is tested by 4000 feature data. With this 10 fold testing result, diagnosis rate is calculated and a table of accuracy is shown by Table 2. The definition of Sensitivity and Specificity are given as follows:
where True positive value is the number of samples detected correctly; False negative value is the number of samples detected falsely. True negative value is the number of samples correctly rejected and False positive value is the number of samples incorrectly rejected.
For fault diagnosis, it is a priority to set sensitivity of all faulty states in the first place because it is about risk control and preventing disasters. As shown in Table 2, the diagnosis rate given by LS-SVM classifier based on extracted uncertainty data is better than classification result on original data. This comparison shows that uncertainty extracted from original data is correspondingly more sensitive to specific rotor faults than original data. This could be explained as the long-term correlative components may lead to information redundancy which hampers statistical feature classification.
Table 2Diagnosis accuracy by LS-SVM classifier
Rate | State | ||||
Normal | Misalignment | Rub-impact | Pedestal looseness | Eccentricity | |
Original data | |||||
Sensitivity | 82.5 % | 81.3 % | 57.5 % | 73.4 % | 75 % |
Specificity | 84.9 % | 87.9 % | 94.3 % | 94.5 % | 93.5 % |
Uncertainty extracted data | |||||
Sensitivity | 97.4 % | 96.2 % | 97.5 % | 97.5 % | 98.7 % |
Specificity | 99 % | 98.3 % | 97.9 % | 98.1 % | 99 % |
7. Conclusions
Measurement uncertainty of vibration signals was extracted to develop a pre-processing method for rotor multi-fault diagnosis. The method of Hurst exponent combined with empirical mode decomposition method to extract uncertainty from original vibration signal was proposed. Decision tree based feature selection was performed with uncertainty data. A multi-fault diagnosis system was constructed, trained and tested with generated statistical feature vectors. Both the Misalignment, Rub-impact, Pedestal Looseness as well as Eccentricity fault of the system were studied experimentally. Based on these investigations, the following significant factors affecting statistical multi-fault diagnosis approach are found.
1) When rotor system exhibits abnormal motions, measurement uncertainty is sensitive to specific faults compared to original vibration signal. To perform multi-fault diagnosis, statistical features are calculated as state indicators.
2) The existence of trend components (or say certain component) lead to diagnosis rate decrease in statistical fault diagnosis because of information redundancy. Empirical mode decomposition is utilized to extract uncertain components adaptively while Hurst exponent coefficient is available to measure uncertainty degree and used as threshold for uncertainty definition.
3) Based on comparison between results of three decision trees generated, it is found that the number of variables could be reduced by HE-EMD method which benefits fault diagnosis.
4) With selected sensitive features, a better diagnosis rate is obtained by LS-SVM classifier on uncertainty data. This attractive characteristic of uncertainty data exhibits its better sensitivity to rotor faults.
This research reveals some inherent characteristics about measurement uncertainty of a rotor system. With a “complexity” understanding of such characteristics, uncertainty data can be extracted and classified as an improvement of fault diagnosis performance. The statistical features such as standard deviation, MAD and skewness were discussed and concluded that they could be considered as indicators of corresponding vibration time series. Additionally, it is planned for us to adopt the proposed method to composite-fault diagnosis applications.
References
-
Tarassenko L., Clifton D. A., Bannister P. R., King S., King D. Novelty Detection. John Wiley and Sons Ltd., Encyclopedia of Structural Health Monitoring, 2009.
-
Saravanan N., Siddabattuni V. N. S. K., Ramachandran K. I. A comparative study on classification of features by SVM and PSVM extracted using Morlet wavelet for fault diagnosis of spur bevel gear box. Expert Systems with Applications, Vol. 35, Issue 3, 2008, p. 1351-1366.
-
Saravanan N., Cholairajan S., Ramachandran K. I. Vibration-based fault diagnosis of spur bevel gear box using fuzzy technique. Expert Systems with Applications, Vol. 36, Issue 2, 2009, p. 3119-3135.
-
Saravanan N., Siddabattuni V. N. S. K., Ramachandran K. I. Fault diagnosis of spur bevel gear box using artificial neural network (ANN), and proximal support vector machine (PSVM). Applied Soft Computing, Vol. 10, Issue 1, 2010, p. 344-360.
-
Li W., Zhu Z. C., Jiang F., Zhou G. B., Chen G. A. Multi-fault diagnosis of rotating machinery with a novel statistical feature extraction and evaluation method. Mechanical Systems and Signal Processing, Vol. 50, 2015, p. 414-426.
-
Wong M. L. D., Jack L. B., Nandi A. K. Modified self-organizing map for automated novelty detection applied to vibration signal monitoring. Mechanical Systems and Signal Processing, Vol. 20, Issue 3, 2006, p. 593-610.
-
Mehrjou M. R., Mariun N., Marhaban M. H., Misron N. Rotor fault condition monitoring techniques for squirrel-cage induction machine – a review. Mechanical Systems and Signal Processing, Vol. 25, Issue 8, 2011, p. 2827-2848.
-
Sejdi E., Djurovi I., Jiang J. Time–frequency feature representation using energy concentration: an overview of recent advances. Digital Signal Processing, Vol. 19, Issue 1, 2009, p. 153-183.
-
Ming Y., Chen J., Dong G. Weak fault feature extraction of rolling bearing based on cyclic Wiener filter and envelope spectrum. Mechanical Systems and Signal Processing, Vol. 25, Issue 5, 2011, p. 1773-1785.
-
Baydar N., Ball A. Detection of gear failures via vibration and acoustic signals using wavelet transform. Mechanical Systems and Signal Processing, Vol. 17, Issue 4, 2003, p. 787-804.
-
Du W. L., Tao J. F., Li Y. M., Liu C. L. Wavelet leaders Hurst exponent features based multi-fault diagnosis of rotating mechanism. Mechanical Systems and Signal Processing, Vol. 43, Issue 1, 2014, p. 57-75.
-
Sugumaran V., Ramachandran K.I. Effect of number of features on classification of roller bearing faults using SVM and PSVM. Expert Systems with Application, Vol. 38, Issue 4, 2011, p. 4088-4096.
-
Sugumaran V., Muralidharan V., Ramachandran K. I. Feature selection using decision tree and classification through proximal support vector machine for fault diagnostics of roller bearing. Mechanical Systems and Signal Processing, Vol. 21, Issue 2, 2007, p. 930-942.
-
Jegadeeshwaran R., Sugumaran V. Fault diagnosis of automobile hydraulic brake system using statistical features and support vector machines. Mechanical Systems and Signal Processing, Vol. 52, 2015, p. 436-446.
-
Batista L., Badri B., Sabourin R., Thomas M. A classifier fusion system for bearing multi-fault diagnosis. Expert Systems with Applications, Vol. 40, Issue 17, 2013, p. 6788-6797.
-
Amarnath M., Krishna I. R. P. Local fault detection in helical gears via vibration and acoustic signals using EMD based statistical parameter analysis. Measurement, Vol. 58, 2014, p. 154-164.
-
Sugumaran V., Muralidharan V., Ramachandran K. I. Feature selection using decision tree and classification through proximal support vector machine for fault diagnostics of roller bearing. Mechanical Systems and Signal Processing, Vol. 21, Issue 2, 2007, p. 930-942.
-
Muralidharan V., Sugumaran V. A comparative study of Naïve Bayes classifier and Bayes net classifier for multi-fault diagnosis of monoblock centrifugal pump using wavelet analysis. Applied Soft Computing, Vol. 12, Issue 8, 2012, p. 2023-2029.
-
Mba D., Rao R. B. K. N. Development of acoustic emission technology for condition monitoring and diagnosis of rotating machines: bearings, pumps, gearboxes, engines, and rotating structures. The Shock and Vibration Digest, Vol. 38, Issue 1, 2006, p. 3-16.
-
Mba D. Acoustic emissions and monitoring bearing health. Tribology Transactions, Vol. 46, Issue 3, 2003, p. 447-451.
-
Sikorska J. Z., Mba D. Challenges and obstacles in the application of acoustic emission to process machinery. Proceedings of the Institution of Mechanical Engineers, Part E: Journal of Process Mechanical Engineering, Vol. 222, Issue 1, 2008, p. 1-19.
-
Eftekharnejad B., Carrasco M. R., Charnley B., Mba D. The application of spectral kurtosis on Acoustic Emission and vibrations from a defective bearing. Mechanical Systems and Signal Processing, Vol. 25, Issue 1, 2011, p. 266-284.
-
Chetwynd D., Worden K., Spencer A., Hensman J. The effects of uncertainties within acoustic emission modelling. Proceedings of the International Model Analysis Conference, 2008, p. 1174-1185.
-
Amarnath M., Sugumaran V., Kumar H. Exploiting sound signals for multi-fault diagnosis of bearings using decision tree. Measurement, Vol. 46, Issue 3, 2013, p. 1250-1256.
-
Rekanos I. T., Hadjileontiadis L. J. An iterative kurtosis-based technique for the detection of non-stationary bioacoustic signals. Signal Processing, Vol. 86, Issue 12, 2006, p. 3787-3795.
-
Scanlon P., Lyons A. M., O’Loughlin A. Acoustic signal processing for degradation analysis of rotating machinery to determine the remaining useful life. IEEE Workshop on Applications of Signal Processing to Audio and Acoustics, 2007, p. 90-93.
-
Kavanagh D. F., Scanlon P., Boland F. Envelope analysis and data-driven approaches to acoustic feature extraction for predicting the remaining useful life of rotating machinery. IEEE International Conference on Acoustics, Speech and Signal Processing, 2008, p. 1621-1624.
-
Scanlon P., Bergin S. Using support vector machines and acoustic noise signal for degradation analysis of rotating machinery. Artificial Intelligence Review, Vol. 28, Issue 1, 2007, p. 1-15.
-
Eidukeviciute M., Volkovas V. Measurement uncertainty in vibromonitoring systems and diagnostics reliability evaluation. Journal of Sound and Vibration, Vol. 308, Issue 3, 2007, p. 625-631.
-
Adhikari S., Friswell M. I., Lonkar K., Sarkar A. Experimental case studies for uncertainty quantification in structural dynamics. Probabilistic Engineering Mechanics, Vol. 24, Issue 4, 2009, p. 473-492.
-
Soize C. Stochastic modeling of uncertainties in computational structural dynamics-recent theoretical advances. Journal of Sound and Vibration, Vol. 332, Issue 10, 2013, p. 2379-2395.
-
Ihlen E. A. F. Introduction to multifractal detrended fluctuation analysis in Matlab. Frontiers in Physiology, p. 3-2012.
-
Ihlen E. A. F. Multifractal analyses of response time series: a comparative study. Behavior Research Methods, Vol. 45, 2013, p. 928-945.
-
Ihlen E. A. F. The influence of power law distributions on long-range trial dependency of response times. Journal of Mathematical Psychology, Vol. 57, 2013, p. 215-224.
-
Huang N. E., Shen Z., Long S. R., Wu M. C., Shih H. H., Zheng Q. A., Yen N. C., Tung C. C., Liu H. H. The empirical mode decomposition and the Hilbert spectrum for nonlinear and non-stationary time series analysis. Proceedings of the Royal Society of London. Series A: Mathematical, Physical and Engineering Sciences, Vol. 454, Issue 1971, 1998, p. 903-995.
-
Quinlan J. R. Induction of decision trees. Machine Learning, Vol. 1, Issue 1, 1986, p. 81-106.
-
Suykens J. A. K., Vandewalle J. Least squares support vector machine classifiers. Neural Processing Letters, Vol. 9, Issue 3, 1999, p. 293-300.
-
Vong C. M., Wong P. K. Engine ignition signal diagnosis with wavelet packet transform and multi-class least squares support vector machines. Expert Systems with Applications, Vol. 38, Issue 7, 2011, p. 8563-8570.
-
Su Z., Tang B., Liu Z., Qin Y. Multi-fault diagnosis for rotating machinery based on orthogonal supervised linear local tangent space alignment and least square support vector machine. Neurocomputing, Vol. 157, 2015, p. 208-222.
About this article

The research described in this paper is fully supported by the Aviation Science Fund of China (Grant No. 2012ZD52054) and the open project of State Key Laboratory for Strength and Vibration of Mechanical Structures (SV2015-KF-01). Also supported by Funding of Jiangsu Innovation Program for Graduate Education (Grant No. CXZZ13_0180) and the Fundamental Research Funds for the Central Universities (No. NZ2015103).
The authors would thank Dr. Yeping Xiong of Fluid Structure Interaction Group, University of Southampton, UK, for her contributions to this study. The authors also would like to thank the China Scholarship Council for supporting the first author of this paper while studying abroad.
