Abstract
The noise in the industrial companies is caused by operation of the mechanisms and equipment and during various technological operations. The effect of these excitation sources on the acoustic field is very different and the control of these processes with a purpose to reduce the noise is usually very complicated and sometimes impossible. The main objective of this work was to analyze how the FE and analytical models synergy uses such type of tasks. Using the described methodology, which is based on consistent application of numerical and analytical models, and the limited experimental research data can significantly reduce the costs of investigation for the study and evaluation of acoustic fields generated by a variety of sources in closed technical space.
1. Introduction
For many years, noise has been identified as one of the main issues of environmental pollution and it has been compared to air, water or soil pollution. The noise in the industrial companies is caused by operation of machinery and equipment during various technological operations. The effect of these excitation sources on the acoustic field can by very different, and the control of these processes to reduce noise is usually very complicated and sometimes impossible. That's why this problem is usually solved by using passive noise dampening systems which are based on sound wave absorption, diffraction and transmission losses, including the reduction of vibration. Therefore, in order to reduce the noise effectively in various technical environments using the passive method [1-4], the modeling of the interaction of real object with the acoustic medium is necessary.
One of the most widely used methods to create the acoustic models is the finite elements method (FEM). When this method is used, the wave equation is being solved (with regard to the boundary conditions) by dividing the space (in certain cases the time, too) into the elements. Then the wave equation is expressed by the discrete set of the linear equations for these elements. The FE method can be used to model the transfer of energy between separate surfaces, or energy exchange. The advantage of this method [5, 6] is that it can provide a direct relation between the structural and acoustic mediums, and under changing modeled environmental conditions, evaluate their interaction, which is very important for formation of acoustic partition systems. It may be noted that one of the disadvantages of this method is that when the modeled environment is large and the amount of excitation changes, the model has to be recreated again, and this usually requires a lot of time [7], while the tasks solved for closed spaces are formed covering a wide range of frequencies. When analytical acoustic models are considered, it is possible to state that they are more universal. However, they describe the interaction of the acoustic medium and structure approximately, approaching it more empirically [8]. The acoustic field modeled by them is diffusive, while the excitation source is a point source.
Thus, when exploring noise reduction possibilities in large, closed technical areas, where several noise sources may exist covering a wide range of frequencies, if a diffusive [9] and direct acoustic field [10] is present, analytical and FE methods cannot achieve the desired result if used separately. Therefore, the main purpose of this work was the use of the synergy between FE and analytical models to solve these types of challenges. Thus with regard to the aforementioned, the tasks of this work were:
• By using analytical and FE methods, to create a model which allows an evaluation of the acoustic parameters within any large closed technical area under variable operating conditions;
• To analyze the adequacy of this theoretical model for real fields and its application possibilities for designing mobile and controlled systems of noise reduction.
2. Modelling of the acoustic field of a noise source
In order to adequately reproduce the acoustic field in a technical environment, modeling of the acoustic excitation is very important. The variety of equipment operated in technical environments requires a separate study of the acoustic parameters of each source because of the differences in their frequency range and radiated power [11]. This work modelled the noise emitted by a turbocharger (see Fig. 1(a)). For this purpose, when measuring its sound intensity, the loudest (most extreme) zones of the turbocharger were measured. Sound intensity measurements were performed on a virtual measured surface (of cuboid shape) divided into segments surrounding the noise source as shown in Fig. 1(b). The identification of the extreme zones of the noise source was performed by using a PULSE 3560 microphone system, type 3599 and software 7752. The noise intensity was measured in five longitudinal sections, and the intensity at each measurement point (see Fig. 1(b)) was determined by using the following expression:
where – intensity of sound, – air pressure in a certain point in space, – velocity of an air particle.
Fig. 1a) Overall view of the turbocharger and b) intensity measurement surface divided into segments and zones indicated by arrows as having the highest levels of noise emission (1, 2, 3, 4, 5)
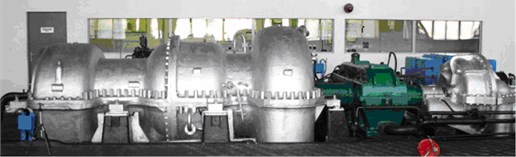
a)
b)
When analysing the measurement results, the zones with the highest levels of noise emission (extreme zones) were identified, which are designated in Fig. 1(b) by arrows: the end of the axial compressor by the oil pump in the central part (position 1), in the axial compressor and gas turbine connection surface area (position 2), by the reducer (position 3) and by the air press (positions 4, 5).
Identical noise measurements were performed on all eight turbochargers in the machinery room of the compression department. The limit values of the measured noise intensity and pressure levels in the highest noise emission zones of the turbochargers are provided in Table 1.
Table 1Noise levels of the turbochargers zones
Noise measurement place | Noise level, dB | |
Intensity | Pressure | |
End of the axial compressor, position 1 | 89-112 | 101-119 |
Connection point of the compressor and gas turbine, position 2 | 93-102 | 100-106 |
By the reducer, position 3 | 89-102 | 99-105 |
By the air press, positions 4, 5 | 98-112 | 105-113 |
The data of the turbocharger noise emission analysis was used to create a theoretical 2D source model by using the finite elements method. The excitation source was modelled by marking out five circular zones in the acoustic medium, whose measurements corresponded to the extreme zones of the turbochargers: axial compressor, gas turbine, reducer and air press. Certain acoustic pressure values were set in these zones. As established [12], the intensity describing the direction of the acoustic power and sound pressure are related:
were – sound power intensity, – acoustic power, – surface area through which the acoustic power passes during a certain period of time, – sound pressure at a certain point, – air density, – speed of sound wave.
The sound pressure values had to be chosen so that the acoustic power of each turbocharger as well as its direction corresponded to the experimentally determined values. For this purpose, an optimisation analysis was performed, whose objective function was defined as the acoustic power emitted by the turbocharger; the condition variables – acoustic intensity in the directions of front, back, left and right planes; the design variables – sound pressure values in the extreme zones. To perform the optimisation analysis, the subproblem approximation method [13] was used, whereby the minimisation of the approximated, penalty functions is performed during each iteration. By using the penalty functions in this manner, the following are minimised:
where – penalty function of design variable, , , , – condition variables: acoustic intensity in the directions of the front, back, left and right planes, respectively (Fig. 1(b)), , , ir – the penalty functions of condition variables in the directions of front, back, left and right planes, respectively, – the value of objective function, – the approximated value of objective function, – the objective function, – the response surface parameter.
The optimisation analysis allowed the determination of the design variables – the sound pressure levels in the extreme zones of each turbine.
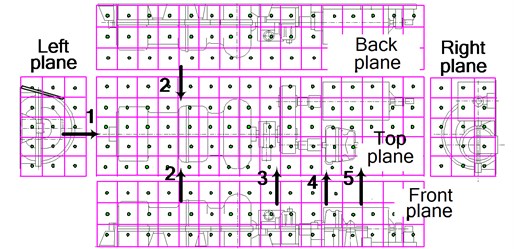
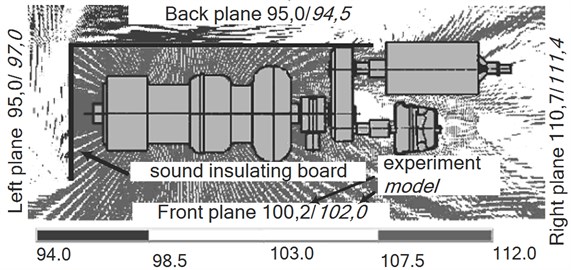
An experiment was performed to verify the adequacy of the modelled excitation source. During the experiment, the acoustic field of the turbocharger was measured during its operation without the sound-absorbing panels, and again when the highest sound emission zone of the turbocharger by the axial compressor was surrounded with panels. The sound levels were calculated in four directions. The division of the measured surface into segments is shown in Fig. 1(b), while the layout of the sound-absorbing panels is shown in Fig. 2.
The sound intensity level values, experimentally measured and theoretically calculated by the modelled excitation sources, are shown in four directions in Fig. 3 with the help of the FEM model.
Fig. 2The layout of the sound-absorbing panels surrounding the turbocharger
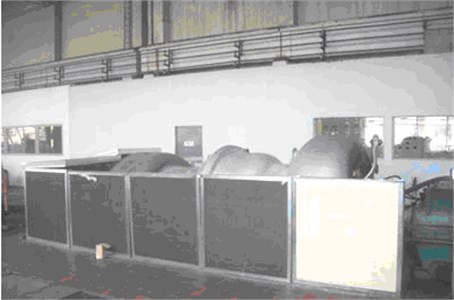
Fig. 3a) Sound pressure level calculated on the grounds of the FEM in the area of the open turbocharger, and b) sound pressure level when it is partially surrounded by sound-absorbing panels, and the sound intensity (dB) in different directions determined with the help of the experiment and the model
a)
b)
The results of the study on the acoustic field of the modelled noise source show that the compiled FE model adequately represents the restoration of the acoustic field’s intensity change of the of the turbocharger during operation, and allows the measurement of its acoustic power when sound-absorbing materials are used. When measuring the sound intensity level between the turbocharger with and without the sound-absorbing panels, it is clear that in the first case, the intensity decreases by 14 % in the direction of the front and back planes.
3. A feasibility study for the application of the synergy of the FEM and analytical models
In order to determine the acoustic parameters at any point within the large closed technical area during the operation of the line equipment, and to also evaluate the efficiency of the sound-absorbing panels used, a finite elements and analytical model was compiled, its adequacy was verified experimentally and a numerical experiment was performed.
The first stage of the theoretical study involved the modelling of the acoustic field of each excitation source in its environment, including its acoustic power and intensity according to the experimental measurement results by using the FEM. The acoustic excitation of each source was calibrated by using the method described in the first section. Then, the acoustic power change in the acoustic field of each excitation source (turbocharger) was calculated by using the model while it was surrounded by sound-absorbing panels according to the scheme in Fig. 2. The data received from the numerical modelling was used to calculate the cumulative sound pressure level at a point within the closed technical environment by the analytical method.
The analytical expression, according to which the sound pressure level at the point in question was calculated, given the acoustic power of the source, is [14]:
where, – sound pressure level; – sound source power during operation after being surrounded by panels as per Fig. 2; – sound source direction factor, determined by the FE method; – room constant; and – distance from the excitation source to the point in question, at which the sound pressure level is calculated. The cumulative sound pressure level at the point in question, after assessing all the acoustic excitation sources, was calculated by applying the superposition principle.
The theoretical calculations were verified experimentally by performing sound pressure level measurements at certain points within the turbocharger workshop. The principal scheme of the measurement points, their numbering and how they were surrounded by sound-absorbing panels is shown in Fig. 4. Here, index of point indicates the turbocharger number, while – the measuring location.
Fig. 4The principal scheme of the sound pressure level measurement points along the machinery hall, and when surrounded (A) by sound-absorbing panels
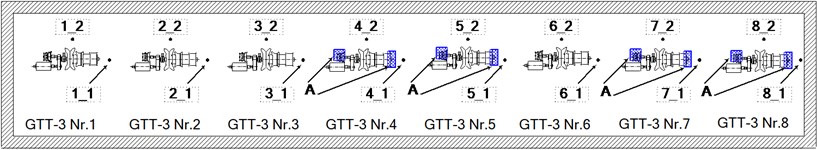
Measurements were taken along the machinery hall next to all eight turbochargers at a height of 1.5 m, by the axial compressor, and at the middle of the equipment along the front plane. During the experiment, turbocharger GTT-3 No. 6 was inoperable and the ends and air presses of the axial compressors of turbochargers GTT-3 No. 4, No. 5, No. 7 and No. 8 were surrounded by sound-absorbing panels. The comparison of the resulting experimental data with the data calculated by the FEM and analytical model is provided below.
The results of the theoretical-experimental study indicate that the sound pressure levels calculated by using the FEM and analytical model along the machinery hall correspond to the measured levels within 3 %. The nature of the theoretically determined sound pressure changes along the machinery hall corresponds to the experimental one. Fig. 5 shows that the largest decrease in sound was by the axial compressors of turbocharger No. 5.
The lowest sound pressure level in the turbocharger zone was that taken along the middle of the front plane by the 6th turbocharger, Fig. 6.
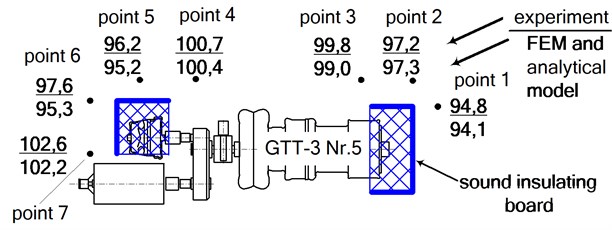
The correspondence of the theoretical calculations to the experimental results is shown by the sound pressure levels in the turbocharger environment, when the turbocharger was surrounded by sound-absorbing panels during operation (Fig. 7).
Fig. 5Average sound pressure levels along the machinery hall next to the axial compressors
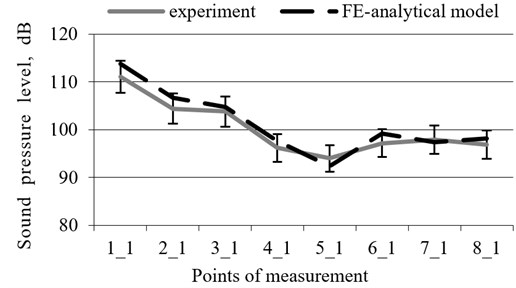
Fig. 6Average sound pressure levels along the machinery hall at the middle of the turbochargers taken along the front plane
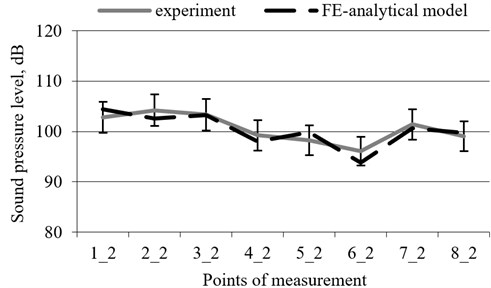
Fig. 7The values of sound pressure level in environment of turbocharger measured and determined with help of FE-analytical model
4. Conclusions
An FEM and analytical model was designed, which allowed the adequate modelling of the multi-source acoustic excitation arising during equipment operation in order to evaluate the acoustic parameters at any point within a large closed technical area.
The results of the experimental study on the adequacy of the FEM and analytical model indicate that the model can be applied to design sound-absorbing systems in large closed technical environments.
The results indicate that when using the described methodology, based on the consistent application of the FEM and analytical models, as well as the data of the limited experimental study, and thanks to the high adequacy of the compiled models, it is possible to significantly reduce operating costs by using an analysis of the spatial acoustic fields generated by line sources and an evaluation thereof by numerical methods. Therefore, it can be concluded that in consideration of the limited data of the experiment, the FEM and the analytical models combined created a synergy, characterised by high-efficiency in terms of the analysis time and resources used.
References
-
Bravo T., Maury C., Pinhède C. Optimising the absorption and transmission properties of aircraft micro perforated panels. Applied Acoustics, Vol. 79, 2014, p. 47-57.
-
Campolina B., Dauchez N., Atalla N., Doutres O. Effect of porous material compression on the sound transmission of a covered single leaf panel. Applied Acoustics, Vol. 73, Issue 8, 2012, p. 791-797.
-
Wang P. W., Zhong W. W., Hsu J. F. Investigation of multi-layer sandwich beams through single degree-of-freedom transformation. Applied Acoustics, Vol. 74, Issue 4, 2013, p. 521-525.
-
Munjal M. L. Recent advances in muffler acoustics. International Journal of Acoustics and Vibration, Vol. 18, Issue 2, 2013, p. 71-85.
-
Everstine G. C. Finite element formulation of structural acoustics problems. Computers and Structures, Vol. 65, 1997, p. 307-321.
-
Ihlenburg F. Finite Element Analysis of Acoustic Scattering. Springer, New York, 1998.
-
Morand H. J.-P., Ohayon R. Fluid Structure Interaction: Applied Numerical Methods. Wiley, Chichester, 1995.
-
Mikalauskas R., Volkovas V. Investigation of adequacy of the acoustical field model. Mechanics (Mechanika), Vol. 76, Issue 2, 2009, p. 46-49.
-
Sequeira M. E., Cortínez V. H. A simplified two-dimensional acoustic diffusion model for predicting sound levels in enclosures. Applied Acoustics, Vol. 73, Issue 8, 2012, p. 842-848.
-
Grubeša S., Jambrošić K., Domitrović H. Noise barriers with varying cross-section optimized by genetic algorithms. Applied Acoustics, Vol. 73, Issue 11, 2012, p. 1129-1137.
-
Roozen N. B., Oetelaar J., Geerlings A., Vliegenthart T. Source identification and noise reduction of a reciprocating compressor: a case history. International Journal of Acoustics and Vibration, Vol. 14, Issue 2, 2009, p. 90-98.
-
Beranek L. L. Acoustics. Woodbury, New York, 1996.
-
ANSYS Multiphysics. Release 10.0, Tutorial, 2005.
-
Randall F. B. Industrial Noise Control and Acoustics. Marcel Dekker Inc., New York, 2003.
About this article

