Abstract
In this paper, we propose a quasi-realtime human respiration detection method via UWB radar system in through-wall or similar condition. With respect to the previous proposed automatic detection method, the new proposed method assures competitive performance in the human respiration motion detection and effective noise/clutter rejection, which have been proved by experimental results in actual scenario. This new method has also been implemented in a UWB through-wall life-detection radar prototype, and its time consuming is about 2 s, which can satisfy the practical requirement of quasi-realtime for through-wall sequential vital sign detection. Therefore, it can be an alternative for through-obstacles static human detection in antiterrorism or rescue scenarios.
1. Introduction
The ultra-wideband (UWB) radar system for through-wall detecting human subjects has always been an important technique to prevent the crimes and terror due to its high range resolution, strong penetrating power, and good resolving ability. In recent years, the vital sign electromagnetic detection using UWB radar is becoming an advanced non-contact detection technique which extracts information from observations on human subject. Regarding to vital sign detection, many research groups have been proposing many novel detection algorithms using different radar systems like Doppler radar [1], Continuous Wave radar [2, 3] and UWB pulse radar [4-7]. Changzhi Li et al. employed the relaxation (RELAX) algorithm to process baseband signals for Doppler radar noncontact vital sign detection [1]. Marcello Ascione et al. properly exploited a CW signal source working at 10 GHz and took advantage of the phase modulation due to the chest movement to detect the respiratory activities from the measured signal [2]. Lanbo Liu et al. studied the human vital sign detection with the SFCW radar technique with physical experiments under laboratory conditions [3]. Amer. Nezirovi´c et al. proposed a developed respiration motion detection (RMD) algorithm that could separate the non-stationary clutter from the respiratory response using a UWB pseudorandom-noise radar [4]. Based on a UWB pulse radar, Lanbo Liu applied the Hilbert-Huang Transform (HHT) for the nonlinear and non-stationary signal processing to identify and differentiate a variety of respiratory statuses [5]. Zhu Zhang et al. mainly focused on the estimation of the surrounding structure between the human target and the radar [6]. Zhao Li et al. found the respiration-like clutter reflected from the wall or rubble due to the jitter or drift of the radar, and they proposed an adaptive clutter cancellation [7]. Meanwhile, many respiration detection methods in the medical area are also attractive and worth mentioning for through-wall applications [8, 9].
In this paper, we apply a UWB pulse radar system in through-obstacles human respiration detection and present the experimental validation of the new proposed quasi-realtime detection method that aims at improving the performance of respiration detection. Compared to the previous proposed method [10], non-stationary clutter will be suppressed effectively in the new method. Meanwhile, the time consuming is about 2 s so that the quasi-realtime through-wall human respiration detection is possible. This feature might also be suitable for through-obstacles static human detection in antiterrorism.
The rest of this paper is organized as follows. In section 2, the overall radar system is described both in measurement device and detection procedure aspects, while the experimental results are reported in section 3. Finally, section 4 concludes this paper.
2. UWB through-wall life-detection radar system
2.1. UWB time domain respiratory signal model
Referring to [11, 12], for impulse UWB radar system, the received signal with the respiration motion of one human subject can be expressed as:
where “” represents convolution. is the transmitted signal, represents fast-time, slow-time is discrete with , on which the reflected signal is received, is slow-time sampling points, and is the effective pulse repetition time (PRT). is the respiratory response of the human subject, and is the joint impulse response of transmitting antenna, receiving antenna, and static objects. and are the propagation time-delay of the human subject and the th object, respectively. is the non-stationary inference, and is the additive white Gaussian noise.
In order to avoid frequency aliasing and range ambiguities, should be set to satisfy Nyquist sampling theorem and guarantee that all the reflected signals of objects are received in one PRT [10]. The discrete signal of all the reflected signals can be expressed as 2-D (fast-time and slow-time) × matrix :
where is fast-time sampling points, , and is slow-time sampling points, . Every term in Eq. (2) corresponds to that in Eq. (1).
2.2. Quasi-realtime detection procedure
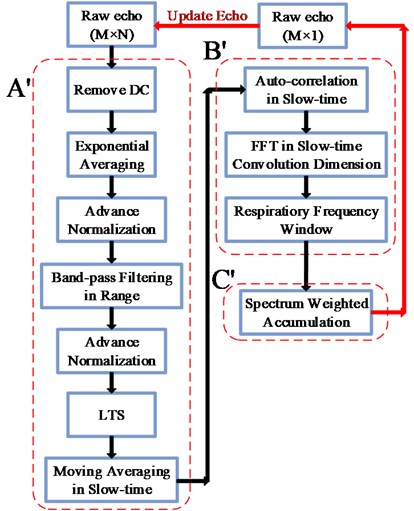
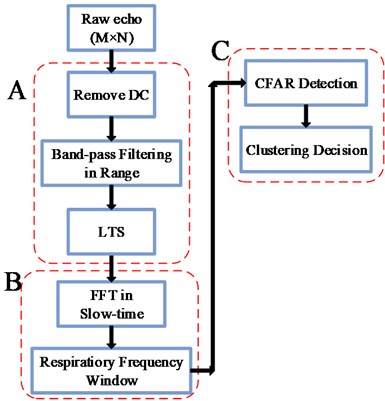
Here, we propose an improved version of the previous method [10], referred to as the quasi-realtime human respiration detection (QHRD) method in the following. The proposed QHRD method consists of three main steps: ) Pre-Processing, ) FFT in Slow-time Convolution Dimension and ) Spectrum Weighted Accumulation (SWA) method, as illustrated in Fig. 1(a). In the previous method, there are also three main steps: ) Pre-Processing, ) FFT in Slow-time Dimension and ) Constant False Alarm Rate Clustering (CFAR-Clustering) method, as shown in Fig. 1(b). Obviously, the step is developed from the step . The adaptive background subtraction (ABS) method in [13] is used to remove the static clutter. The linear trend suppression (LTS) method in [4] is adopted to suppress the non-static clutter and linear trend in slow-time dimension caused by the data acquisition accompanying with the instability of radar time-base. The advance normalization (AN) method in [14] is used for the enhancement of the weak human respiratory signal. A moving average filter is also applied both along the fast-time and slow-time dimensions to eliminate and suppress the high-frequency clutter interferences [7].
As shown in Fig. 1(a), the 2-D × matrix in Eq. (2) is taken as the input of the step , the corresponding output matrix is named as . The aim of all the above methods performed in the step is to further improve the signal to noise/clutter ratio (SNCR) of . In the following, the step and step in the QHRD method different from the previous method will be given out.
Fig. 1a) The flowchart of the QHRD method, b) the flowchart of the previous method
a)
b)
2.2.1. FFT in slow-time convolution dimension
Generally, there is a strong correlation among the values of the deterministic signal in different time instant. Otherwise, the correlation of the interference noise is always weak because of the high randomness. Based on this characteristic, the deterministic signal can be extracted from the interference noise. For the slow-time signal in added with zero mean random noise, the contribution from the noise can be very small in the auto-correlation function , which mainly consists of the characteristics of the deterministic signal like DC, the amplitude and frequency of the periodic components and so on. For the non-periodic noise, the auto-correlation function is prone to zero:
where and The periodic component and its harmonic components of the slow-time signal are still preserved and expressed as . can be discretized and taken as the th row vector of the 2-D (fast-time and slow-time convolution) × matrix , where is fast-time sampling points and , is convolution length and . To extract the respiratory frequency, the FFT is performed for in slow-time convolution dimension, and its resultant matrix is the output range-frequency matrix of the step shown in Fig. 1(a). According to the fact that the respiratory frequency is confined in a narrow frequency range, one selected frequency window ranging from 0.05 to 1 Hz is added to eliminate high frequencies, high harmonics, and very low frequencies in .
2.2.2. Spectrum weighted accumulation (SWA) method
According to the implementation steps mentioned in Fig. 1(b), the CFAR-Clustering method is performed to extract respiratory frequency. The CFAR method based on the characteristic of vital sign in the FFT resultant matrix is used to detect vital sign in low SNCR conditions automatically. The decision whether the vital sign exists or not and the estimation of the detailed vital information are implemented in the clustering decision method. However, the CFAR moving energy window calculation in the CFAR method and the vital sign points of interest (VSPOI) identification in the clustering decision method are always time consuming. Furthermore, the detection probability of the vital sign is highly depended on the selected local signal to background energy ratio , which is empirically determined to be greater than one requiring that the energy of the vital sign is stronger than that of background.
Here, a new spectrum weighted accumulation (SWA) method is proposed for the vital sign extraction without any thresholds, the empirical adjustment of which might decrease the practicability of any detection method in actual scenarios. Define the non-weighted spectrum accumulation signal , which can be expressed as:
where and is the th FFT result in range-frequency matrix , which can be used to extract the periodic component. Although the spectral amplitude of the periodic component of respiration motion is always small in , it can be strengthened in the spectrum accumulation signal to improve the SNCR. Whether the vital sign exists in the range or not is hard to decide, so the values of and are generally selected as and respectively. As the spectral amplitude of near-zero frequency component can also be strengthened in , the weighted spectrum accumulation signal is present to further remove the interference from the near-zero frequency components:
The weighted factor is defined as:
where , is the slow-time scanning rate and is the total measured time, is slow-time sampling points. Here, the weighted factor is selected as the respiratory frequency window. Based on the weighted spectrum accumulation signal , it is easy to extract the respiratory frequency by finding the peak value.
Assuming the respiratory frequency of a human being is invariant during the short measured time , there is a one-to-one relationship between the maximums of the and the human being in a limited respiratory frequency window, which is set from 0.05 to 1 Hz according to the prior range of respiratory frequency. The index corresponding to the peak value of the equals to the index in the weighted factor , so the respiratory frequency of the human being is:
When the possible respiratory frequency is extracted from the and , the corresponding range profile of the vital sign in can be obtained:
where is fast-time sampling points and . Similar to the respiratory frequency , the index corresponding to the peak value of the indicates the range location of the vital sign:
where and are the maximum and minimum distance to be detected respectively. Generally, and can be set to and . Here, is the fast-time sampling interval and is the propagation speed of the electromagnetic wave.
2.3. Update echo for sequential detection
The proposed QHRD method implemented in Matlab takes about 2s to obtain the results of the vital sign. Therefore, it can improve the performance of quasi-realtime through-wall radars employed in emergency or law enforcement operations. According to the flowchart in Fig. 1(a), the 2D × raw echo matrix in the detection procedure is updated by a new 1D × raw echo . This procedure has been adopted in our Through-wall Life-Detection Radar prototype (see Fig. 2), and offered the sequential range location and respiratory frequency of a human being.
2.4. Measurement device
As shown in Fig. 2, the radar prototype employed in human respiration detection was designed by the research group of Key Laboratory of Electromagnetic Radiation and Sensing Technology, Institute of Electronics, Chinese Academy of Sciences. This radar prototype packages two UWB antennas in a 45 cm×22 cm×45 cm box and is operated by a wireless personal digital assistant. One antenna is used for the transmitter, and the other is for the receiver. The key parameters of the radar prototype are shown in Table 1.
Table 1Parameters of the radar prototype
Parameters | Value |
Operating mode | Impulse |
Centre frequency | 400 MHz |
Amplitude of transmitted signal | 50 V |
Pulse repeated frequency (PRF) | 600 KHz |
Average number () | 128 |
Sampling time window | 81 ns |
Sampling points () | 2048 or 4096 |
Antenna gain | 5-7 dBi |
Input bandwidth of ADC | 2.3 GHz |
ADC sampling rate | 500 MHz |
Data bits | 12 bits |
Dynamic range of receiver | 72 dB |
3. Experiment and result analysis
The measurement setups for human respiration detection in through-wall or similar condition are shown in Fig. 2. Two experiments were conducted in the through-wall condition, and the third experiment was carried out in artificial-ruins condition. The latter two experiments were designed for the sequential detection. In the first experiment, the echoes were acquired with a male volunteer performing as the test human subject standing at several meters behind a concrete wall, which is shown in Fig. 2(a). The test human subject was straightly facing to the wall. The thickness and the measured average dielectric constant of the concrete wall were 24 cm and 4.93, respectively. In the second experiment, as shown in Fig. 2(b), the test human subject seated statically 2.5 m from the wall. To simulate the actual rescue scenario after earthquake, in the third experiment as shown in Fig. 2(c), the test human subject was lying about 30cm under a broken concrete building structure with the thickness of about 1m.
Fig. 2The measurement setup
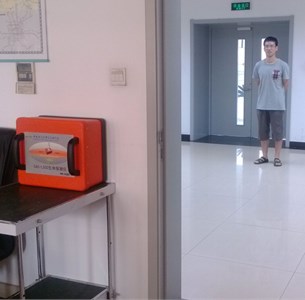
a) The test human subject stood behind a concrete wall
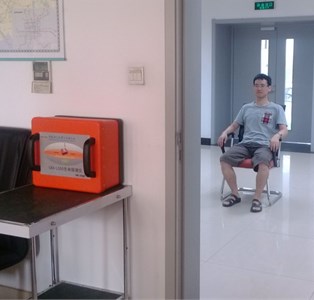
b) The test human subject seated statically behind the wall
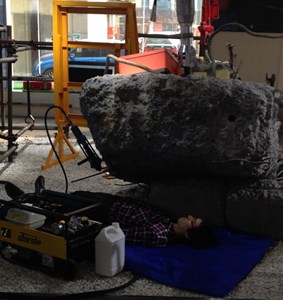
c) The test human subject lied under a broken concrete building structure
3.1. Performance of the detection procedure
To compare the performances of the two methods shown in Fig. 1, the corresponding results are illustrated and analyzed in the following.
The quasi-periodic slow-time signals representing the respiration of the test human subject are depicted by the red dotted frame in the resultant matrix processed by the step (see Fig. 3(a)). However, the quasi-periodic respiratory signals cannot be seen clearly. This drawback directly decreases the detection probability of the subsequent step and step in the Fig. 1(b). Similarly, the resultant matrix after performing the step in Fig. 1(a) is shown in Fig. 3(b).
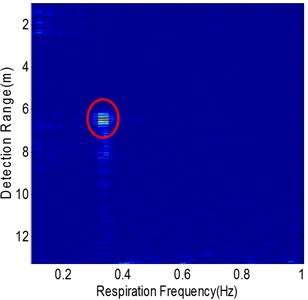
Fig. 3a) Resultant matrix corresponding to the step A, b) resultant matrix corresponding to the step A', c) range-frequency matrix obtained from the step B, d) range-frequency matrix obtained from the step B'
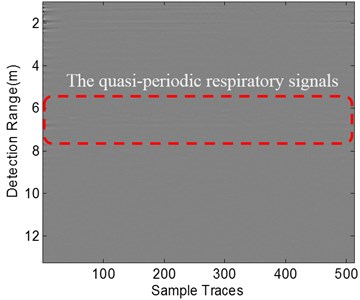
a)
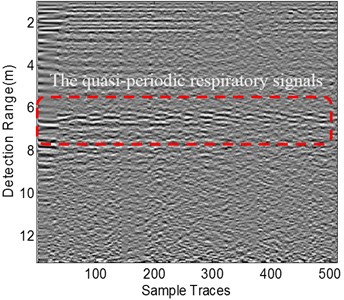
b)
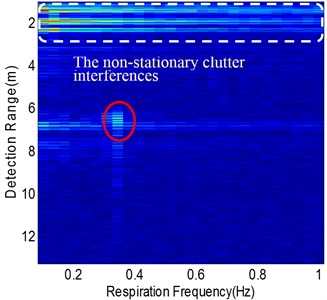
c)
d)
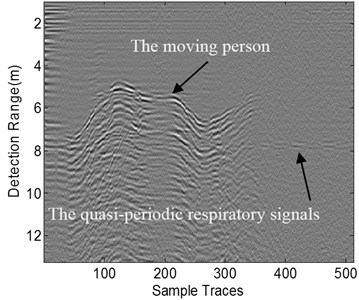
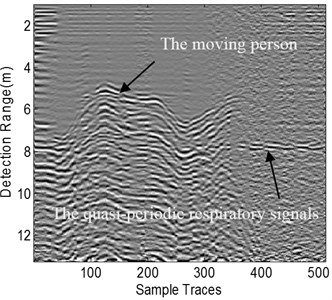
Fig. 4Resultant matrices in the specific scenario where a moving person appeared in the front of the test human subject
a) Resultant matrix corresponding to the step
b) Resultant matrix corresponding to the step
It is obviously noted that the quasi-periodic respiratory signals from the test human subject (depicted by the red dotted frame) can be distinguished easily. Subsequently, as the output of step and step in Fig. 1, the range-frequency matrices are present in Fig. 3(c) and Fig. 3(d) respectively. Although the vital sign of the test human subject in the range-frequency matrix (marked by a red ellipse in Fig. 3(c)) is visible, the range location and respiratory frequency of the vital sign can be hardly extracted due to the low SNCR condition caused by the non-stationary clutter interferences (marked by white dotted frame in Fig. 3(c)). Considering no other moving targets appear in the detection scenario, the non-stationary clutter is mainly brought from the instability of the radar system, but this might not be the only reason. As shown in Fig. 3(d), the non-stationary clutter interferences have been removed dramatically in the resultant matrix obtained from the step in Fig. 1(a). Obviously, the background around the vital sign is cleaner than that in Fig. 3(c), which makes the extraction of the vital sign easier.
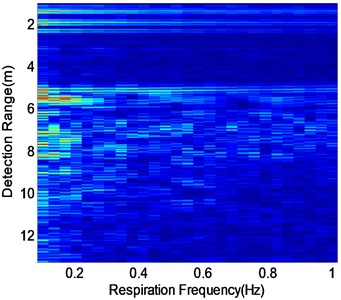
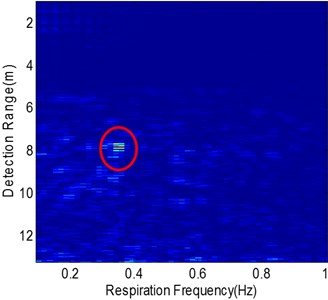
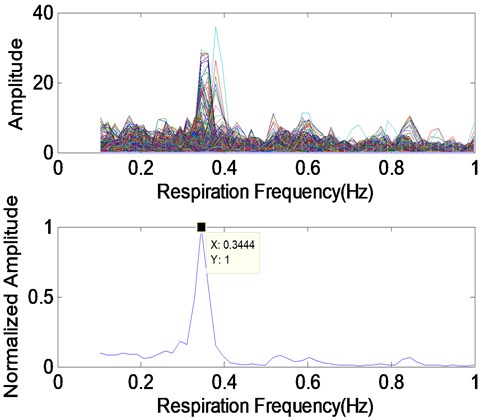
Fig. 5a) Range-frequency matrix obtained from the step B, b) range-frequency matrix obtained from the step B', c) Respiratory spectrum signals of range-frequency matrix b) and its normalized spectrum weighted accumulation signal
a)
b)
c)
Considering the specific scenario where one moving person appeared in the front of the test human subject, the non-stationary clutter interference is strong as shown in Fig. 4(a) and the quasi-periodic respiratory signals are covered when the moving person is nearby. After performing the step in Fig. 1(a), the quasi-periodic respiratory signals are strengthened in Fig. 4(b). However, the non-stationary clutter interference caused by the moving person cannot be eliminated. The two range-frequency matrices obtained from the step and step are shown in Fig. 5(a) and Fig. 5(b), respectively. It is noted that the step and the step of the QHRD method play an important role in eliminating the strong interference from the moving person. Compared to Fig. 5(a), the cleaner background in Fig. 5(b) is remarkable, and the vital sign of the test human subject marked by the red ellipse can be found obviously. In Fig. 5(c), the top plot shows the FFT results of the slow-time signals in Fig. 5(b) for all fast-time sampling points and the respiratory frequency of the test human subject is uncertain. The bottom plot of Fig. 5(c) gives out the normalized weighted spectrum accumulation signal defined as Eq. (5), and the desired respiratory frequency can be obtained clearly and its value is 0.34 Hz.
As mentioned above, the proposed QHRD method improves the previous method in reducing the non-stationary clutter interference, cleaning the background and distinguishing the vital sign in range-frequency matrix effectively.
3.2. Sequential detection
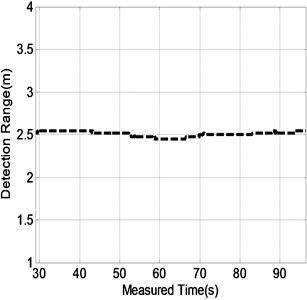
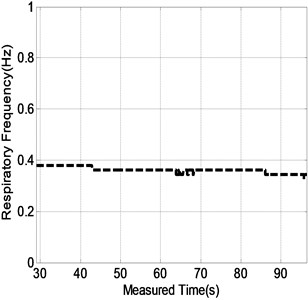
According to Section II-C, the sequential results consisting of the detection range location and respiratory frequency of the test human subject are shown in Fig. 6 and Fig. 7, corresponding to measurement setups in Fig. 2(b) and Fig. 2(c) respectively. In Fig. 2(b), the acquired total trace number of the raw echoes is 1700 during the measured time of about 97 seconds. Similarly, the total trace number is 930 and the measured time is about 53 seconds in Fig. 2(c). Before the first implementation of the proposed QHRD method, the measured time needed for the collection of the raw echo matrix is about 29 s, which is determined by the scanning rate of the radar prototype. Therefore, the first time-consuming of the proposed QHRD method is about 31 seconds, then it might keep a constant value (about 2 seconds).
In Fig. 6, during the measured time ranging from about 29 seconds to 97 seconds, the status (range location and respiratory frequency) of the test human subject is detected in quasi-realtime, the mean values of which are 2.58 m and 0.32 Hz respectively. Thus, it can be seen that the proposed QHRD method can give out the accordant status of the test human subject sequentially and make the quasi-realtime monitoring of a static human being possible in through-wall condition.
Fig. 6The sequential results consisting of the range location a) and respiratory frequency b) of the test human subject in Fig. 2(b) during the measured time ranging from about 29 s to 97 s
a)
b)
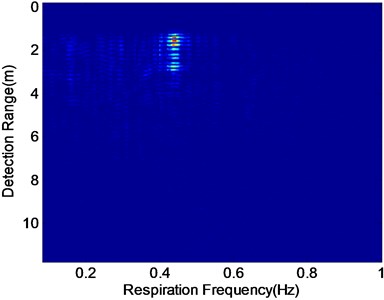
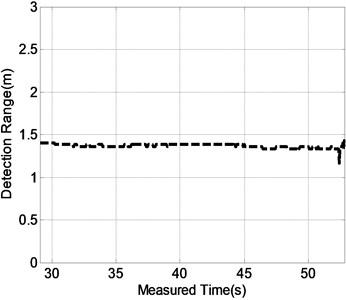
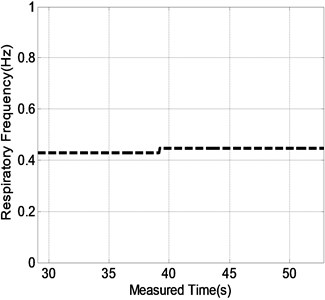
Further, the promising results of the proposed QHRD method in the artificial earthquake rescue scenario (see Fig. 2(c)) are shown in Fig. 7. The range-frequency matrix obtained from the step at the measured time of 29 s is shown in Fig. 7(a). It is easy to extract the vital sign of the test human subject based on the clean background. The sequential status of the vital sign of the test human subject is updated every 2 seconds from the measured time of 29 seconds to 53 seconds, which are shown in Fig. 7(b) and Fig. 7(c). Likewise, the mean values of the detected status are 1.37 m and 0.44 Hz respectively, which are accordant with the practical status of the test human subject. Therefore, the application of the proposed QHRD method in earthquake rescue is feasible.
Fig. 7a) The Range-frequency matrix obtained from the step B' at the measured time of 29 s. The sequential results consisting of the range location b) and respiratory frequency b) of the test human subject in Fig. 2(c) during the measured time ranging from about 29 s to 53 s
a)
b)
c)
4. Conclusion
We have proposed a QHRD method for sequential human respiration detection in through-wall or similar condition and provided experimental validations of its capability. The results show that the step and provide excellent suppression of static/non-static clutter and higher SNCR both in the weighted spectrum accumulation signal and range-frequency matrix. The “cleaner” range-frequency matrix makes the extraction of the vital sign easier. The time-consuming is about 2 s so that the quasi-realtime sequential human respiration detection is possible and suitable for through-obstacles static human detection in antiterrorism or rescue scenarios.
References
-
Li C., Ling J., Li J., Lin J. Accurate doppler radar noncontact vital sign detection using the RELAX algorithm. IEEE Transactions on Instrumentation and Measurement, Vol. 59, Issue 3, 2010, p. 687-695.
-
Ascione M., Buonanno A., D’Urso M., Angrisani L., Moriello R. A new measurement method based on music algorithm for through-the-wall detection of life signs. IEEE Transactions on Instrumentation and Measurement, Vol. 62, Issue 1, 2013, p. 13-26.
-
Liu L., Liu S. Remote detection of human vital sign with stepped-frequency continuous wave radar. IEEE Journal of Selected Topics in Applied Earth Observations and Remote Sensing, Vol. 7, Issue 3, 2014, p. 775-782.
-
Nezirovic A., Yarovoy A., Ligthart L. Signal processing for improved detection of trapped victims using UWB radar. IEEE Transactions on Geoscience and Remote Sensing, Vol. 48, Issue 4, 2010, p. 2005-2014.
-
Liu L., Liu Z., Barrowes B. Through-wall bio-radiolocation with UWB impulse radar – observation, simulation and signal extraction. IEEE Journal of Selected Topics in Applied Earth Observations and Remote Sensing, Vol. 4, Issue 4, 2011, p. 791-798.
-
Zhang Z., Zhang X., Lv H., Lu G., Jing X., Wang J. Human-target detection and surrounding structure estimation under a simulated rubble via UWB radar. IEEE Geoscience and Remote Sensing Letters, Vol. 10, Issue 2, 2013, p. 328-331.
-
Li Z., Li W., Lv H., Zhang Y., Jing X., Wang J. A novel method for respiration-like clutter cancellation in life detection by dual-frequency IR-UWB radar. IEEE Transactions on Microwave Theory and Techniques, Vol. 61, Issue 5, 2013, p. 2086-2092.
-
Kuo Y., Lee J., Chung P. A visual context-awareness-based sleeping-respiration measurement system. IEEE Transactions on Information Techology in Biomedicine, Vol. 14, Issue 2, 2010, p. 255-265.
-
Sprager S., Zazula D. Heartbeat and respiration detection from optical interferometric signals by using a multimethod approach. IEEE Transactions on Biomedical Engineering, Vol. 59, Issue 10, 2012, p. 2922-2929.
-
Xu Y., Wu S., Chen C., Chen J., Fang G. A novel method for automatic detection of trapped victims by ultrawideband radar. IEEE Transactions on Geoscience and Remote Sensing, Vol. 50, Issue 8, 2012, p. 3132-3142.
-
Venkatesh S., Anderson C., Rivera N., Buehrer R. Implementation and analysis of respiration rate estimation using impulse-based UWB. Proceeding of IEEE Communications Conference, Atlantic City, NJ, Vol. 5, 2005, p. 3314-3320.
-
Xu Y., Dai S., Wu S., Chen J., Fang G. Vital sign detection method based on multiple higher order cumulant for ultrawideband radar. IEEE Transactions on Geoscience and Remote Sensing, Vol. 50, Issue 4, 2012, p. 1254-1265.
-
Zetik R., Crabbe S., Krajnak J., Peyerl P., Sachs J., Thoma R. Detection and localization of persons behind obstacles using M-sequence through-the-wall radar. Proceeding of SPIE, Sensors, and Command, Control, Communications, and Intelligence Technologies for Homeland Security and Homeland Defense V, Vol. 6201, 2006.
-
Rovnakova J., Kocur D. Weak signal enhancement in radar signal processing. IEEE 20th International Conference Radioelektronika, 2010.
About this article
Funding for this work was provided by the National High Technology Research and Development Program of China (863 Program) under Grant No. 2012AA061403 and the National Science and Technology Pillar Program during the Twelfth Five-year Plan Period under Grant No. 2014BAK12B00.
