Abstract
For offshore wind turbines, the wind and wave loads are the main actions exerted on the offshore structures during the operational process. In order to reasonably simulate the wind-wave coupling effect and the dynamic characteristics of the structure under the coupling effect, the Davenport horizontal fluctuating wind speed spectrum is processed according to the Fourier transform and the harmonic superposition method, thus the fluctuating wind spectrum which coincided well with the target power spectrum is acquired. On the basis of the random wave theory, the calculation equation of wave load for offshore wind turbine structures are put forward. Besides, the wind and wave coupling mechanism analysis is carried out by Turkstra method. In numerical analysis, the integrated finite element model of the offshore wind turbine structure is established considering the interaction between the wind turbine foundation and the soil. Meanwhile, based on the frequency domain method, the in-site measured acceleration signals of an offshore wind turbine are processed and analyzed and the dynamic characteristics of each part of the wind turbine supporting system are obtained. Comparing the measured values with the numerical simulation results, it shows that the calculation method of the wind-wave coupling effect has a preferable accuracy as well as a certain amount of safety coefficient, which can ensure the safety of the structure in actual operation process.
1. Introduction
With the rapid development of global economy, energy consumption is also growing, the non-renewable resources of coal, oil and natural gas in the decades have been constantly consumed, thus the development of new and renewable resources are the main trend in present society. Wind power is a green source of sustainable energy with a relatively reliable application technology. At present, the global wind power industry has entered a stage of rapid development and caused increasing concern, the foundation and support structure design require the development of highly cost-effective constructions, such as various forms of bucket foundations and pre-stressed reinforced concrete wind-turbine tower [1-4]. A new type of large-scale pre-stressed concrete bucket foundation (LSPCBF) for offshore wind turbines that can be produced on land, integrated transportation and installation, as proposed by Tianjin University [5-7]. LSPCBF have obvious advantages in construction expense and speed, a prototype of wind turbine with this type of foundation has been installed in the sea adjacent to China’s Jiangsu Province (shown in Fig. 1).
The wind turbine support structure systems are currently designed by using the static method, and the dynamic effects are less considered. As wind turbine support structures are constantly exposed to ambient dynamic loads such as wind and wave loads, the sufficient strength and stability of the support structures should be guaranteed. Vibration characteristics of the wind turbine support structures with LSPCBF foundation based on long-term monitoring data are studied in this paper. The field measurement data is analyzed and the actual vibration state of the structure is acquired. A simulation method of wind-wave coupling effect is proposed based on the random physical models, and the coupling numerical model of soil-LSPCBF foundation-wind turbine tower is established in order to verify the feasibility of this coupling method, the structural dynamic response under the combined wind-wave loads is carried out. Finally, the accuracy of the wind-wave load coupling method and numerical model are verified by comparing with the field measurement data.
Fig. 1Offshore wind turbines with LSPCBF
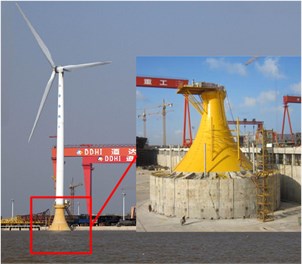
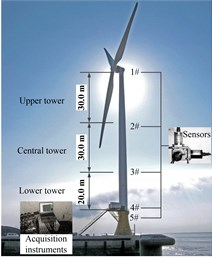
Fig. 2Layout of field testing and measurement system
2. Vibration test of offshore wind turbine supporting structure
2.1. Monitoring equipment layout
This experimental offshore wind turbine is in service in Qidong Sea area of Jiangsu province in China, a 2.5 MW wind power generator is placed on its top. The experimental structure consisting of a LSPCBF foundation, a curved transition section, and a wind power generator system with three 46.7 m-long blades is shown in Fig. 1. The curved transition section is a pre-stressed concrete structure, and its function is to transfer the force from the superstructure to the underwater foundation. The 80 m tall upper steel tower, which has working platforms between nacelle and tower or two adjacent parts of tower, is divided into three stories. The vibration frequency of wind turbine under ambient loads is distributed over a wide range, so high precision seismic accelerometers are adopted in this test (0.1 Hz-200 Hz). The locations of five observed points are illustrated in Fig. 2, each part has three mutually perpendicular seismic accelerometers, which are used to acquire wind turbine vibration response signals.
2.2. Analysis of measured data
Data in this study was collected in the fall of Jiangsu province, based on the long time observation, some representative data was selected for detailed analysis. The collected signal of each measuring point is the acceleration signal, acceleration signal need to be converted to the displacement signal for a more direct way of analyzing the dynamic performance of the supporting structure system, the commonly used processing method are based on differential and integral. The commonly used data processing methods are integral and differential, which can be both realized in time domain and frequency domain. The frequency domain method is selected in processing and analyzing the acceleration signals in this paper. Based on its basic principle, the signals are firstly converted by Fourier transform, then the conversion results are operated by integral or differential in the frequency domain and finally the integral or differential time domain signals can be obtained by Fourier inversion.
When the initial velocity component and displacement component are both 0, the displacement component can be obtained by double integral of acceleration signal component as shown in the following:
where is the Fourier component of displacement signal at frequency is the corresponding coefficient of ; is the Fourier component of acceleration signal at frequency , B is the corresponding coefficient of , is an imaginary number; is the Fourier component of velocity signal at frequency , is the corresponding coefficient of .
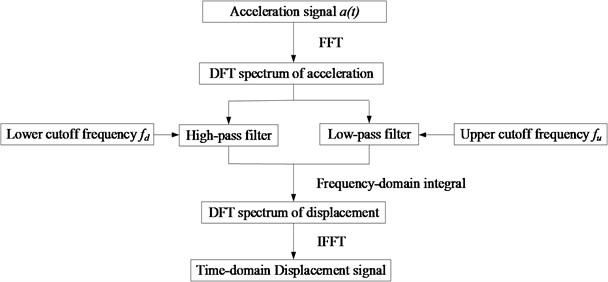
The acceleration signals can be transferred to displacement signals by Eq. (1) in theory, however, the field collection signals are accompanied with various kinds of noise and interference. Among them, the low frequency signals are crucial to the displacement vibration amplitude. There is a large swing trend term when the signal data is processed by integral transform, and the con-version results may distorted entirely after double integration. High frequency interference noise signals may affect the measuring accuracy of the instantaneous displacement values, as the integral values can be counteract by each other, the accumulation will not occur. For the errors caused by the zero point drift, initial value of the integral and the high frequency environment noise signals, the frequency domain filtering and integration treatment method is applied in this paper and the analytical flow is showed in Fig. 3.
Fig. 3Flowchart of frequency-domain filter and integral
The specific analysis procedure based on the frequency filtering and integration treatment method is demonstrated in the following:
Step 1: The discrete Fourier transform of the input signal data is processed by FFT fast algorithm;
Step 2: According to the filtering requirement, the appropriate lower and upper limits of cut-off frequency are determined by finite element calculation or spectral analysis of the actual measured signals. The high-pass filter and low-pass filter of the Fourier transform data after integration are conducted in frequency domain. The compositions lowered than the minimum cut-off frequency are set as zero, which is equivalent to high-pass filter aiming at removing the low frequency trend term. Similarly, the compositions higher than the maximum cut-off frequency are also set as zero, which is equivalent to low-pass filter aiming at removing the high frequency interference noise. The expression of the frequency domain filtering is demonstrated as follows:
The frequency-response function of the frequency domain filter is presented as follows:
where is the frequency resolution, and are the lower limit and upper limit respectively, is the number of data.
Step 3: The displacement signals can be gained by the inverse Fourier transformation of the above formula.
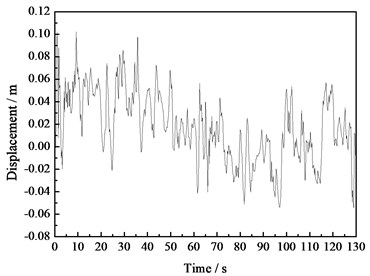
The top of the wind turbine tower is the key position to guarantee of the whole supporting system. Taking the acceleration measured values of point 1 located on the tower top as an example to analyze, the measured acceleration time history curve of point 1 is showed in Fig. 4. The corresponding velocity and displacement time history curves handled by the frequency domain filtering and integration method are showed in Fig. 5 and Fig. 6. According to the figures, the signals gained through this method are relatively smooth and not lose the stability due to the low frequency trend term and the high frequency noise, which shows that this method can be a preferable way to eliminate the low frequency trend term and the high frequency noise. From Fig. 6, we can see that the maximum displacement of the tower top is 0.103 m under the environmental load effect.
Fig. 4Acceleration time history curve of the tower top
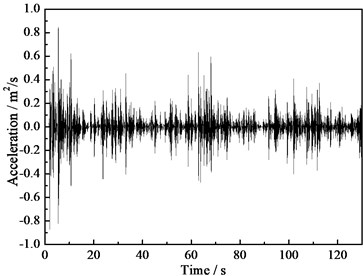
Fig. 5Speed time history curve of the tower top
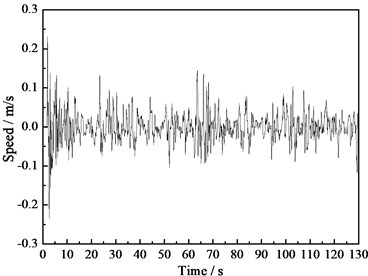
Fig. 6Displacement time history curve of the tower top
3. Numerical model
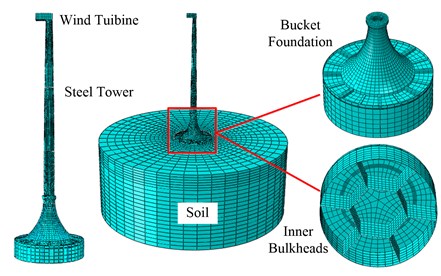
The integrated model of the structure-foundation-soil system is established by ABAQUS software, including the wind turbine, the tower, the arc transition part, the bucket foundation and the soil. Whereby, the arc transition part is a pre-stressed concrete structure with 19.7 m height, the top cap and the cap beam of the foundation are reinforced concrete structure with a total height of 1.3 m. Besides, the bucket diameter, the skirt height and the skirt thickness are 30 m, 10 m and 0.02 m, respectively, which are made of steel. In order to satisfactorily reduce the influence of boundary effect, the soil diameter and depth are set as five times of the bucket, which are 150 m and 50 m respectively. The well-established Mohr-Coulomb model, a simple elastic-perfectly plastic constitutive model is used to model the soil. The parameters of each soil layer are shown in Table 1.
The upper blades and the nacelle located on top of the wind tower are simplified as a 130 t mass block in modeling. The upper steel wind tower is divided into three parts, the geometric characteristics of which are indicated in Table 2.The steel wind tower structure and the bucket skirt, which has a high height-thickness ratio are modeled by Shell elements, the pre-stressed steel strands are modeled by Truss elements. The bucket cap, the cap beam and the soil are modeled by 8-nodel reduced integral elements (C3D8R). Coulomb friction formula is used for contact interface between the foundation and the soil and penalty function equation is established. The friction coefficient is set as 0.3. Due to the great impact of the initial stress of the soil, the balance of geostatic stress is conducted before acting load to eliminate the additional deformation under its self-weight. The finite element model of the structure-foundation-soil system is shown in Fig. 7.
Table 1Parameters of the soil
Soil layer | Geotechnical title | Thickness (m) | Unit weight (kN/m3) | Deformation modulus (MPa) | Frictional angle (°) | Cohesive force (kPa) |
1 | Sandy silt | 10 | 0.97 | 14.2 | 30.4 | 9.2 |
2 | Silty soil | 18 | 0.92 | 10.6 | 28.7 | 8.1 |
3 | Sandy silt | 22 | 0.95 | 11.5 | 29.3 | 6.0 |
Table 2Geometric characteristics of the steel tower
Segment | Lower base diameter (m) | Upper base diameter (m) | Shell thickness (m) | Height (m) |
Bottom | 4.3 | 3.8 | 0.035 | 30 |
Middle | 3.8 | 3.3 | 0.032 | 30 |
Top | 3.3 | 2.8 | 0.028 | 20 |
Fig. 7Finite element model
4. Random wind-wave loading model
4.1. Calculation model of the random wind load
In the operational process, the incentive effect caused by environment loads will give rise to frequent vibrations of the structure, consequently lead to premature fatigue failure of the structure. For offshore wind turbines, wind load is the main load among the numerous incentive load effects which are acted on the wind turbine systems. In the time history curves of the wind along the wind direction, the wind can be divided into two parts, the average wind and the fluctuating wind. Whereby, the average wind refers to the quantity that the wind magnitude and direction keep unchanged with time in a certain period. However, the fluctuating wind refers to the wind changes with time based on the law of random, which data should be processed by random vibration theory. The simulation of wind mainly aims at the fluctuating wind.
The fluctuating wind speed changes irregular with time. The wind speed record statistics show that the fluctuating wind speed time history can be regarded as stationary Gaussian random process if the serious non-stationary area of the initial period of the record is ignored. The stationary stochastic process can be simulated by Monte-Carlo method and Orthogonal Decomposition method, while the most widely used analysis of Monte-Carlo method are linear filtering method and harmonic synthesis method, etc. [8-9]. The calculated amount of linear filtering method is relatively small, but the precision is relatively low. While the parameters simulated by the harmonic synthesis method agrees well with the target parameters, which is based on rigorous theoretical basis, explicit mathematical meaning but large amount of calculation. The harmonic synthesis method improved by FFT is adopted in this paper, which has a relatively high precision and an evidently reduced calculation amount.
Usually the steady wind can be simulated by orthogonal decomposition method and Monte-Carlo method, the commonly used level fluctuating wind velocity spectrum are Hino spectrum, Kaimal spectrum and Davenport spectrum, etc. Among them, the Davenport spectrum is established by A. G. Davenport [10] according to the average values of the measured values of vertical turbulence power spectrums under 90 times of strong winds though different locations and different altitudes in the world. The variation relation of turbulence power spectrum with height cannot be responded in Davenport spectrum, which is the vertical turbulence power spectrum in 10 m high from the ground. Plus the turbulence integral scale is assumed as a constant, the spectrum is highly estimated in high frequency composition. Under the same conditions, the response value of the structure towards Davenport spectrum is 10 %-20 % larger than that towards Kaimal spectrum which makes the calculation values more conservative. The previous studies show that the wind spectrum changes slightly with height, if the variation with height is overlooked, Davenport spectrum can totally meet the engineering accuracy requirements [11-12]. For the sake of simplicity and convenience of engineering application, the most representative and reliable Davenport spectrum is adopted to level fluctuating wind velocity spectrum of wind load code in China, Canada, America and Germany [13-15]. The Davenport level fluctuating wind velocity spectrum is employed for analysis in this paper and the formula is shown as follows:
where is the fluctuating wind power spectrum; is the frequency of the fluctuating wind (Hz); is the ground roughness coefficient; is the wind speed at the standard height 10 m (m/s). The values of the parameters in the formula should be determined by the site landscape and the wind field conditions.
Above all, the simulated calculation method of random fluctuating wind velocity spectrum, power spectrum and the target spectrum can be illustrated by the flow chart in Fig. 8.
To date, the wind turbine systems with bucket foundations are built and in service in Qidong sea area of Jiangsu province. Take the offshore wind farm of 6 m water depth of Qidong sea area as a case study, of which the wind turbine foundation is a bucket foundation, the blades are the horizontal axis 2.5 MW offshore wind turbine blades, the rotor diameter, the rated speed, the wheel eccentric value and the hub height are 96 m, 18 r/min, 3.1 m and 90 m, respectively. According to the wind conditions of the wind farm, the basic wind speed is chosen as 28 m/s at the height 10 m in the fluctuating wind simulation. Combining the theory mentioned above and the harmonic superposition method, [16] a simulation program of the horizontal wind speed time history on each single point is written by Matlab software so as to conduct the simulation analysis of offshore wind farm and meanwhile, inspect the statistical characteristics of the obtained random samples. The simulation results of the fluctuating wind speed on top of the tower are illustrated in this section. The simulation outcomes of the time history and the power spectral density are presented in Fig. 9 and Fig. 10.
Fig. 8Flowchart of random fluctuating wind

Fig. 9Time history curve of the horizontal fluctuating wind speed
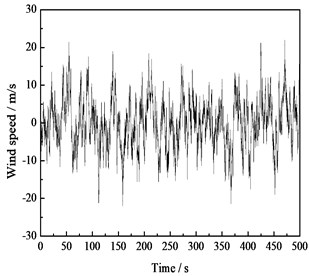
Fig. 10Spectrum verification of fluctuating wind speed
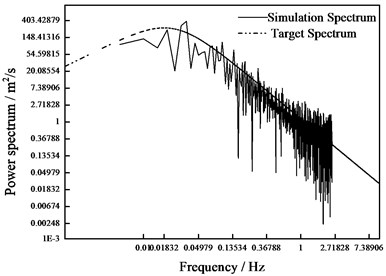
It can be seen from the results that the main statistical indexes of the fluctuating wind speeds obtained by simulation are relatively identical with the theoretical values, that is to say, the simulated fluctuating wind spectrum is close to the target spectrum, which proves the feasibility and accuracy of the simulation method. However, the low frequency part of the simulated power spectrum has a relatively great discrepancy with the target spectrum. Therefore, the data of this part can be ignored in practical application to eliminate the influence of the transient effect on the result.
The wind speed acting on any point of the structure is the summation of the average wind speed and the fluctuating wind speed. Then the wind load time history acted on the wind tower can be calculated after he transient wind speed time history curve are obtained, the calculation equation is shown as follows:
where is the air density, valued as 1.225 kg/m3; is the effective windward area; is the resistance coefficient, among which the tower resistance coefficient is 1.2 and the blade flow resistance coefficient is 0.2.
4.2. Calculation model of the random wave load
Different from onshore wind turbines, offshore wind turbines are subjected to ocean waves besides wind load. As the wave load is one of the main environmental loads acted on marine structures, the correct calculation of wave load has a great significance on practical engineering. In general, the variation of wave is regarded as a stationary random process so that the frequency domain distribution and the energy of the wave can be described by the power spectrum theory. Another more reasonable method is Fourier model, which is based on the physical mechanism in analyzing that wind generate wave. The theoretical calculation formula of Fourier random wave spectrum is shown as follows [17]:
where suppose that the average wind speed at 10 min is the equivalent wind speed at the standard height 10 m; , is the peak frequency, is the adjustment coefficient of the spectrum peak frequency; represents the energy transfer coefficient; represents the amplitude; is the adjustment coefficient of the spectrum peak value; and are the spectral shape parameters; is the air density; is the acceleration of gravity.
The random wave model has 6 basic random variables, of which the distribution type and parameter value can be given by stochastic modeling method. On account of the relation between the Fourier density spectrum and the collection power spectrum, considering that the phase position is determined by the initial phase and the phase difference spectrum [18], the random wave can be expressed as follows:
where is the value of the random Fourier wave spectrum model at discrete points; is the random initial phase position; is the number of discrete points; is the phase difference spectrum; the random Fourier function is discrete in the region of [0, 2].
The samples’ random initial phase , the phase difference spectrum are produced and reserved by random number generation provided by Matlab procedure. The phase difference spectrum obeys normal distribution.
Fig. 11Elevation time history curve of the random wave surface
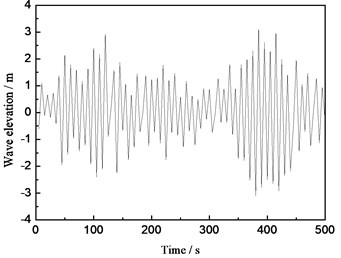
Based on Fourier principle, the random wave surface model is built by Matlab software and thus the wave spectrum under the random sea condition can be simulated. The simulation result is demonstrated in Fig. 11. It can be seen from the diagram that the elevation range of the wave surface is from –3 m to 4 m, which relatively agrees well with the measured results in this period.
In wave load analysis, Morison wave load calculation method, which divides the wave load into drag force and inertial force, is used to calculate the value of wave load acted on the foundation [7]. Wherein, the drag force is closely related to the speed of water particle while the inertial force is more related to the acceleration of water particle motion. Morison wave force calculation formula is shown in the following [19]:
where is the wave load acting on the vertical cylinder of each unit length, is the drag force coefficient; is the quality factor; is the density of sea water; is the horizontal velocity of the particle; is the horizontal acceleration of the particle.
4.3. Wind-wave coupling mechanism
At present, the study of mechanism and simulation of wind-wave coupling effect is a popular issue in offshore engineering research. Many researchers have carried out related theoretical and experimental studies and amounts of coupling theories and methods of wind-wave coupling effect have been put forward [20-22]. Among the rest, the most widely used one is the Turkstra method which is adopted and recommended by American standard A58. Turkstra method can produce reasonable results in most cases, is adopted in this paper to deal with the coupling analysis of random wind-wave load. As a certain difference exists between the responses under the wind and wave load effects for offshore wind turbine supporting system, the main load which produces larger response should be mainly considered and the secondary load of smaller response should also be taken into account when load combination is processed. Random time-history is applied to the main load and the maximum value is set as a dead load of the secondary load, then the two values are overlapped, which can not only protrude the time-domain characteristics of the main load, but also guarantee the safety of the structure. Turkstra coupling principle is to combine the maximum value of load effect in the region [0, ] and the transient values of other load effects respectively and finally set the maximum load effect combination as the control form. Therefore, the coupling combination of wind and wave is acquired as follows:
The wind load and wave load are served as random variables respectively, thus two load combinations are gained. In the formula above, is the superposition result of the maximum value of wind load and the time history of wave load in the region of [0, ], while is the superposition result of the maximum value of wave load and the time history of wind load in the region of [0, ], then is the maximum value among the results of and . Previous studies show that the dynamic response under wind load is far above that under wave load for offshore wind turbine supporting system [23-25]. Because the random wind load acts on the whole structure above the sea level, while the random wave load only acts on the section below the sea level, which makes the dynamic effect more significant under the wind load than that under the wave load of the same order of magnitude. Therefore, when load coupling of wind and wave is conducted based on Turkstra method, wind load should be taken as the main load and wave load should be taken as the secondary load. For the wind-wave load coupling in this paper, the maximum wave load is overlapped to the random wind load, which can indicate the time domain characteristics of wind load without ignore the most dangerous situation when wind and wave loads reach their maximum values at the same time.
5. Vibration characteristics analysis of the structure under wave load effect
5.1. Vibration model analysis
Modal analysis is fundamental to the dynamic characteristics analysis of a structure. When the natural frequency of the wind turbine supporting system is close to the rotation frequency of the blades, the resonance will be generated between the wind turbine and its supporting structure in the operational process. Hence the analysis of natural frequencies of the wind turbine supporting system is of great significance to dynamic characteristics analysis and resonance problems. According to modal analysis of the wind turbine and its supporting structure, the related vibration characteristics can be gained, which provide the basic data in the subsequent load analysis and dynamic response calculation of the structure. As the offshore wind towers are almost “long-thin” flexible structure, of which the higher-order frequencies are far more different from the excitation frequency of the blades while the first-order frequency is relatively close to the excitation frequency, the first-order frequency is more concerned in modal analysis of the wind turbine structure. The first six order frequencies are listed in Table 3, and the first three modes of wind turbine supporting structure are shown in Fig. 12.
Table 3Natural vibration frequency of wind power structure
Model | First-order | Second-order | Third-order | Fourth-order | Fifth-order | Sixth-order |
Frequency | 0.365 | 0.366 | 1.603 | 1.603 | 3.589 | 3.591 |
Fig. 12The first three modes of wind turbine supporting structure
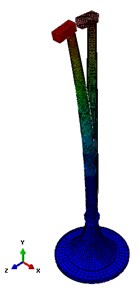
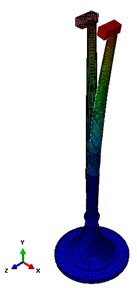
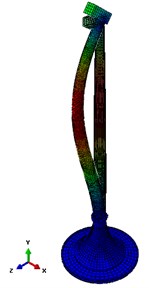
Fig. 13The first natural modal frequency of the offshore wind turbine structure

In the design of wind turbine supporting structure and the foundation, the natural frequency of the structure should be different from the rotation frequency of the blades in a certain extent to avoid resonance between the wind turbine and the supporting structure. Wind turbines with three blades are applied in a wide range due to its uniform force-bearing, elegant appearance and high energy conversion efficiency. The main exciting sources of this kind of blades are 1P frequency and 3P frequency, as the rotating speed of the commonly used 3 MW-6 MW wind turbines in operation is 8.35-18.4 rpm, the 1P running frequency range is from 0.139 Hz to 0.31 Hz while the 1P running frequency range is from 0.417 Hz to 0.93 Hz, which are shown in Fig. 13 [26-27]. From the graph, we can see that the natural frequencies of the wind turbine supporting system are effectively avoid the resonance region, meanwhile, the discrepancies between the first-order frequency and the rotating excitation frequency of the wind turbine are 17.74 % and 22.34 %, which meet the engineering requirement of ±10 %.
5.2. Dynamic characteristics analysis of offshore wind turbines
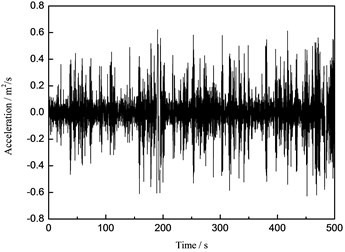
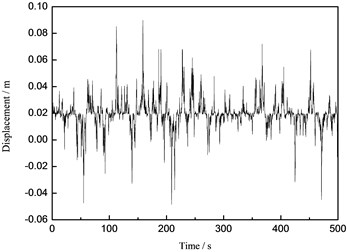
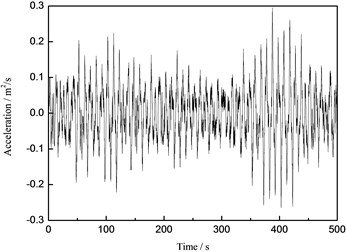
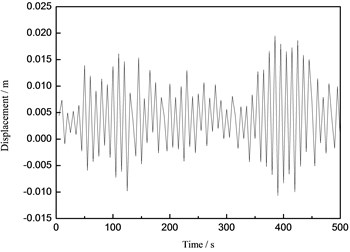
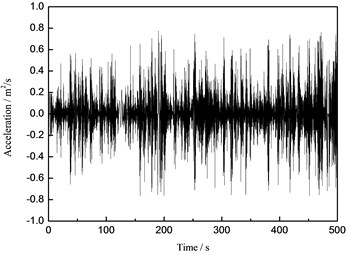
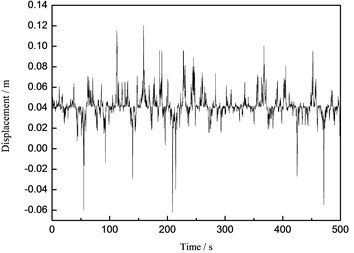
In order to analyze the different dynamic responses of the structure under the separate action of wind load, wave load and wind-wave coupling action, the random wind load, wave load and the coupling load are exerted on the finite element model using ABAQUS software. Then the corresponding acceleration, velocity, displacement and stress time history responses are obtained by calculation. Because of space limitation, only the most representative results are given. The horizontal displacement time history results of the tower top under different load actions are presented from Fig. 14 to Fig. 16.
Fig. 14The time history curve of the tower top under the wind load
a) Acceleration
b) Displacement
Fig. 15The time history curve of the tower top under the wave load
a) Acceleration
b) Displacement
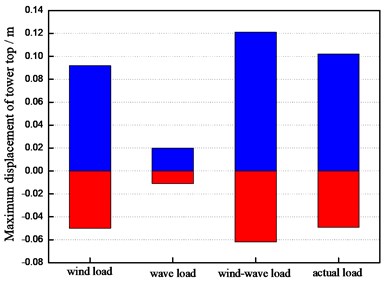
From the Figs. 14-16, it can be concluded that the maximum displacements of the tower top of the wind turbine supporting system are 0.092 m, 0.020 m and 0.121 m under the wind load, the wave load and the wind-wave coupling load, respectively. The maximum displacements of the tower top under the wind-wave coupling effect increase 31.52 % and 505.00 % respectively comparing to that under the separate wind and wave load, which shows obvious magnification effect of the wind turbine structure under wind-wave coupling effect. Take the maximum displacement of the tower top for example, the numerical simulation results and the measured values are compared and analyzed and the analysis result is demonstrated in Fig. 17.
It can be concluded from Fig. 13 that when the wind load or wave load is considered separately acted on the wind turbine supporting system, the maximum displacements of the tower top are less than the measured values, and that is to say, the actual load is insufficiently considered in the calculation. Consequently, based on this separate load action, the designed supporting structure system will have a potential safety hazard in actual operation, which will be incapable to meet the requirements of practical engineering. Under the wind-wave coupling load effect, the maximum displacement is relatively close to the measured value, which illustrates the preferable accuracy of the wind-wave coupling calculation method demonstrated in this paper. The displacements of the tower top increase 18.63 % and 6.78 % respectively comparing to the measure values in the positive upwind side and the negative upwind side. It shows that the load obtained by this wind-wave calculation method has a certain degree of increase than the actual value, which improves the safety coefficient so as to ensure the safety of the structure in practical operational process.
Fig. 16The time history curve of the tower top under the wind-wave coupling effect
a) Acceleration
b) Displacement
Fig. 17Contrast of tower top displacement under different loads
6. Conclusions
1) Based on the frequency domain method, the in-site measured acceleration signals of an offshore wind turbine are processed and analyzed and the dynamic characteristics of each part of the wind turbine supporting structure system are obtained.
2) According to the Fourier transform and the harmonic superposition method, the Davenport horizontal fluctuating wind speed spectrum is conducted and the fluctuating wind spectrum which coincides well with the target power spectrum is acquired. When lack of the measured information of the fluctuating wind, the simulation results based on this method can provide a relatively preferable reference to the wind turbine structure design.
3) On the basis of the random wave theory, the calculation equation of wave load for offshore wind turbine structures are put forward. Besides, the wind and wave coupling mechanism analysis is carried out by using Turkstra method. In numerical analysis, the integrated finite element model of the offshore wind turbine structure is established considering the interaction between the wind turbine foundation and the soil.
4) Through the modal analysis of the wind turbine supporting system, the natural frequencies of this type of structure are effectively avoid the resonance region, meanwhile, the discrepancies between the first-order frequency and the rotating excitation frequency of the wind turbine can meet the engineering requirement of ±10 %.
5) Wind-wave coupling load action has an obvious amplification effect on the dynamic characteristics of the wind turbine structure, which will lead to a relatively large increase comparing to that under separate wind or wave load. Therefore, the coupling effect of the two kinds of loads must be considered during structure design.
6) The calculation method of offshore wind turbine supporting structure under the random wind-wave coupling effect has a preferable accuracy as well as a certain amount of safety coefficient, which can ensure the safety of the structure in actual operation process.
References
-
Alavi A. H., Aminianb P., Gandomi A. H., Esmaeilib M. A. Genetic-based modeling of uplift capacity of suction caissons. Expert Systems with Applications, Vol. 38, Issue 10, 2011, p. 12608-12618.
-
Villalobos F. A., Byrne B. W., Houlsby G. T. Drained capacity of sunction caissons under monotonic loading for offshore applications. Soils Found, Vol. 49, Issue 3, 2009, p. 477-488.
-
Joselin H. G. M., Iniyan S., Sreevalsan E., et al. A review of wind energy technologies. Renewable and Sustainable Energy Reviews, Vol. 11, Issue 1, 2007, p. 1117-1145.
-
Byrne B. W., Houlsby G. T., Martin C. M., et al. Suction cassion foundations for offshore wind turbines. Wind Engineering, Vol. 26, Issue 3, 2002, p. 145-155.
-
Ding H. Y., Lian J. J., Li A. D., Zhang P. Y. One-step-installation of offshore wind turbine on large-scale bucket-top-bearing bucket foundation. Transactions of Tianjin University, Vol. 19, Issue 3, 2013, p. 188-194.
-
Zhang P. Y., Ding H. Y., Le C. H. Motion analysis on integrated transportation technique for offshore wind turbines. Renewable Sustainable Energy, Vol. 5, 2013, p. 053117.
-
Zhang P. Y., Xiong K. P., Ding H. Y., Le C. H. Anti-liquefaction characteristics of composite bucket foundations for offshore wind turbines. Renewable Sustainable Energy, Vol. 6, 2014, p. 053102.
-
Rocha M. M., Cabral S. V. S., Riera J. D. A comparison of proper orthogonal decomposition and Monte Carlo simulation of wind pressure data. Journal of Wind Engineering and Industrial Aerodynamic, Vol. 84, Issue 3, 2000, p. 329-344.
-
Deodatis G. Simulation of ergodic multivariate stochastic process. Journal of Engineering Mechanics, ASCE, Vol. 122, Issue 8, 1996, p. 778-787.
-
Davenport A. G. The spectrum of horizontal gustiness near the ground in high winds. Quarterly Journal of the Royal Meteorological Society, Vol. 87, Issue 372, 1961, p. 194-211.
-
Hiriart D., Ochoa J. L., García B. Wind power spectrum measured at the San Pedro Mártir Sierra. Revista Mexicana de Astronomia y Astrofisica, Vol. 37, 2011, p. 213-220.
-
Tanaka H., Davenport A. Wind-Induced response of golden gate bridge. Journal of Engineering Mechanics, Vol. 109, 1983, Issue 1, p. 213-220.
-
ASCE/SEI 7-05 Minimum Design Loads for Building and Other Structures.
-
ASCE/SEI 7-10 Minimum Design Loads for Building and Other Structures.
-
GB 50009-2012 Load Code for Design of Building Structures. China Architecture and Building Press, Beijing, 2012, (in Chinese).
-
Det Norske Veritas DNV-OS-J101 Design of Offshore Wind Turbine Structures Offshore Standard. 1st Edition. Det Norske Veritas, Oslo, Norway, 2004.
-
Cheng P. W. A Reliability Based Design Methodology for Extreme Response of Offshore Wind Turbine. Delft University of Technology, D. Delft, 2002.
-
Li Jie, Chen Jianbing The principle of preservation of probability and the generalized density evolution equation. Structural Safety, Vol. 30, Issue 1, 2008, p. 65-77.
-
Germanischer Lloyd Rules and Guidelines IV-Industrial Services, Part 2: Guideline for the Certification of Offshore Wind Turbines. Germanischer Lloyd, S. Hamburg, 2005.
-
American Petroleum Institute. RP2A-WSD recommended practice for planning, designing and constructing fixed off-shore platforms-working stress design. API Recommended Practice 2A-WSD, 21st edition, American Petroleum Institute, Dallas, 2000.
-
Prowell I., Veletzos M., Elgamal A., et al. Experimental and numerical seismic response of a 65 kW wind turbine. Journal of Earthquake Engineering, Vol. 13, Issue 8, 2009, p. 1172-1190.
-
Chen X. B., Li J., Chen J. Y. Analysis of dynamic characteristics of rotating wind turbine blade with centrifugal stiffening effect. Journal of Earthquake Engineering and Engineering Vibration, Vol. 29, Issue 1, 2009, p. 117-122.
-
Abhinav K. A., Saha Nilanjan Coupled hydrodynamic and geotechnical analysis of jacket offshore wind turbine. Soil Dynamics and Earthquake Engineering, Vol. 73, 2015, p. 66-79.
-
Adhikari S., Bhattacharya S. Dynamic analysis of wind turbine towers on flexible foundations. Shock and Vibration, Vol. 12, Issue 1, 2012, p. 37-56.
-
Harte M., Basu B., Nielsen S. R. K. Dynamic analysis of wind turbines including soil-structure interaction. Engineering Structures, Vol. 45, 2012, p. 509-518.
-
Dong X. F., Lian J. J., Yang M., et al. Operational modal identification of offshore wind turbine structure based on modified stochastic subspace identification method considering harmonic interference. Journal of Renewable and Sustainable Energy, Vol. 6, 2014, p. 033128.
-
Philippe M., Babarit A., Ferrant P. Modes of response of an offshore wind turbine with directional wind and waves. Renewable Energy, Vol. 49, 2013, p. 151-155.
About this article
This study was supported by the National Natural Science Foundation of China (Grant No. 51379142), International S&T Cooperation Program of China (ISTCP) (Research Grant No. 2012DFA70490) and the Tianjin Municipal Natural Science Foundation (Grant No. 13JCQNJC06900).
