Abstract
A novel rolling bearing fault diagnosis method based on improved local characteristic-scale decomposition (LCD), Teager energy operator (TEO) and softmax classifier is proposed in this paper. First, vibration signals are decomposed into several intrinsic scale components (ISCs) by using improved LCD; second, TEO and fast Fourier transform (FFT) are respectively used to extract instantaneous amplitude (IA) and frequency spectra of ISC1s, and then FFT is again employed to obtain spectra of IA; third, energy ratio of the resonant frequency band against the total, frequency entropy (FE) in the spectra of ISC1s and several amplitude ratios in the frequency spectra of demodulated ISC1s are extracted as fault feature vectors, and principal components analysis (PCA) is applied for dimensionality reduction; finally, these feature vectors are taken as inputs to train and test softmax classifier. As a new non-stationary signal analysis tool, LCD can decompose adaptively a signal into series of ISCs in different scales and give good results in situations where other methods failed. However, there are two main issues in this method, end effect and mode mixing, possibly leading to unexpected results. In this paper, a slope-based method and noise assisted analysis are applied to restrain the problems respectively. Experimental results show the proposed method performs effectively for bearing fault diagnosis.
1. Introduction
Rolling bearings take an important role in modern manufacturing industry, which makes its health monitoring and fault diagnosis great significant. When a rolling bearing operates with faults, its dynamic behavior is complex and non-linear, and the corresponding vibration signal presents non-linear and non-stationary characteristics, hence the key of bearing fault diagnosis is how to extract fault information from the non-stationary signals.
So far, researchers have proposed various feature extraction methods. Most of traditional methods such as time domain analysis, frequency analysis, and energy analysis are merely applicable to a stationary signal. Thus, time-frequency analysis has been increasingly applied in the analysis of non-stationary signals. The commonly used time-frequency method includes wavelet analysis [1], empirical mode decomposition (EMD) [2, 3], local mean decomposition (LMD) [4], etc. Nevertheless, wavelet transform is a non-adaptive data analysis method in nature. EMD can decompose a complex signal into some intrinsic mode functions (IMFs) and a residual, but it has some drawbacks, such as envelope overshoot or shortage, end effect, mode mixing. Though there are performance enhancements than EMD, LMD has problems of mode mixing, distorted components and being time-consuming. A novel time-frequency analysis method named LCD, was recently presented by Junsheng Cheng [5]. LCD is an adaptive non-stationary signal decomposition tool and suitable for processing vibration signals of bearings.
LCD has advantages over EMD and LMD in processing nonlinear and non-stationary signals because it can reduce invalid components and mode mixing; however, end effect and mode mixing also appears in LCD. Exploring appropriate methods to resolve end effect becomes a significant pursuit to LCD researchers. If the signal is predictable in physics, the best method may be a model-based method, e.g. AR (autoregressive) or ANN (artificial neural networks) extension. However, these methods are not computationally acceptable. A simpler method proposed by Rilling [6] is to ‘mirrorize’ the extrema closest to the edge. Dätig proposed a method based on the slopes of maxima and minima near both ends of the data series [7]. Mode mixing is another drawback of LCD, which is defined as a single ISC either consisting of signals of widely disparate scales [8]. Usually, mode mixing is a consequence of the intermittency or noises [9]. To solve the mode mixing of EMD, a subjective intermittence test algorithms was proposed by Huang [10]. A masking signal method was presented by Deering [11]. However, it is difficult to choose the masking signal. A noise-assisted signal analysis approach called ensemble EMD (EEMD) was proposed by Huang [8]. Admittedly, EEMD is a great breakthrough for the good performance.
Generally, fault information is modulated at the high frequency band. TEO [12] can obtain IA of signals. Because of its simple calculation, avoidance of negative frequency, and satisfactory demodulation effectiveness, TEO was used for computing the IA.
The rest of the paper is organized as follows. Section 2 presents the proposed method in detail; in Section 3, this method is applied to the experimental data; and the conclusions are given in Section 4.
2. Methodology
2.1. An improved LCD method
In this paper, slope-based method (SBM) is used to restrain end effect while noise-assisted analysis approach is applied to weaken mode mixing in the process of LCD.
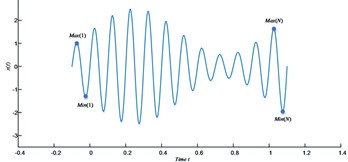
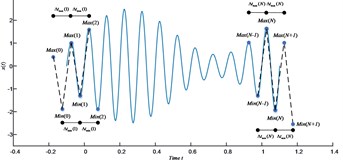
For the signal depicted in Fig. 1(a), let (, ) and (, ) be the coordinates of the th maximum and the th minimum . Fig. 1(b) considers the case when a maximum is the first extremum in the front of a signal. Then slope and slope are defined as:
Then, the time gaps between the first two successive maxima and minima are determined as and . The new boundary extrema and are newly defined and shifted according to the corresponding time gaps and , and gradients and . The coordinates of new extrema are located at:
Fig. 1a) The time series x(t); b) the illustration of the slope-based method
a)
b)
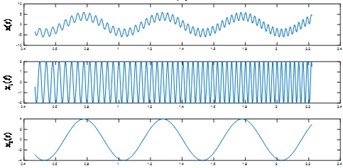
Here, we used LCD to analyze a simulated signal:
The result of LCD to using SBM and mirror method (MM) is shown in Fig. 2, from which we can see that LCD with SBM can decompose this signal more efficiently and accurately into a set of ISCs than with MM.
To restrain mode mixing, white noises are added to homogenize the scale in time-frequency space. To improve the decomposition performance of LCD, the ideas of EEMD are learnt and referred to in this study.
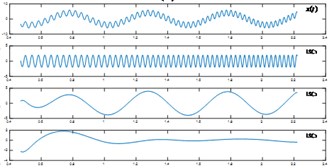
To verify the validity of this method, we analyzed a simulated signal shown in Fig. 3(a). Here, is a high-frequency intermittent signal with amplitude 0.1 and frequency 1600 Hz riding on the third peak of the sinusoidal signal. According to Fig. 3(b), the first is the mixture of both low-frequency sinusoidal and high-frequency intermittent signal, which means mode mixing occurs. Fig. 3(c) shows the noises assisted LCD can decompose the original signal more effectively ( 100).
Fig. 2a) The signal x(t); b) The result of LCD using MM; c) The result of LCD using SBM
a)
b)
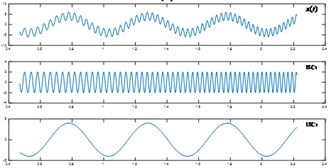
c)
Fig. 3a) The signal y(t); b) The result by original LCD; c) The result with added noises
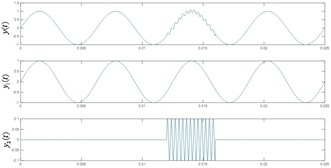
a)
b)
c)
2.2. Fault diagnosis scheme based on improved LCD, TEO and softmax classifier
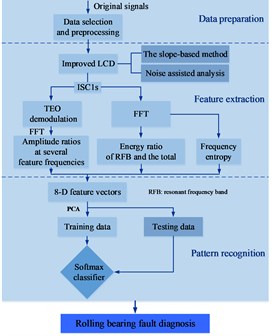
In this part, a new fault diagnosis approach based on improved LCD, TEO demodulation and softmax classifier is proposed. The scheme of fault identification is depicted in Fig. 4. The main steps are described briefly below:
(1) Decompose preprocessed signals into several ISCs using improved LCD method.
(2) Obtain IA of ISC1s by calculating TEO, then extract frequency spectra of IA of ISC1s by FFT.
(3) Compute amplitude ratios at the inner race, outer race and ball fault frequency and their second harmonic frequency in the frequency spectrum of demodulated ISC1s, and apply FFT to obtain frequency spectra of ISC1s, calculate its frequency entropy (FE) and energy ratios of resonant frequency band (RFB) against the total. Then, an 8-Dimension feature vector is obtained.
(4) Use PCA for dimensionality reduction.
(5) Train softmax classifier using train data and identify fault modes of test data.
Fig. 4Flowchart of fault diagnosis
3. Case study
3.1. Data preparation
All vibration data are from Bearing Data Center of Case Western Reserve University. The drive end accelerometer data under the normal, inner race fault, outer race fault located at 6 o’clock and ball fault with fault diameters of 7 mils are selected and each datum is divided into 20 segments, and each segment has 6000 points.
3.2. Features extraction based on improved LCD-TEO and FE
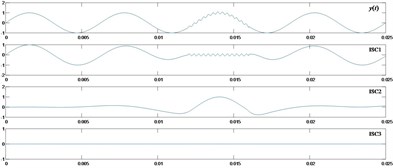
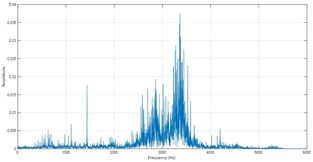
The original signals are decomposed into ISCs firstly. The ISC1 is extracted for the first few ISCs always contain the majority of fault information. Fig. 5 depicts the spectra of demodulated ISC1s. The three fault feature frequencies of inner race, outer race and ball fault are worked out. Next, several amplitude ratios mentioned above are computed.
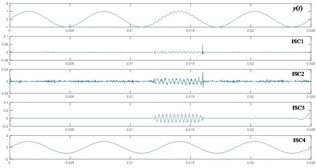
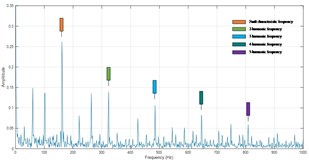
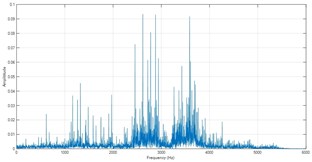
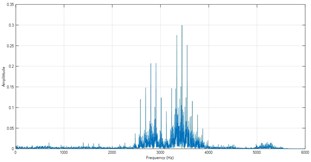
However, the identification performance only using feature variables comprised of amplitude ratios at several feature frequencies is just moderate, especially for the ball fault. The spectra of ISC1s are shown in Fig. 6, and two new feature variables, energy ratio of resonant frequency band against the total and frequency entropy are added into the feature vector. At last, a complete 8-D feature vectors, are extracted as intrinsic information of bearing fault. Here, the basic principle of entropy is briefly introduced. Entropy is defined to measure complexity and self-similarity of the series, and can reflect complexity changes of intrinsic oscillation.
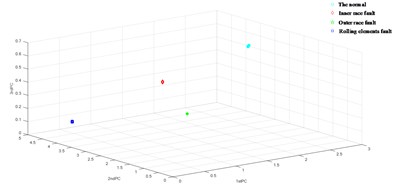
3.3. Feature reduction using PCA
For a diagnosis model, the huge amount of features will probably decrease the robustness, and even cause a decline in the diagnostic accuracy. Therefore, high dimensional features are projected into a three-dimensional space by PCA.
With feature visualization, we analyzed these obtained features. As shown in Fig. 7, the extracted feature vectors by the improved LCD method has good clustering results, therefore this method has high robustness and diagnosis accuracy.
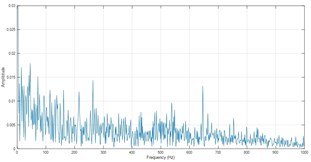
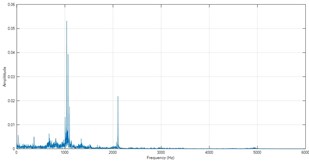
Fig. 5Spectra of IA of ISC1s
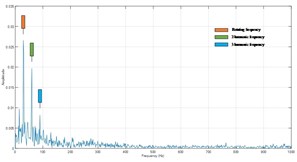
a) The normal
b) Inner race fault
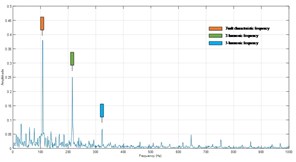
c) Outer race fault
d) Ball fault
Fig. 6Frequency spectra of ISC1s
a) The normal
b) Inner race fault
c) Outer race fault
d) Ball fault
Fig. 7Features clustering chart with improved LCD
3.4. Pattern recognition using softmax classifier
3-Dimension fault feature vectors of bearings are obtained by feature extraction and dimension reduction method. Softmax classifier is employed to recognize automatically faults. Identification results are listed partly in Table 1.
The proposed approach can identify effectively fault patterns of bearing and has the high accuracy.
Table 1Results of fault identification
Class | Number | Class | Number | ||||||||||
1 | 11 | 4.783 | 0.430 | 0.121 | 1 | 1 | 3 | 51 | 0.797 | 0.448 | 0.162 | 3 | 3 |
12 | 5.110 | 0.462 | 0.130 | 1 | 52 | 0.797 | 0.449 | 0.162 | 3 | ||||
… | … | 1 | … | … | 3 | ||||||||
20 | 4.862 | 0.437 | 0.123 | 1 | 60 | 0.793 | 0.449 | 0.161 | 3 | ||||
2 | 31 | 0.066 | 0.303 | 1.200 | 2 | 2 | 4 | 71 | 0.611 | 4.533 | 0.196 | 4 | 4 |
32 | 0.066 | 0.303 | 1.198 | 2 | 72 | 0.604 | 4.505 | 0.190 | 4 | ||||
… | … | 2 | ... | … | 4 | ||||||||
40 | 0.065 | 0.303 | 1.202 | 2 | 80 | 0.608 | 4.521 | 0.188 | 4 | ||||
- are feature variables after PCA; represents the predicted label; stands for the diagnosis decision | |||||||||||||
4. Conclusions
In this study, the slope-based method is applied to restrain end effect and the noise-assisted analysis is utilized to weaken mode mixing in the decomposition process of LCD. Therefore, a novel bearing fault diagnosis method based on improved LCD, TEO and softmax classifier is proposed. Experimental results show that the proposed method produces the satisfactory diagnostic performance. Further works can be focused on studying its adaptability to different working conditions and different fault severities.
References
-
Mahdi Ebrahimia Bashir Novel indices for broken rotor bars fault diagnosis in induction motors using wavelet transform. Mechanical Systems and Signal Processing, Vol. 30, 2012, p. 131-145.
-
Peng Z. K., Tse Peter W. An improved Hilbert-Huang transform and its application in vibration signal analysis. Journal of Sound and Vibration, Vol. 286, Issue 1, 2005, p. 187-205.
-
Du Q. H., Yang S. N. Application of the EMD method in the vibration analysis of ball bearings. Mechanical Systems and Signal Processing, Vol. 21, Issue 6, 2007, p. 2634-2644.
-
Li Y. B., Xu M. Q. Application of CBSR and LMD in reciprocating compressor fault diagnosis. Journal of Vibroengineering, Vol. 17, Issue 1, 2015, p. 203-215.
-
Zheng J. D., Cheng J. S., Yang Y. A rolling bearing fault diagnosis approach based on LCD and fuzzy entropy. Mechanism and Machine Theory, Vol. 70, 2013, p. 441-453.
-
Rilling G., Flandrin P. On empirical mode decomposition and its algorithms. IEEE-EURASIP Workshop on Nonlinear Signal and Image Processing, Vol. 3, 2003, p. 1-5.
-
Marcus Dätig Performance and limitations of the Hilbert-Huang transformation (HHT) with an application to irregular water waves. Ocean Engineering, Vol. 31, 2004, p. 1783-1834.
-
Wu Z. H., Huang N. E. Ensemble empirical mode decomposition: a noise-assisted data analysis method. Advances in Adaptive Data Analysis, Vol. 1, Issue 1, 2009, p. 1-41.
-
Zheng J. D., Cheng J. S. Partly ensemble empirical mode decomposition: an improved noise-assisted method for eliminating mode mixing. Signal Processing, Vol. 96, 2014, p. 362-374.
-
Huang N. E., Shen Z. A new view of nonlinear water waves-the Hilbert spectrum. Annual Review of Fluid Mechanics, Vol. 31, 1999, p. 417-457.
-
Deering R. The use of masking signal to improve empirical mode decomposition. IEEE International Conference on Acoustics, Speech, and Signal Processing, Vol. 4, 2005, p. 485-488.
-
Rahurkar Mandar A. Frequency band analysis for stress detection using a Teager energy operator based feature. 7th International Conference on Spoken Language Processing, 2002.
About this article

This research was supported by the National Natural Science Foundation of China (Grant Nos. 61074083, 50705005 and 51105019), as well as the Technology Foundation Program of National Defense (Grant No. Z132013B002).
