Abstract
Doped lanthanum niobate thin films were deposited using magnetron sputtering technique. W and Mg cathodes were used for doping LaNbO4 thin films. Thin films were deposited on two types of substrates: amorphous optical quartz (SiO2) and polycrystalline Alloy 600 (Ni-Cr-Fe). The structural and morphological analysis was performed using X-ray diffraction (XRD), scanning electron microscopy (SEM), energy dispersive spectrometry (EDS), atomic force microscope (AFM). The nonequilibrum growth of the thin films and the nonlinear dynamics of the sputtered atoms and their oxides is observed. XRD analysis revealed that Mg promotes crystallite formation in La1-xMgxNbO4 thin films and W inhibits crystallite formation in LaNb1-xWxO4 thin films. EDS analysis showed that La1-xMgxNbO4 and LaNb1-xWxO4 thin films are nonstoichiometric. They have deficit or excess oxygen and Nb (compared to lanthanum). It was noticed that the nonstoichiometry has influence on the morphology of thin films. The cross section of formed thin films analysis showed that grains or fibers are not visible in the thin films with excess oxygen concentration and thin films with deficit of oxygen has fiber type structure. Oxygen concentration also influences the surface morphology. The roughness of the surface increases (0.2 nm ÷ 0.3 nm for La1-xMgxNbO4 and 0.2nm ÷ 0.8 nm for LaNb1-xWxO4) with decreasing oxygen concentration.
1. Introduction
The formation of the thin films by depositing particles on a substrate and controlling the surface properties enable to get the materials for various technological applications. The physical properties of the thin films are strongly related to their morphologies and surface roughness. Despite the large investigation on proton conductivity of doped LaNbO4, there is a lack of their morphology and structure investigations [1-3]. Strength, toughness, hardness, thermal expansion coefficient, density and electrical properties change under influence of microstructure. For example, strength of nanocomposite materials increases with decreasing grain size and proton conductivity decreases due to phase transition and space charge effect in grain boundaries [4-6].
Microstructure depends on the formation method and doping effects. The most attractive dopants for substitution on the La site are Ca2+, Sr2+, Mg2+ and on the Nb site are Ti4+, Sn4+, Zr4+ [7]. These elements have the lowest solution energy and similar ionic radii to La3+ and Nb5+ respectively. The solubility of the dopants is up to 1 mol % in it [3]. LaNbO4 is usually synthesized and formed via conventional solid state reaction, spray pyrolysis, spin coating, screen printing, pulsed laser deposition, etc. [8-12].
Magnetron sputtering method was not used for deposition of doped LaNbO4 thin films, although thin films deposited using this method are clean, dense, have good adhesion and etc. In addition, the deposition processes are quite well investigated, especially the growth evolution and the dynamics of the atoms and particles deposited on the substrate and forming the thin films. The deposition of the atoms and particles is described through two main models: random deposition with surface relaxation and the migration of the particles to reproduce surface layer by layer. The obtained structure of the film can be described using structure zone models (SZM). Three structure zone models are known: Movchan-Demchishin SZM, Thornton SZM and Barna-Adamik SZM [13-15]. Two of these models (Thornton and Movchan-Demchishin) are conventional and one (Barna-Adamik) is derived.
Movchan-Demchishin model describes structure evolution of coatings during physical vapor deposition process [15]. According to it, thin film structure depends on substrate temperature () and coating material melting temperature () ratio. The growth of thin films is divided into three zones: zone I (0,3), zone II (0,30,45) and zone III (0,45).
Thornton model describes structure evolution during sputter deposition process. This model suggests that the structure of the films depends on argon pressure and on substrate temperature () and coating material melting temperature () ratio. The growth is also divided into zones: zone I ( 0,1), zone (0,10,3), zone II (0,30,5) and zone III (0,5) [14].
Barna-Adamik SZM states that impurities and dopants have influence on the thin film growth [13]. The impurities and dopants can interact with the surface in two ways. Dopants dissolve in crystal lattices or segregate on the growing crystal faces [16]. So, impurities which are dissolved in to lattices have no influence on the growth of the coating. The influence of the impurities increases with increasing their concentration in coating. It is also known that impurities can promote (promoters) or inhibit (inhibitors) grain growth. For example, oxygen is inhibitor and tin is promoter for aluminum [13]. Therefore the aluminum grains shrink with increasing oxygen concentration and widen with increasing tin concentration.
As mentioned above there is lack of investigations on structure of doped lanthanum niobate. There is investigated only Mg and Ca influence on phase transition from low temperature monoclinic (Fergusonite) to high temperature tetragonal (Scheelite) [17, 18]. Transition can be described as a shear transformation in which the Scheelite structure is partially conserved while certain sheets are slightly shifted [19]. It is known that Mg and Ca dopants decrease phase transition temperature [18, 19]. Fergusonite-to-Scheelite transition of pure lanthanum niobate occurs at 510±15 °C and of doped at 490 °C. However, it is possible that not all the materials have such effect. In case of doped TiO2, dopant radius and valence influence phase transition [20]. In addition dopant concentration has influence on strains of crystal lattice and strains may influence phase transition [21, 22].
Three magnetrons system used in these experiments gives very complex morphological structure which can not be described by convectional statistical mechanics. There are a few dynamic models describing the morphological evolution of the thin film growth. Dynamic scaling theory considers the surface with fractal morphology which is resulted by surface diffusion and random fluctuations during growth [23, 24]. Drotar‘s dynamic growth model is extending the dynamic scaling model by taking into account shadowing (sputtered particles stick to the surface on the highest surface points) and re-emission (non-sticking particles on the lowest surface points) processes [24, 25]. These models give large discrepancy between theoretical and experimental approaches for complex materials. Monte Carlo simulation methods that include shadowing and re-emission effects during the thin film growth were successful in explaining thin film growth and states that the values of surface roughness and surface growth in general do not depend on the experimental system [24]. Therefore the aim of our work is to investigate the influence of Mg and W dopants concentration on the dynamics of formation of lanthanum niobate thin films using magnetron sputtering technique.
2. Experimental
LaNb1-xWxO4 and La1-xMgxNbO4 thin films were formed using magnetron sputtering technique on amorphous optical quartz (SiO2) and polycrystalline Alloy 600 (Ni-Cr-Fe) substrates. The substrates were cleaned in an ultrasonic bath in pure acetone and treated with Ar+ ion plasma (10 min) before deposition. The temperature of the substrates was 300 °C during deposition. The substrate was rotated in order to achieve greater homogeneity (rotation speed – 8 RPM).
Three magnetrons system was used to form doped lanthanum niobate thin films. La (pulsed, 150 kHz) and Nb (DC) cathodes were used for the deposition of LaNbO4 thin films and Mg (DC) or W (DC) cathodes were used for doping (Table 1 and Table 2). The deposition was done in Ar (30 sccm) and O2 (6 sccm) gas environment.
X-ray diffractometer “Bruker D8 Discover” and “EVA” software were used to determine the structure of the deposited thin films. Measurements were carried out in a 20°-70° range using Cu Kα (0.154059 nm) radiation.
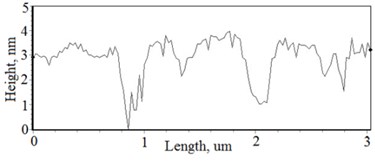
The surface profiles of the doped lanthanum niobate thin films were scanned with an atomic force microscope “AFM NT-206” (dynamic mode, resolution 0.1 nm). The roughness () was calculated using surface profilograms and “Surface Explorer” software. Mathematical expression of surface roughness is:
where – number of scanning points, – vertical distance from the mean line to the th data point.
The cross sectional images of the surface were made using scanning electron microscope “Hitachi S-3400N”. Elemental composition analysis was carried out with energy-dispersive X-ray spectroscope – “Bruker XFlash QUAD 5040”.
3. Results and discussion
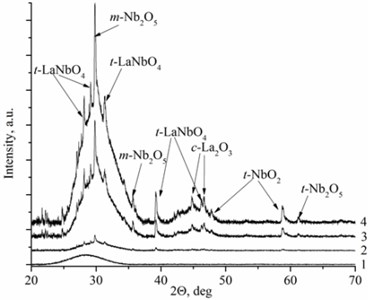
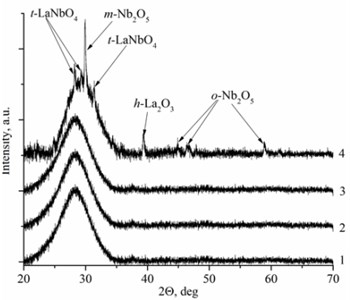
Deposited thin films have two types of the structure: nanocrystalline and amorphous. La1-xMgxNbO4 thin films have nanocrystalline structure if Mg concentration is higher than 0.4 mol % (Fig. 1(a)). LaNb1-xWxO4 thin films are amorphous if W concentration is higher than 1 mol % (Fig. 1(b)). Nanocrystalline materials are formed due to inhibiting or promoting properties of dopants. EDS measurements prove this assumption. Peaks intensities are higher in XRD spectra with increasing magnesium molar concentration in the thin film (Fig. 1(a), Table 1) and show that Mg promotes crystallite formation. Different situation is with tungsten dopants. Peaks disappear in XRD spectra with increasing tungsten molar concentration in thin film and show that W inhibits crystallite formation.
Fig. 1XRD spectra a) La1-xMgxNbO4 thin films formed on opticalquartz substrates, 1÷ cMgf= 0.1 mol %; 2 ÷ cMgf= 0.4 mol %; 3 ÷ cMgf= 0.7 mol %; 4 ÷ cMgf= 1.1 mol %; and b) LaNb1-xWxO4, thinfilms formed on opticalquartz substrates, 1÷ cWf= 6 mol %; 2 ÷ cWf= 1.7 mol %; 3 ÷ cWf= 1.3 mol %; 4 ÷ cWf= 1 mol %
a)
b)
Mg doped LaNbO4 thin films have secondary phases of La2O3, NbO2 and Nb2O5 and W doped LaNbO4 thin films have secondary phases of La2O3 and Nb2O5 (Fig. 1). La2O3 and Nb2O5 were formed due to random collisions between metal atoms and oxygen on the substrate surface. It means that niobium, lanthanum and oxygen may form LaNbO4, La2O3, NbO, NbO2, Nb2O5 and etc. On the other hand, metal oxide could be sputtered from the target [26].
EDS investigation of La1-xMgxNbO4 and LaNb1-xWxO4 thin films (Table 1 and Table 2) showed that all La1-xMgxNbO4 films have excess of oxygen. There were also noticed that almost all films have deficit of Nb comparing to La. The excess of oxygen can be explained by oxygen interstitials and the deficit of Nb can be explained by the existence of La2O3, NbO2, Nb2O5 secondary phases (Fig. 1(a)). Low La, Mg and Nb particle flux (or partial pressure) compared to oxygen flux (or partial pressure) can influence the formation of oxygen interstitials [27].
There is a different situation in LaNb1-xWxO4 thin films. Thin films have deficit or excess of oxygen and excess (compared to La) of Nb. The explanation of oxygen excess or deficit is similar to La1-xMgxNbO4 case. Low La, Mg and Nb particle flux compared to oxygen flux influence the formation of oxygen interstitials and high La, Mg and Nb particle flux compared to oxygen flux influence oxygen vacancy formation. Excess of Nb appeared because of pure niobium sputtering domination against niobium oxide sputtering. In addition, La2O3 and Nb2O5 secondary phases were formed in thin films (Fig. 1(b)).
Table 1Elemental composition of deposited La1-xMgxNbO4 thin films measured by EDS
Power of magnetrons, W | Molar concentration of element in film, mol % | Amount of Mg in film compared to La (La1-xMgxNbO4), mol % | |||||
200 | 200 | 130 | 9.8 | 13.8 | 76.3 | 0.1 | 1.3 |
200 | 150 | 130 | 12.7 | 11.9 | 75.0 | 0.4 | 3.0 |
200 | 160 | 150 | 13.7 | 10.3 | 75.4 | 0.7 | 4.8 |
200 | 150 | 100 | 14.0 | 11.9 | 73.0 | 1.1 | 7.2 |
200 | 200 | 100 | 14.3 | 21.9 | 62.3 | 1.5 | 9.6 |
Table 2Elemental composition of deposited LaNb1-xWxO4 thin films measured by EDS
Power of magnetrons, W | Molar concentration of element in film, mol % | Amount of Mg in film compared to La (La1-xMgxNbO4), mol % | |||||
200 | 120 | 3 | 10.7 | 10.0 | 78.3 | 1.0 | 9.0 |
200 | 150 | 5 | 14.5 | 28.6 | 55.6 | 1.3 | 4.4 |
200 | 120 | 8 | 10.0 | 9.6 | 78.7 | 1.7 | 15.0 |
200 | 140 | 20 | 15.2 | 25.5 | 53.3 | 6.0 | 19.0 |
200 | 150 | 40 | 10.3 | 21.7 | 59.0 | 9.0 | 29.3 |
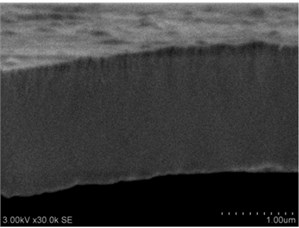
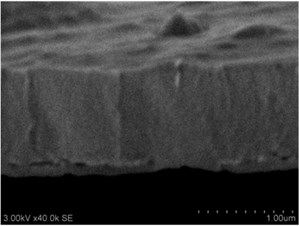
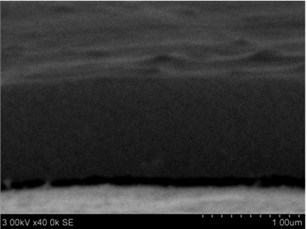
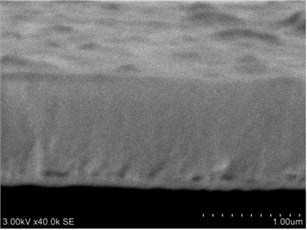
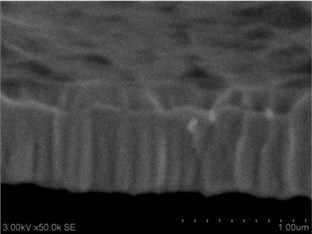
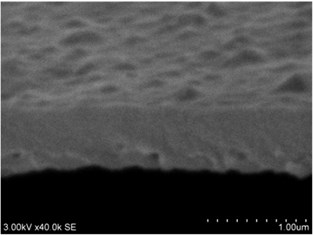
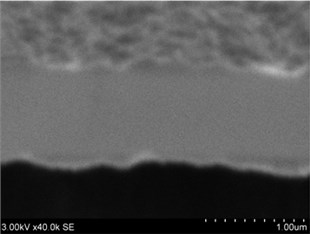
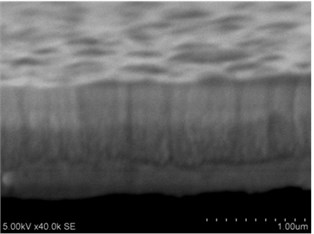
Thin films are dense and have no cracks and pores (Fig. 2. and Fig. 3.). There are also not visible columnar and grainy structures in cross sectional images. In comparison, thin films formed by pulsed laser deposition have big pores and voids [12].
Grains are not visible in Mg doped LaNbO4 thin films due to low substrate temperature (300°C) comparing to LaNbO4 melting temperature (1650 °C) and high impurities concentration. It agrees with Thornton and Barna-Adamik models [13, 14]. Substrate surface has high energy at low temperatures. So surface diffusion is very low and this leads to the formation of small grains. In addition, La1-xMgxNbO4 thin films have La2O3 and Nb2O5 secondary phases and undissolved Mg. Undissolved Mg acts as promoter and secondary phases may act as inhibitors and/or promoters for grain growth. However, the biggest influence has oxygen excess. It is known that oxygen acts as inhibitor in Al grain growth process [13]. It limits grain boundary migration process and diffusion processes. So, oxygen may have the same effect for LaNbO4 thin films. Oxygen concentration should be 66.6 mol % in stoichiometric LaNbO4. In comparison, oxygen concentration varies from 76.3 mol % to 73 mol % in deposited La1-xMgxNbO4 thin films and from 78.7 mol % to 53.3 mol % in deposited LaNb1-xWxO4 thin films. LaNb1-xWxO4 thin films have fibrous grains (Fig. 3(a), (g)) if thin film has deficit of oxygen and that proves the influence of oxygen.
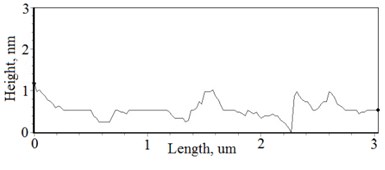
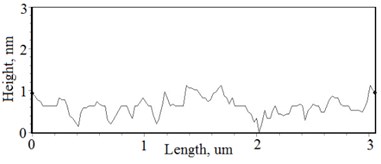
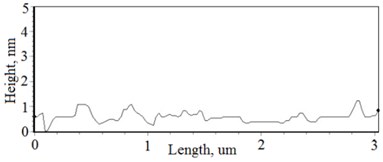
Fig. 2a), c), e), g) SEM cross section images and b), d), f), h) AFM profilograms of La1-xMgxNbO4 thin films: a) and b) – cOf= 78.3 mol %; c) and d) – cOf= 75 mol %; e) and f) – cOf= 75.4 mol %; g) and h) – cOf= 73 mol %
a)
b)
c)
d)
e)
f)
g)
h)
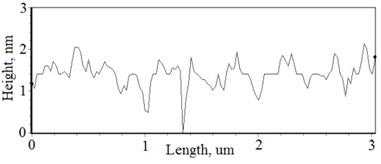
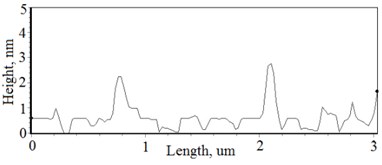
The nonequilibrum growth of the thin films is observed and the influence of oxygen excess and the concentration of the dopants is also visible in AFM profilograms (Fig. 3(b), (d), (f), (h)). It is seen that the roughness height distribution over the surface is changing non linearly depending on the dopants concentration in excessive oxygen environment (Fig. 4).
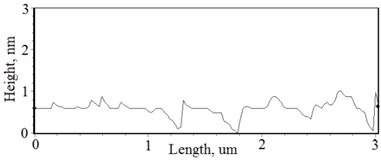
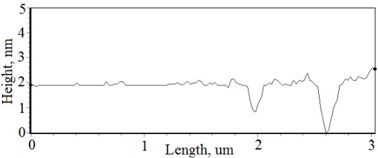
Fig. 3a), c), e), g) Cross section photos and b), d), f), h) profilograms of LaNb1-xWxO4 thin films: a) and b) – cOf= 55.6 mol %; c) and d) – cOf= 78.3 mol %; e) and f) – cOf= 78.7 mol %; g) and h) – cOf= 53.3 mol %
a)
b)
c)
d)
e)
f)
g)
h)
With technological parameters being the same for all the experiments, the growthing mechanism of the thin films is changed due the influence of the dopants. According to the XRD and AFM profilograms the surface roughness is increasing by increasing the Mg concentration and the cristallinity of the formed thin films. The amorphous thin films (Fig. 1(a), profilogram 1) exhibit smooth surface as the growth of the thin film is depicted as layer by layer growth with low mobility of atoms (adatoms) forming amorphous films. As the cristallinity increases the density of the nucleation centers increases also and facilitates the process of coallescence (Fig. 5).
Fig. 4The roughness dependence on Mg and W concentration in La1-xMgxNbO4 and LaNb1-xWxO4 thin films respectively
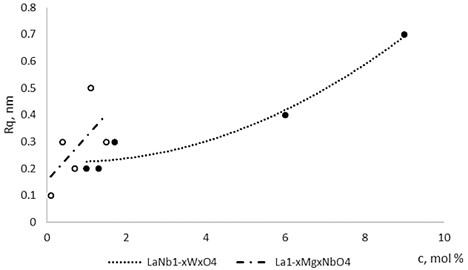
Fig. 5Grain size dependence on dopants concentration
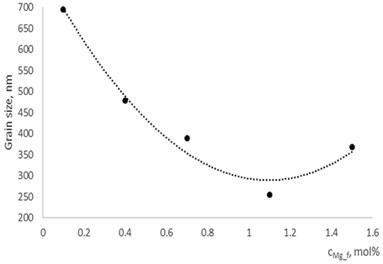
a) In La1-xMgxNbO4 thin films
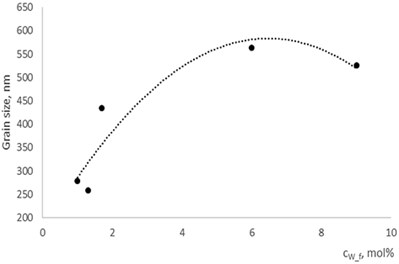
b) In LaNb1-xWxO4thin films
Thin film surface has higher roughness with decreasing oxygen concentration in La1-xMgxNbO4 thin films (Fig. 6). The same situation is in LaNb1-xWxO4 thin films. The roughness calculations prove it. increases from 0.2 nm to 0.3 nm with decreasing oxygen concentration in La1-xMgxNbO4 thin films and from 0.2 nm to 0.8 nm in LaNb1-xWxO4 thin films.
Fig. 6Roughness dependence on oxygen concentration in La1-xMgxNbO4 and LaNb1-xWxO4 thin films
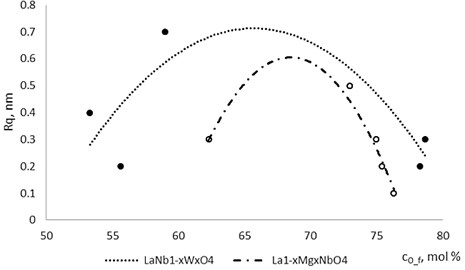
This shows that dynamics of the atom diffusion process is faster at oxygen deficit conditions than at oxygen excess conditions. The surface roughness is changing non monotonously. Other authors achieved similar results. P. Gondoni et al. formed AlZnO thin film by pulsed laser deposition at room temperature at different oxygen pressures. Thin films formed at higher oxygen pressure had smaller grains [28]. Kai-Huang Chen et al. also noticed that (Bi3.25Nd0.75)(Ti2.9V0.1)O12 films deposited using DC magnetron sputtering has smaller grains with increasing oxygen concentration in thin film [29].
4. Conclusions
The nonequilibrum growth of the thin films and the nonlinear dynamics of the sputtered atoms and their oxides is observed. Deposited La1-xMgxNbO4 and LaNb1-xWxO4 thin films have two types of the structure, nanocrystalline and amorphous. Nanocrystalline materials formed due to inhibiting or promoting properties of dopants. It was found that Mg promotes and W inhibits crystallite formation.
Mg doped LaNbO4 thin films have secondary phases of La2O3, NbO2 and Nb2O5 and W doped LaNbO4 thin films have secondary phases of La2O3 and Nb2O5. It happened due to technological deposition parameters: metal and metal oxides sputtering ratio, oxygen flux and etc.
La1-xMgxNbO4 and LaNb1-xWxO4 thin films are nonstoichiometric. They have deficit or excess oxygen and deficit or excess Nb (compared to lanthanum). Nonstoichiometric films formed due to existence of La2O3, Nb2O5, oxygen interstitials and undissolved Mg.
The existence of La2O3, Nb2O5, oxygen interstitials and undissolved Mg has influence on the microstructure of thin films. SEM cross section images showed that thin films with lower oxygen concentration has fiber type structure. It means that oxygen acts as inhibitor during grain growth process.
Roughness height distribution over the surface is changing non linearly depending on the dopants concentration in excessive oxygen environement. Oxygen concentration influences surface microstructure. Thin film surface has higher roughness with decreasing oxygen concentration. increases from 0.2 nm to 0.3 nm in La1-xMgxNbO4 thin films and from 0.2 nm to 0.8 nm in LaNb1-xWxO4 thin films.
References
-
Amsif M., Marrero-López D., Ruiz-Morales J. C., Savvin S., Núñez P. Low temperature sintering of LaNbO4 proton conductors from freeze-dried precursors. Journal of the European Ceramic Society, Vol. 32, 2012, p. 1235-1244.
-
Fjeld H., Kepaptsoglou D. M., Haugsrud R., Norby T. Charge carriers in grain boundaries of 0.5 % Sr-doped LaNbO4. Solid State Ionics, Vol. 181, 2010, p. 104-109.
-
Mokkelbost T., Kaus I., Haugsrud R., Norby T., Grande T., Einarsrud M.-A. High-temperature proton-conducting lanthanum ortho-niobate-based materials. Part II: Sintering properties and solubility of alkaline earth oxides. Journal of the American Ceramic Society, Vol. 91, 2008, p. 879-886.
-
Fjeld H., Toyoura K., Haugsrud R., Norby T. Proton mobility through a second order phase transition: theoretical and experimental study of LaNbO4. Physical Chemistry Chemical Physics, Vol. 12, 2010, p. 10313-10319.
-
Helgee E. E., Lindman A., Wahnström G. Origin of space charge in grain boundaries of proton-conducting BaZrO3. Fuel Cells, Vol. 13, 2013, p. 19-28.
-
Shehata F. Preparation and characteristics of Cu-Al2O3 nanocomposite. Open Journal of Metal, Vol. 1, 2011, p. 25-33.
-
Mather G. C., Fisher C. A. J., Islam M. S. Defects, dopants, and protons in LaNbO4. Chemistry of Materials, Vol. 22, 2010, p. 5912-5917.
-
Bi Z., Peña-Martínez J., Kim J.-H., Bridges C. A., Huq A., Hodges J. P. Effect of Ca doping on the electrical conductivity of the high temperature proton conductor LaNbO4. International Journal of Hydrogen Energy, Vol. 37, 2012, p. 12751-12759.
-
Mokkelbost T., Andersen Ø., Strøm R. A., Wiik K., Grande T., Einarsrud M.-A. High-temperature proton-conducting LaNbO4-based materials: powder synthesis by spray pyrolysis. Journal of the American Ceramic Society, Vol. 90, 2007, p. 3395-3400.
-
Fontaine M. L., Larring Y., Haugsrud R., Norby T., Wiik K., Bredesen R. Novel high temperature proton conducting fuel cells: Production of La0.995Sr0.005NbO4−δ electrolyte thin films and compatible cathode architectures. Journal of Power Sources, Vol. 188, 2009, p. 106-113.
-
Lin B., Wang S., Liu X., Meng G. Stable proton-conducting Ca-doped LaNbO4 thin electrolyte-based protonic ceramic membrane fuel cells by in situ screen printing. Journal of Alloys and Compounds, Vol. 478, 2009, p. 355-357.
-
Magrasó A., Xuriguera H., Varela M., Sunding M. F., Strandbakke R., Haugsrud R. Novel fabrication of Ca-Doped LaNbO4 thin-film proton-conducting fuel cells by pulsed laser deposition. Journal of the American Ceramic Society, Vol. 93, 2010, p. 1874-1878.
-
Barna P. B., Adamik M. Fundamental structure forming phenomena of polycrystalline films and the structure zone models. Thin Solid Films, Vol. 317, 1998, p. 27-33.
-
Thornton J. A. Influence of apparatus geometry and deposition conditions on the structure and topography of thick sputtered coatings. Journal of Vacuum Science and Technology, Vol. 11, 1974, p. 666-670.
-
Movchan B. A. Study of the structure and properties of thick vacuum condensates of nickel, titanium, tungsten, aluminium oxide and zirconium oxide. Fizika Metallov i Metallovedenie, Vol. 28, 1969.
-
Saraiva M. Sputter Deposition of Mg Thin Films: The Effect of Cation Substitution. Gent, 2012.
-
Mielewczyk-Gryn A., Gdula-Kasica K., Kusz B., Gazda M. High temperature monoclinic-to-tetragonal phase transition in magnesium doped lanthanum ortho-niobate. Ceramics International, Vol. 39, 2013, p. 4239-4244.
-
Malavasi L., Ritter C., Chiodelli G. Investigation of the high temperature structural behavior of La0.99Ca0.01NbO4 proton conducting material. Journal of Alloys and Compounds, Vol. 475, 2009, p. 42-45.
-
Huse M., Skilbred A. W. B., Karlsson M., Eriksson S. G., Norby T., Haugsrud R. Neutron diffraction study of the monoclinic to tetragonal structural transition in LaNbO4 and its relation to proton mobility. Journal of Solid State Chemistry, Vol. 187, 2012, p. 27-34.
-
Hanaor D. A. H., Sorrell C. C. Review of the anatase to rutile phase transformation. Journal of Materials Science, Vol. 46, 2010, p. 855-874.
-
Jeong J. K., Choi J.-H., Hwang C. S., Kim H. J., Lee J.-H., Lee J.-H. Influence of Al doping on lattice strain and electrical properties of epitaxial GaN films grown by metalorganic chemical vapor deposition on Al2O3 substrate. Applied Physics Letters, Vol. 84, 2004, p. 2575-2577.
-
Jian L., Wayman C. M. Monoclinic-to-tetragonal phase transformation in a ceramic rare-earth orthoniobate, LaNbO4. Journal of the American Ceramic Society, Vol. 80, 1997, p. 803-806.
-
Family F., Vicsek T. Scaling of the active zone in the Eden process on percolation networks and the ballistic deposition model. Journal of Physics A: Mathematical and General, Vol. 18, Issue 2, 1985, p. 75-81.
-
Karabacak T. Thin-film growth dynamics with shadowing and re-emission effects. Journal of Nanophotonics, Vol. 5, 2011, p. 1-18.
-
Drotar J. T., Zhao Y.-P., Lu T.-M., Wang G.-C. Mechanisms for plasma and reactive ion etch-front roughening. Physical Review B: Condensed Matter and Materials Physics, Vol. 61, 2000, p. 3012-3021.
-
Snyders R., Dauchot J.-P., Hecq M. Synthesis of metal oxide thin films by reactive magnetron sputtering in Ar/O2 mixtures: an experimental study of the chemical mechanisms. Plasma Processes and Polymers, Vol. 4, 2007, p. 113-126.
-
Yang B.-C., Liu X.-Y., Gao F., Ma X.-L. Photoluminescence properties of ZnO thin films prepared by DC magnetron sputtering. Journal of Central South University Technology, Vol. 15, 2008, p. 449-453.
-
Gondoni P., Ghidelli M., Fonzo F. D., Carminati M., Russo V., Bassi A. L. Structure-dependent optical and electrical transport properties of nanostructured Al-doped ZnO. Nanotechnology, Vol. 23, 2012, p. 365706-365714.
-
Kai-Huang C., Chien-Min C., Sean W., Chin-Hsiung L., Jen-Hwan T. The influence of vanadium doping on the physical and electrical properties of non-volatile random access memory using the BTV, BLTV, and BNTV oxide thin films. Advances in Ferroelectrics, InTech, 2012.
About this article

This research is funded by the European Social Fund under the Global Grant measure.
